
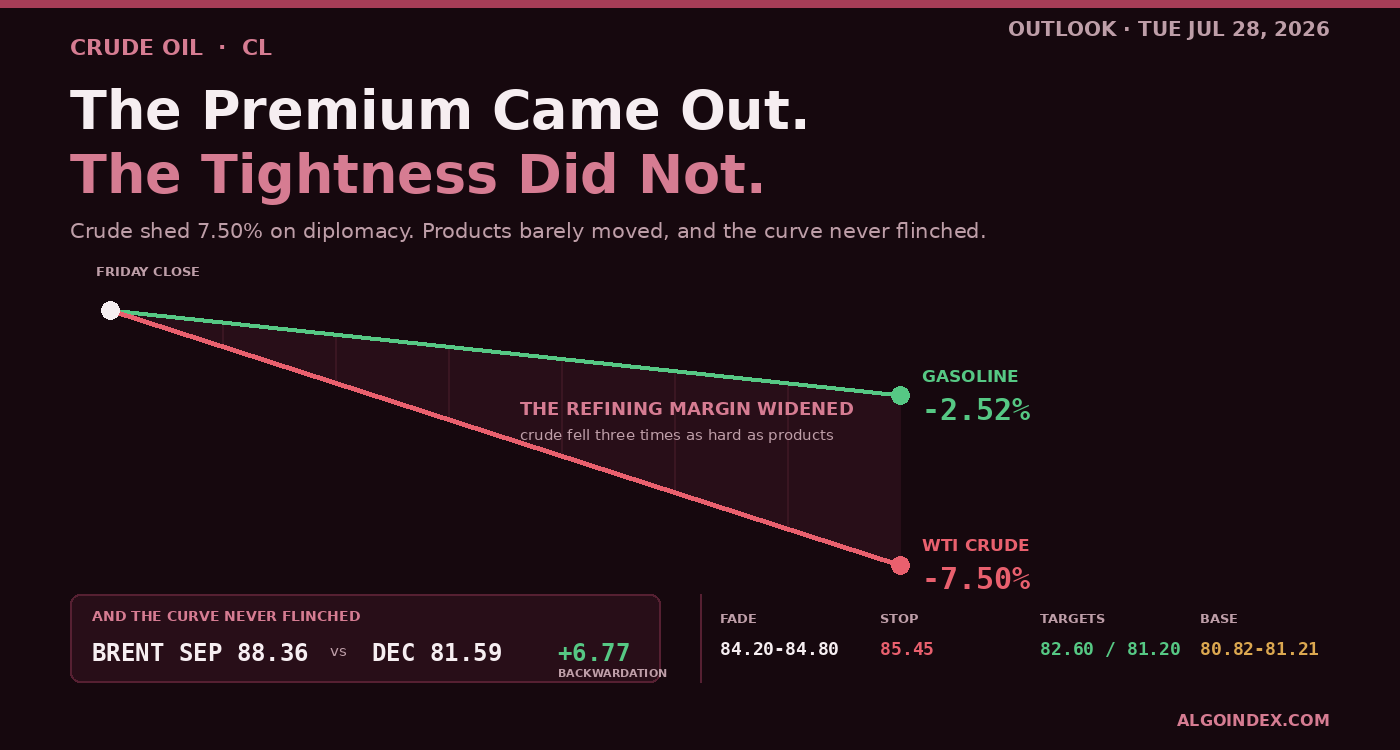
September crude gave up 6.70 on Monday and settled at 82.61. That is 7.50 percent, the steepest single day this contract has produced in the current cycle, and no technical trigger had anything to do with it. Roughly three weeks of accumulated conflict premium came out of the price in one session. Friday's reversal opened the first crack in that premium. Monday finished the job.
The selling was in place before the bell and it never really paused. Monday opened at 86.12, better than three handles under Friday's 89.31 settlement, tagged 86.20 in the opening minutes, and then went one direction for the remainder of the day until it found 81.63. Total travel came to 4.57 handles. Set that beside a 4.19 reading on the 14-day true-range measure and the market covered a bit more ground than a normal day allows, all of it pointed the same way, with no two-sided auction inside it. Turnover printed 328,172 contracts. The 20-day norm sits closer to 248,880. People participated.
What did it
A run of Middle East headlines. Three days passed with no further strikes. Iran signalled it would hold off on retaliation while it talked to Oman about the Strait. Then, shortly after midday, the President told reporters that Iran is looking to sit down and that an agreement could happen. Losses steepened from that moment. A supply item arrived in the same window: Kazakhstan restarted flows on the Caspian consortium line, idled for a week by Black Sea trouble, putting back barrels the market had spent days treating as absent.
Both are real. Neither is the whole picture.
The premium came out. The tightness did not.
Three separate pieces of evidence say the barrels themselves never signed off on Monday's price, and they all lean the same way.
Start with the curve. Brent September settled 88.36. Its December counterpart marked 81.59. Call it six dollars and change of backwardation over a three-month span, and it came through the collapse untouched. Prompt barrels still command a large premium over deferred ones, which is the shape a physically tight market carries. Had traders genuinely concluded the supply threat was gone for good, the front of the curve would have caved toward the back. It didn't move.
Then the cracks. Gasoline lost 2.52 percent on the day. Diesel lost roughly 2.70. Crude lost 7.50. Put the products on a barrel basis and gasoline works out near 139.75 with diesel at 172.69, which places the derived three-two-one margin around 68.12 per barrel, wider tonight than it was on Friday. When a refining margin expands during a crude selloff, products are telling you they are the binding constraint. Over the weekend Houthi forces claimed strikes on facilities tied to the Saudi state producer at Jizan and Yanbu. Yanbu is the western end of the East-West pipeline, the route the kingdom built specifically so its barrels would not have to pass through Hormuz. Striking it goes after the workaround itself. Products noticed. Crude looked past it.
And the positioning. As of July 21, non-commercial accounts carried 81,689 contracts of net length, having added 19,006 across the reporting week, with managed money net long 63,979. Those figures predate the top. Price peaked at 93.50 on the 23rd and has handed back 11.69 handles since, and the report captures none of the exit. Exactly one day of that unwinding has happened so far. It rarely wraps up that fast.
Where price actually landed
This is the part that argues against chasing. The decline stopped on top of a genuine shelf. The 50-day average marks 80.82. Its 100-day counterpart marks 81.13, all of 0.31 higher. Halfway back across the 13-week span lands at 81.21, and the unsmoothed stochastic midpoint prints 81.06. Four references inside forty cents, sitting directly under Monday's 81.63 low. Anyone who trades longer-term mean reversion has a defined spot to work from, and this is it.
Look up and the picture is equally specific. From 84.29 up to 84.79 the board stacks four items: the 9-day crossover, then 84.54 where the market hands back 38.2 percent of its 13-week climb, then a 40-day stall marker at 84.72, then second pivot support half a dime higher. Four independent levels inside fifty cents. That is the densest supply on the chart and the most probable place for a recovery attempt to die.
Scale matters here too. July bottomed at 67.12 on the 2nd and topped at 93.50 on the 23rd. Monday's settlement sits near 59 percent of that span, so a 7.50 percent day gave back roughly 41 percent of the month's climb and nothing more. Measured from June 26 the contract remains 18.80 percent higher. Price holds above the 20-day at 77.25, above both middle averages, above 70.42 on the 200-day, and above 75.38 on the year-to-date line. Only the 5-day at 86.91 sits overhead.
Momentum is split, and the split is the point
Unsmoothed, the 9-day stochastic now reads 26.19 percent. Smoothed, the identical measure prints 81.20. A 55-point spread opens up like that when the averaging window still holds the climb toward 93.50 inside it. Those smoothed lines have to roll over across the next couple of sessions whatever price does. Read them alone and this market looks healthy. The unsmoothed series is the one telling the truth tonight.
Relative strength on the 14-day gave up 14.36 points inside one session and still finished at 53.01, north of the neutral line. Nothing here is oversold. The projections put that reading at 50 only when price reaches 79.80. Directional measures have not turned either: positive direction still exceeds negative on the 9-day, the 14-day, the 20-day and the 50-day. A 9-day trend reading above 50 alongside a violent counter-move usually marks the opening of a corrective phase rather than a finished reversal, and corrective phases trade two ways.
The multi-indicator composite fell from 48 percent buy to 8 percent buy in one session. Short-term components read 20 percent buy, medium-term 25 percent sell, long-term neutral. That collapse is a fair numeric summary of the day: severe damage to the near frame laid over a structure that is still intact underneath.
How to trade Tuesday
The primary setup is a short, and it is a fade rather than a chase. Sell into the band running 84.20 up to 84.80, stop at 85.45 above the 85.26 first deviation, and work targets at 82.60, then 81.20, then 80.10. Risk off an 84.50 fill is 0.95 handles, so the first objective pays about two to one and the third about four and a half. Acceptance over 85.30 on a fifteen-minute basis kills the idea. One wick poking through does not count.
The conditional long lives at the base. Take the 81.30 through 81.70 pocket on a rejection wick, or buy 82.30 back once the base has survived a test, stop at 80.45 under both averages and under the 80.31 retracement. Targets run 83.40, 84.30, 86.10. It exists because the curve and the cracks insist the barrels underneath never endorsed this decline.
Weighting the paths: a corrective range between roughly 81.00 and 84.30 is the base case at 45 percent, bearish continuation toward 80.31 and then 80.09 and 79.80 runs 30 percent, and a re-escalation reversal through 84.79 toward 86.20 carries 25 percent. That third path would gap rather than trend.
The one thing that overrides all of it
At 11:00 Eastern the President is pencilled in for a sit-down with Israel's Prime Minister, Iran on the agenda. That single window speaks directly to the premise behind Monday's decline. A readout leaning toward diplomacy extends it. A readout leaning toward pressure reverses it hard. Stay flat from 10:45 to 11:45, then come back once the market has chewed through the readout.
Two more live items deserve watching. Iran's central command stated during the session that any blockade attempt amounts to escalating the conflict, and the blockade remains in force. Separately, reports have the Senate opening votes on a Russia sanctions package as early as Tuesday. Sanctions on Russian energy restrict supply, and that vote would land in a market that has just finished dumping its risk premium. The reaction would not be gentle.
There is no inventory report Tuesday and no first-tier crude data. Consumer confidence at 10:00 with a 92.4 forecast and the 7-year auction at 13:00 are the scheduled items, and both are second-order for this contract. Wednesday is the heavy day, carrying inventories at 10:30 and the rate decision at 14:00 with a 3.75 percent hold expected. Expect Tuesday afternoon to thin out as participants square up ahead of it.
Three weeks of premium unwound in about six hours. Whether the tightness underneath follows it out takes considerably longer than six hours to find out, and the curve is currently voting no. Tuesday is the first installment on that question.
The complete data picture
Every number behind Tuesday’s plan, charted first; the full numeric reference follows underneath.
Full numeric reference , every remaining figure from the review
| Open / high / low | 86.12 / 86.20 / 81.63 |
| Settlement | 82.61, down 6.70, a decline of 7.50 percent |
| Prior settlement | 89.31 |
| Final electronic mark | 81.91 |
| Opening gap against prior settlement | 3.19 handles lower |
| Total range | 4.57 handles, 1.09 times the 14-day average true range |
| Upper wick / lower wick from settlement | 0.08 / 0.98 |
| Settlement position in the daily bar | lower 21 percent |
| Volume | 328,172 contracts against a 20-day average of 248,880 |
| Final 4-hour candle | open 82.62, high 82.96, low 81.63, close 81.91 |
| Decline from the July 23 high at 93.50 | 11.69 handles, 12.5 percent |
| One month | up 12.96, or 18.80 percent, since June 26 |
| July low / July high | 67.12 on July 2 / 93.50 on July 23 |
| Settlement within the July range | roughly 59 percent, about 41 percent retraced |
| Three months | opened 84.07, mark 81.91, down 2.18 or 2.59 percent |
| Three-month high / low | 95.30 on May 18 / 67.12 on July 2 |
| 52 weeks | up 19.34, or 30.92 percent |
| 52-week low | 55.49, mid-December 2025 |
| Distance beneath the annual high | 14.07 percent below 95.30 |
| 5-day | 86.91, spot 5.00 beneath |
| 9-day crossover projection | 84.29 |
| 20-day | 77.25, spot 4.66 above |
| 50-day | 80.82, spot 1.09 above |
| 100-day | 81.13, spot 0.78 above |
| 200-day | 70.42, spot 11.49 above |
| Year-to-date | 75.38, spot 6.53 above |
| 50-day to 100-day convergence | 0.31 handles, 80.82 to 81.13 |
| 9-day | 51.77 |
| 14-day | 53.01, a decline of 14.36 on the session |
| 20-day | 52.45 |
| 50-day | 52.06 |
| 100-day | 52.65 |
| 14-day reaches 50 at | 79.80 |
| 14-day reaches 30 at | 55.19 |
| 9-day | raw 26.19 percent, %K 64.65 percent, %D 81.20 percent |
| 14-day | raw 49.12 percent, %K 75.73 percent, %D 86.64 percent |
| 20-day | raw 55.99 percent, %K 78.38 percent, %D 87.66 percent |
| 50-day | raw 52.41 percent, %K 73.37 percent, %D 75.31 percent |
| 9-day raw against smoothed gap | 55 points |
| 9-day | trend 50.84, positive 32.60, negative 18.45 |
| 14-day | trend 31.83, positive 31.26, negative 17.73 |
| 20-day | trend 21.32, positive 29.24, negative 18.16 |
| 50-day | trend 14.02, positive 25.45, negative 18.82 |
| Overall | 8 percent buy, average strength, weakening direction |
| Prior session | 48 percent buy |
| One week ago | 56 percent buy |
| One month ago | 72 percent sell |
| Short-term / medium-term / long-term | 20 percent buy / 25 percent sell / neutral |
| Historic, 9-day / 14-day | 65.60 percent / 65.29 percent |
| Historic, 20-day / 50-day | 56.63 percent / 49.84 percent |
| Average true range, 9-day | 4.50, or 5.50 percent |
| Average true range, 14-day | 4.19, or 5.12 percent |
| Average true range, 20-day | 4.05, or 4.95 percent |
| Average true range, 50-day | 3.70, or 4.52 percent |
| Average daily range, 9-day | 4.17, or 5.09 percent |
| Average daily range, 14-day | 4.02, or 4.91 percent |
| Average daily range, 20-day | 3.45, or 4.21 percent |
| One-range band around the 82.61 settlement | 78.42 to 86.80 |
| One-range band around the 81.91 mark | 77.72 to 86.10 |
| Pivot point, stale from the prior range | 89.94 |
| First ceiling | 82.30, third deviation turned resistance |
| Settlement magnet | 82.61 |
| Speed bump | 83.42 to 83.59 |
| Supply shelf | 84.29, 84.54, 84.72, 84.79 |
| Above the shelf | 85.26 first deviation, then 86.03 |
| Session structure | 86.12 open, 86.20 high |
| Full retracement of the decline | 86.91 and 87.05 |
| Extended | 88.52, 89.31, 89.94, 91.43, 91.72, 92.20 |
| Immediate | 81.63, Monday's low |
| Average base | 81.21, 81.13, 81.06, 80.82 |
| Next references | 80.31, 80.09, the round 80.00 handle, 79.80 |
| Deeper | 78.68 and 78.59 |
| Then | 77.85 to 77.88, then 77.20 |
| 20-day average, untested on the decline | 77.25 |
| Far downside | 76.47, 76.08, 75.40 |
| WTI September | 82.61, down 6.70, a decline of 7.50 percent |
| Brent September | 88.36, down 8.42, a decline of 8.70 percent |
| Gasoline August | 3.3273 per gallon, down 0.0820, a decline of 2.52 percent |
| Diesel August | 4.1116 per gallon, down approximately 2.70 percent |
| Natural gas August | 2.7670, down 0.104, a decline of 3.62 percent |
| Gasoline on a barrel basis | 139.75 |
| Diesel on a barrel basis | 172.69 |
| Derived three-two-one margin | approximately 68.12 per barrel |
| Brent premium over WTI | 5.75 handles |
| Brent September against December | 88.36 against 81.59, live September mark 87.66 |
| Crude index | down 36.72 to 452.76 |
| Equity index future | 7,448.25, higher by 0.01 percent |
| Technology index future | 28,190.00, lower by 0.33 percent |
| Volatility index | 18.68, higher by 0.59 percent |
| Gold | 4,077.0, higher by 0.15 percent |
| Dollar index | 101.52, higher by 0.05 percent |
| Two-year auction | high yield 4.315 percent against 4.189 percent prior, cover 2.660 against 2.640 |
| Five-year auction | high yield 4.408 percent against 4.200 percent prior, cover 2.280 against 2.350 |
| Seven-year, prior auction | high yield 4.260 percent, cover 2.500 |
| US durable goods | 0.3 percent against 1.8 percent forecast, prior negative 4.5 percent |
| US core durable goods | 0.6 percent against 0.8 percent forecast, prior 1.4 percent |
| German business climate | 86.6 against 86.0 forecast, prior 85.6 |
| German expectations component | 86.7 against 84.8 forecast |
| Commercial | long 896,294 down 27,070, short 1,004,895 down 3,557, net short 108,601 |
| Non-commercial | long 310,182 up 7,753, short 228,493 down 11,253, net long 81,689 up 19,006 |
| Managed money | long 187,469 up 6,308, short 123,490 up 4,303, net long 63,979 |
| Swap dealers | long 94,804 up 2,390, short 586,755 up 9,955 |
| Producers | long 673,702 down 26,405, short 290,352 down 10,457 |
| Other reportable | long 122,713 up 1,445, short 105,003 down 15,556 |
| Entry zone | 84.20 to 84.80 |
| Stop | 85.45 |
| Targets | 82.60, then 81.20, then 80.10 |
| Risk from an 84.50 entry | 0.95 handles |
| Reward | approximately 1:2.0, 1:3.5 and 1:4.6 |
| Invalidation | fifteen-minute acceptance above 85.30 |
| Entry zone | 81.30 to 81.70, or a reclaim of 82.30 |
| Stop | 80.45 |
| Targets | 83.40, then 84.30, then 86.10 |
| Risk from an 81.50 entry | 1.05 handles |
| Reward | approximately 1:1.8, 1:2.7 and 1:4.4 |
| Invalidation | fifteen-minute close beneath 80.30 |
| Corrective range | 45 percent, roughly 81.00 to 84.30 |
| Bearish continuation | 30 percent, 80.31 then 80.09 then 79.80, below which 78.59 opens |
| Re-escalation reversal | 25 percent, through 84.79 toward 86.20 and 86.91 to 87.05 |
| Low band | 79.50 to 80.30 |
| Base case | 81.00 to 84.30 |
| High band | 85.20 to 86.20 |
| Working range expectation | roughly 3.00 to 4.00 handles |
| 02:45 | French consumer confidence, forecast 85, prior 84 |
| 06:00 / 06:55 / 07:30 | Parcel, beverage and aerospace quarterly earnings |
| 09:00 | Case-Shiller twenty-city, forecast 1.3 percent, prior 1.1 percent |
| 10:00 | US consumer confidence, forecast 92.4, prior 91.2 |
| 11:00 | Meeting on Iran, tentative, the day's defining event |
| 13:00 | Seven-year note auction |
| 16:05 | Automotive and payments quarterly earnings |
| 21:30 | Australian inflation, 0.7 percent quarterly forecast against 1.4 percent prior, trimmed mean 3.7 percent against 3.5 percent |
| Wednesday 10:30 | Crude inventories, prior build 2.010 million barrels |
| Wednesday 14:00 | Rate decision, forecast 3.75 percent unchanged, press conference 14:30 |
| Thursday 07:00 | Bank of England decision |
| Thursday 08:30 | Core inflation, forecast 3.3 percent against 3.4 percent prior, with advance growth and claims |
| 12:25 | The President states Iran wants to meet and a deal is possible, losses accelerate |
| 15:03 | Iran's central command calls any blockade attempt an escalation of the conflict |
| 15:34 | The President characterises Iran as pleading against the blockade, confirming it stands |
| 15:36 | Yemen's foreign minister-designate cites security preparations for oil exports |
| 15:52 | Reports of an American drone destroyed in Anbar province, western Iraq |
| 16:44 | Iraq's national security adviser alleges third-party cells behind attacks there |
| 17:02 | Reports the Senate may open votes on a Russia sanctions package as soon as Tuesday |
| Weekend | Claimed strikes on facilities at the Red Sea ports of Jizan and Yanbu |



