
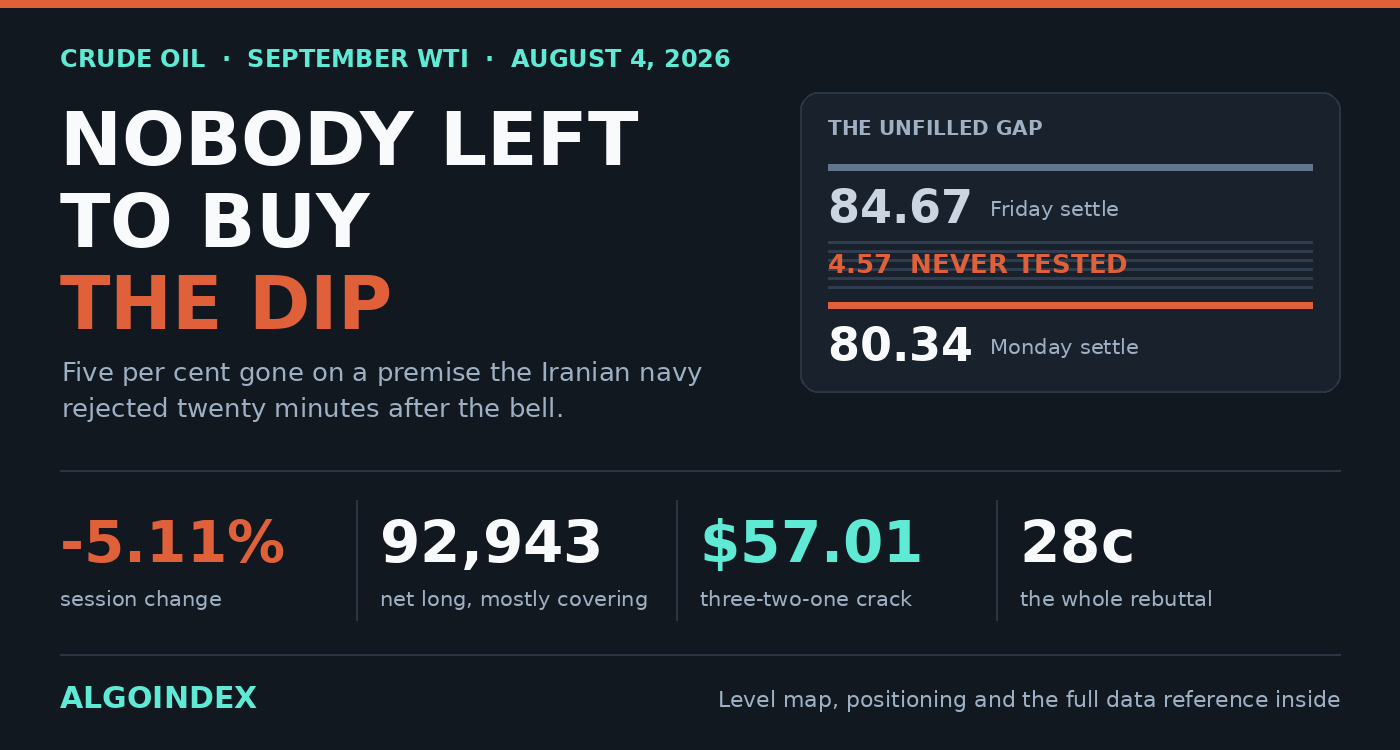
Crude lost five per cent on Monday because traders decided the Hormuz standoff was ending. Twenty minutes after the settlement bell, an Iranian general went on the record to say it is not. September WTI closed 4.33 dollars lower at 80.34, and then barely moved.
That sequence is the whole story of Tuesday. A market priced a premise, the premise got publicly repudiated by the party it depends on, and price responded by drifting 28 cents. Either Monday was right and the afternoon was posturing, or Monday was a mispricing that has not been corrected yet. Every level on the board matters less than which of those turns out to be true.
What actually happened
Friday finished at 84.67. The Sunday reopen printed 80.10, a 4.57-dollar hole torn open before American traders had a screen on. Selling continued through Asian and European hours down to 78.43. Overnight, per desk chatter, the worst print sat near nine per cent under Friday. By the time the American session got going the damage was done, and regular hours simply held above the overnight low, topping out at 81.30 before settling at 80.34.
At no point in the session did crude come within 3.37 dollars of where Friday finished. That gap remains untested and unfilled.
Open interest stood at 264,062 contracts. Volume printed 265,206. In one day, turnover ran past every contract outstanding. Position transfer on that scale is not a repositioning at the margin, it is a wholesale change in who owns the exposure.
Why the afternoon headline matters more than it looks
At 14:53 Eastern, a commander of Iranian naval forces publicly rejected the notion of a second corridor through the Strait and threatened to target warships providing escort. That is escalation, stated on the record, coming from precisely the party whose cooperation the entire bull-to-bear repricing had assumed.
Price went from 80.34 to 80.06. Noise.
Two readings are possible and they point opposite directions. One says the market has decided military rhetoric is theatre while the diplomatic track is what counts, in which case Monday was correct and the drift lower continues. The other says thin post-settle liquidity simply could not absorb the news, and Tuesday's open is where the reaction actually gets priced. Which of those is right will be obvious within the first hour, and until then a position taken on either interpretation is a bet on interpretation rather than on structure.
The positioning problem
For the week ending 28 July, managed money held 92,943 contracts net long. That figure by itself looks like conviction. Break it down and it is not conviction, it is surrender.
Of the 28,964-contract improvement in that net figure, 22,474 came from shorts covering and only 6,490 from new longs. Roughly 78 per cent of the shift was capitulation by bears, not accumulation by bulls. Non-commercial accounts as a whole tell the same story: 33,609 shorts covered against 4,810 longs added.
A market that grinds to a 93.50 high on short covering has spent its buyers before the top. When the gap opened Sunday night, the accounts that would ordinarily be first to buy a 4.57-dollar hole had already bought, back in the low nineties, at much worse prices. They won't double down. The longs who bought that covering rally are sitting underwater and are more likely to be the supply on any bounce than the bid beneath it.
Commercial hedgers, meanwhile, ran 218,477 short against 113,993 long. Producers are hedging, not accumulating. Nothing in the reported positioning suggests a base forming beneath price at these levels.
Three lines within seventy-four cents
Monday settled at 80.34. The 20-day average is 80.63 above it and the 50-day is 79.89 below. Three references, all of them inside 74 cents. Resolution out of that band probably sets the tone for the balance of the week.
Beneath, losing 79.89 strips away the last short-term support before Monday's low, and there is open air between there and the 40-day crossing at 78.12. Reclaim 81.65, where the 100-day sits, and the 5-day comes back into range at 82.44, with the unfilled gap behind it. The 200-day at 70.99 is far enough away to be irrelevant to a Tuesday session, though it does mark where the multi-month structure genuinely lives.
Oversold, but not for long enough to matter
Nine and fourteen-day raw stochastics read 15.39 and 15.45. Those are washed-out numbers. Relative strength at fourteen days, though, reads 49.17 after dropping 6.88 points, which is neutral. The slower stochastic lines at 37.81 and 46.95 have not caught up either.
That combination is the signature of a one-day shock, not of a decline that has matured. Two weeks of steady erosion would drag relative strength into the low thirties and leave the market genuinely compressed. It hasn't been oversold long enough to build the energy that usually produces a violent bounce, so the washed-out reading carries less signal here than it normally would. Treat 15.39 as information, not as a buy trigger.
Directional work says the same thing from another angle. At nine days, negative direction leads positive on a strength reading of 33.20, which is a real downtrend with force. At fourteen days positive still edges ahead. At twenty, fifty and a hundred days positive leads throughout. The bears own the short window and nothing beyond it.
Volatility is going the wrong way for tight stops
Historic volatility reads 75.08 per cent at nine days, 64.46 at fourteen, 63.91 at twenty, 51.23 at fifty and 50.64 at a hundred. Each shorter window sits above the longer one. That inversion is steepening, which means the market expects more movement rather than less.
True range confirms it: 4.86 dollars at nine days, or 6.05 per cent of price, then 4.53, 4.33, 3.85 and 3.17 as the lookback lengthens. One average range in either direction from Monday's settle spans the whole support base underneath, or every layer of resistance overhead. This contract has no comfortable middle right now. Stops belong wider and size belongs smaller than the level map alone would suggest.
The refined products disagree
Here's the piece that argues against the bearish read. The distillate crack is 82.50 dollars a barrel, from diesel at 3.8772 a gallon. Gasoline gives 44.26. The blended three-two-one margin comes to 57.01 dollars a barrel, which is extraordinary by any historical measure.
An 82-dollar diesel crack is not a demand signal. It reflects refining capacity and where product can physically move, consistent with Russian refining at its weakest in 24 years while Gulf product routing stays impaired. Margins that wide normally drag crude higher, because refiners bid aggressively for feedstock when the spread is that generous. Monday broke that relationship.
One of two things happens next. The link re-establishes, which pulls crude up and supports the bounce case. Or products start catching down toward crude, which would tell you the disruption really is being priced as over. That's worth more than any single crude level on the chart.
How to trade it
Primary trade: sell a retest of the broken shelf, 81.30 to 81.70, preferred fill 81.50. Six independent references stack inside forty cents there. Monday topped at 81.30. The 13-week midpoint retracement sits at 81.21 just underneath. Add the 18-day crossing at 81.69, 81.62 as a first resistance projection, 81.65 for the 100-day and 81.53 where support flipped.
Stop 82.95. That clears the 5-day, and it clears 82.89 where the second resistance projection lies. Sustained trade beyond 82.89 means the short-term average structure has been reclaimed and the premise is gone. Targets: 80.02 for the computed pivot, then 78.75 where a support projection lands on Monday's low, then 77.15. On 1.45 dollars of risk that pays roughly 1.0, 1.9 and 3.0 to one.
The conditional long is the mirror image. Half an hour of trade sustained over 82.95 says the afternoon headline is being repriced, and that 4.57-dollar hole turns into the magnet. Stop 81.20, targets 84.49, then 84.67 for the full fill, then 86.13. Risk 1.75 dollars.
If the overnight reopen gaps beyond 4.25 dollars, up or down, sit out until the opening range has completed. Skip it if the open sits and stays within 79.90 to 80.70, where the 50-day, the pivot and the 61.8 per cent retracement all converge and there is no directional edge. Skip it if any Gulf headline lands in the quarter hour before you intended to enter. And halve size or stand down entirely if nine-day volatility expands past 75.08 per cent, because stop placement stops being economically workable at that point.
The calendar is empty and that cuts both ways
Nothing energy-specific is scheduled. Trade balance at 08:30 Eastern with a negative 73 billion forecast, job openings and factory orders at 10:00, a Canadian manufacturing survey against a prior 53.0. The weekly government inventory report comes Wednesday, against a prior draw of 7.167 million barrels, and the customary private estimate goes around once Tuesday has closed. That report arrives after Tuesday's close.
Trading off levels does better through sessions carrying no scheduled resets, right up until the moment a headline crosses. On this contract, in this week, treat every level as a guide rather than a gate. The short is void outright on any confirmed shipping incident, on a strike, or on a formal collapse of the Oman-mediated track. Exit at market and don't try to manage around it.
The bearish structure is real for Tuesday. It's also one press conference deep.
Gold walked into Tuesday with the opposite problem, a chart pointing lower while the hedging picture pointed up. That one is here: Gold (GC): the chart says down, the hedging says up.The complete data picture
Every number behind Friday’s plan, charted first; the full numeric reference follows underneath.
Full numeric reference , every remaining figure from the review
Full data reference
Every figure behind the analysis above, for readers who want to check the work. September WTI crude, session of Monday 3 August 2026, all levels in dollars per barrel.
| Reference | Value |
|---|---|
| Contract | September WTI crude oil |
| Session date | Monday 3 August 2026 |
| Settlement | 80.34 |
| Change | down 4.33 |
| Change per cent | down 5.11 per cent |
| Session high | 81.30 |
| Session low | 78.43 |
| Sunday reopen | 80.10 |
| Prior settlement (Friday) | 84.67 |
| Gap on reopen | 4.57 lower |
| Post-settle drift | 80.06 |
| Volume | 265,206 |
| Open interest | 264,062 |
| Closest approach to prior settle | 3.37 away |
| Reference | Value |
|---|---|
| Pivot | 80.02 |
| 1st resistance | 81.62 |
| 2nd resistance | 82.89 |
| 3rd resistance | 84.49 |
| 1st support | 78.75 |
| 2nd support | 77.15 |
| 3rd support | 75.88 |
| 1st deviation projection | 82.14 |
| Flipped support projection | 81.53 |
| Reference | Value |
|---|---|
| Published pivot | 84.20 |
| Published 2nd support | 78.39 |
| Published 3rd support | 75.72 |
| Published target price | 86.13 |
| Stochastic 20 per cent projection | 80.61 |
| Reference | Value |
|---|---|
| 5-day | 82.44 |
| 9-day crossing | 85.36 |
| 18-day crossing | 81.69 |
| 20-day | 80.63 |
| 40-day crossing | 78.12 |
| 50-day | 79.89 |
| 100-day | 81.65 |
| 200-day | 70.99 |
| Year-to-date average | 75.62 |
| Reference | Value |
|---|---|
| 50 per cent of the 4-week range | 80.66 |
| 50 per cent of the 13-week range | 81.21 |
| 38.2 per cent off the 4-week high | 83.69 |
| 38.2 per cent off the 4-week low | 77.63 |
| 38.2 per cent off the 13-week low | 77.88 |
| 61.8 per cent off the 52-week low | 80.09 |
| Midpoint of the 52-week range | 75.40 |
| Momentum crosses 50 at | 80.80 |
| Reference | Value |
|---|---|
| 52-week high | 95.30 |
| 52-week low | not reached in the current structure |
| One-month high | 93.50 |
| One-month low | 67.82 |
| Three-month low | 67.12 |
| Reference | Value |
|---|---|
| 9-day raw stochastic | 15.39 |
| 14-day raw stochastic | 15.45 |
| 20-day raw stochastic | 46.56 |
| 14-day fast stochastic line | 37.81 |
| 14-day slow stochastic line | 46.95 |
| 14-day relative strength | 49.17 |
| Relative strength change | down 6.88 points |
| Reference | Value |
|---|---|
| 9-day positive direction | 22.49 |
| 9-day negative direction | 24.92 |
| 9-day strength | 33.20 |
| 14-day positive direction | 24.46 |
| 14-day negative direction | 22.82 |
| 14-day strength | 26.19 |
| Reference | Value |
|---|---|
| 9-day historic volatility | 75.08 per cent |
| 14-day historic volatility | 64.46 per cent |
| 20-day historic volatility | 63.91 per cent |
| 50-day historic volatility | 51.23 per cent |
| 100-day historic volatility | 50.64 per cent |
| 9-day true range | 4.86, or 6.05 per cent of price |
| 14-day true range | 4.53 |
| 20-day true range | 4.33 |
| 50-day true range | 3.85 |
| 100-day true range | 3.17 |
| Average daily range | 4.25 |
| Reference | Value |
|---|---|
| Managed money net long | 92,943 |
| Managed money long | 193,959 |
| Managed money short | 101,016 |
| Managed money longs added | 6,490 |
| Managed money shorts covered | 22,474 |
| Net positioning improvement | 28,964 |
| Share from short covering | 78 per cent |
| Non-commercial shorts covered | 33,609 |
| Non-commercial longs added | 4,810 |
| Commercial short | 218,477 |
| Commercial long | 113,993 |
| Reference | Value |
|---|---|
| Diesel | 3.8772 a gallon, or 162.84 a barrel |
| Distillate crack | 82.50 |
| Gasoline | 2.9667 a gallon, or 124.60 a barrel |
| Gasoline crack | 44.26 |
| Three-two-one crack | 57.01 |
| Reference | Value |
|---|---|
| True-range band | 78.08 to 82.61 |
| Daily-range band | 78.22 to 82.47 |
| Low scenario | 78.20 to 78.75 |
| Most likely | 79.30 to 81.60 |
| High scenario | 82.50 to 82.90 |
| No-edge zone | 79.90 to 80.70 |
| Reference | Value |
|---|---|
| Entry zone | 81.30 to 81.70 |
| Preferred fill | 81.50 |
| Stop | 82.95 |
| Target 1 | 80.02 |
| Target 2 | 78.75 |
| Target 3 | 77.15 |
| Risk | 1.45 |
| Reward to target 1 | 1 to 1.0 |
| Reward to target 2 | 1 to 1.9 |
| Reward to target 3 | 1 to 3.0 |
| Reference | Value |
|---|---|
| Trigger | thirty-minute close above 82.95 |
| Stop | 81.20 |
| Target 1 | 84.49 |
| Target 2 | 84.67 |
| Target 3 | 86.13 |
| Risk | 1.75 |
| Reward to target 1 | 1 to 0.9 |
| Reward to target 2 | 1 to 1.0 |
| Reward to target 3 | 1 to 1.8 |
| Time | Event |
|---|---|
| 06:30 | Pharmaceutical, industrial and consumer results |
| 08:30 | Trade balance, forecast negative 73 billion |
| 09:30 | Canadian manufacturing survey, prior 53.0 |
| 10:00 | Job openings and factory orders |
| 16:15 | Chip and launch-sector results |
| Wednesday | Weekly government inventory report, prior draw 7.167 million barrels |
| When | What |
|---|---|
| Weekend | Corridor talks reported at a final stage, a planned strike called off |
| 21:45 Sunday | Globex reopen gaps to 80.10 |
| Overnight | Low of 78.43, worst print near nine per cent under Friday |
| 14:53 Eastern | Iranian naval commander rejects a second corridor, threatens warships |
| Post-settle | Price drifts to 80.06, a 28-cent response |
| Reference | Value |
|---|---|
| Session change | down 5.11 per cent |
| Settle as share of the day's range | roughly 67 per cent, an upper-third close |
| Below the 52-week high | 15.84 per cent |
| Above the 52-week low | 44.53 per cent |
| 52-week low | 55.49 |
| Below the 23 July high | 14.07 per cent |
| 20-day change | positive 11.64 dollars, or 16.98 per cent |
| 50-day change | negative 9.81 dollars, or 10.90 per cent |
| 200-day change | positive 21.55 dollars, or 36.74 per cent |
| Year-to-date change | positive 23.19 dollars, or 40.68 per cent |
| Weighted alpha | positive 30.90 |
| One-month swing | 25.68 dollars |
| Three-month high | 95.30, set 18 May |
| Three-month low | 67.12, set 2 July |
| One-month high | 93.50, set 23 July |
| One-month low | 67.82, set 6 July |
| Reference | Value |
|---|---|
| 9-day | 46.62 |
| 14-day | 49.17, after a 6.88-point drop |
| 20-day | 49.80 |
| 50-day | 50.89 |
| 100-day | 51.88 |
| Reference | Value |
|---|---|
| Highest | 93.50 |
| Second | 90.01, aligned with the second resistance projection |
| Third | 87.34, the first resistance projection |
| Fourth | 84.67, Friday's settle and the origin of the unfilled gap |
| Reference | Value |
|---|---|
| Brent settlement | 83.77, down 4.16 or 4.73 per cent |
| Brent to WTI spread | 3.43 |
| Gasoline | down 4.74 per cent to a three-week low |
| September diesel | 3.8772 |
| Reference | Value |
|---|---|
| Commercials long | 871,589 |
| Commercials short | 1,030,411 |
| Commercial net short | 158,822 |
| Commercial longs reduced | 24,705 |
| Commercial shorts added | 25,516 |
| Producer longs cut | 25,095 |
| Producer shorts added | 6,465 |
| Swap-dealer shorts added | 24,317 |
| Reference | Value |
|---|---|
| Services survey | 52.8, against a 50.0 forecast and 49.7 prior |
| Prices paid | 71.1, eased from 73.0 |
| Final manufacturing reading | 53.9 |
| Time (Eastern) | Detail |
|---|---|
| 07:00 | Restaurant results, forecast 3.33 earnings on 7.12 billion revenue |
| 08:30 | Trade balance, forecast negative 73 billion |
| 09:30 | Canadian manufacturing survey, prior 53.0 |
| 10:00 | Job openings, forecast 7.445 million against a 7.594 million prior |
| 10:00 | Factory orders |
| 16:15 | Chip results, forecast 1.62 earnings on 11.31 billion revenue |
| 21:45 | Chinese services survey, forecast 53.7 against a 54.1 prior |
| Reference | Value |
|---|---|
| Multi-indicator composite | 32 per cent sell, weak signal strength, strengthening direction |
| Short-term indicators | 40 per cent sell |
| Medium-term indicators | 25 per cent sell |
| Long-term indicators | 67 per cent sell |
| Composite on Friday | 16 per cent buy |
| Composite a month ago | 88 per cent sell |
| Trend signal | still registers buy |
| Average daily range, 9-day | 4.67 |
| Average daily range, 14-day | 4.25 |
| Average daily range, 20-day | 4.09 |
| Reference | Value |
|---|---|
| Above the 50-day | 0.45 |
| Below the 100-day | 1.31 |
| Above the 200-day | 9.35 |
| Support shelf from retracements | 77.63 to 77.88 |
| Break-of-77.15 objective | the 75.40 to 75.88 area |
| Reference | Value |
|---|---|
| American manufacturing survey | 55.6, against a 53.9 forecast and 53.3 prior |
| A competing reading | 49.8, back below the expansion line |
| Swiss manufacturing | 53.2, against 54.9 expected |
| Restored South Pars gas | 60 million cubic metres |
| Most recent Federal Reserve policy vote | 9 to 3, dissenters favouring a 25 basis point increase |
| Suspected yen intervention | observed 30 and 31 July |
| Time | Detail |
|---|---|
| 14:22 | Negotiations framed publicly as a last chance |
| 14:24 | Follow-up remarks on the same theme |
| 14:53 | Iranian naval commander rejects a second corridor |
| 15:59 Central | Post-settle drift to 80.06 |
| Reference | Value |
|---|---|
| Broad American equity index | up roughly 1.5 per cent, near record territory |
| Regular-hours range for crude | 2.87 dollars, against the 4.57-dollar gap that preceded it |
| Three-two-one crack | roughly 57.01, described in the complex as cracks near 57 dollars |
| Gasoline value | 124.60 |
| Diesel value | 162.84 |
| Hedging context | an industry locking in 90-dollar crude |
| Swing pivot above | 90.01 |
| Year-to-date gain | 40.68 per cent, with the long-term uptrend unthreatened by one session |
| Path | Probability and description |
|---|---|
| Path A, controlled continuation lower | 45 per cent. Fails beneath 81.30, loses 79.89 in the American morning, works down to 78.75 and the 78.43 low |
| Path B, digestion and chop | 35 per cent. Holds 79.30 to 81.60 all session without reclaiming the 81.53 to 81.69 shelf, closes mid-band |
| Path C, headline-driven reversal | 20 per cent. Escalation or a shipping incident forces a reclaim of 82.90 and opens the gap toward 84.49 to 84.67 |
| Item | Detail |
|---|---|
| New Zealand unemployment | forecast 5.4 per cent, prior 5.3 per cent |
| 19:50 Eastern | Bank of Japan meeting minutes |
| 21:45 Eastern | Chinese services survey, forecast 53.7, prior 54.1 |
| Reference | Value |
|---|---|
| Front-month code | September 2026 delivery, CLU26 |
| Broad equity benchmark referenced | the S and P 500, up roughly 1.5 per cent |



