
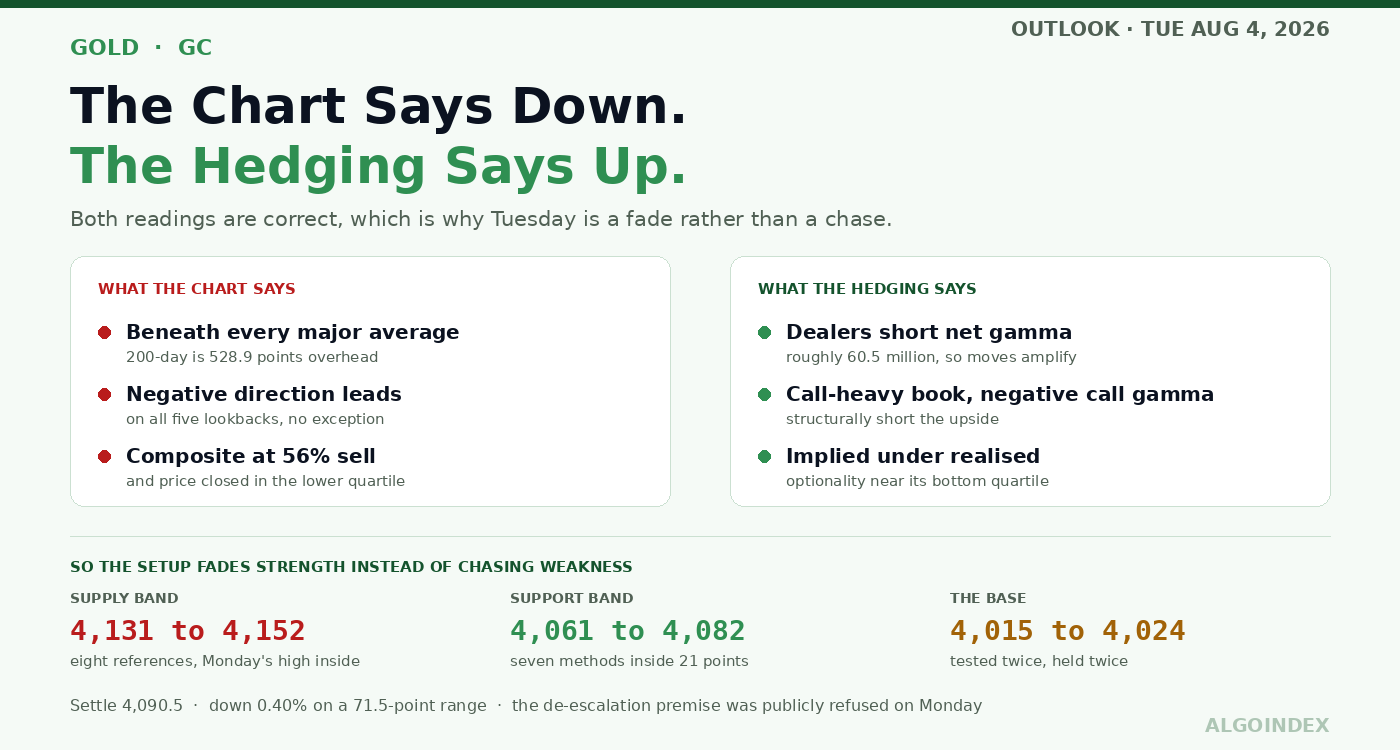
Read the chart and gold looks straightforwardly bearish. Under every average. Negative direction ahead of positive on all five lookbacks. Composite at 56 percent sell. Then read the hedging book, where dealers carry a structurally short position in upside, and the mechanics point elsewhere. Both readings are correct, which is why Tuesday is a fade rather than a chase.
A distribution day, not a liquidation
December gold gave up 16.5 points to settle 4,090.5, off 0.40 percent. Opening came at 4,135.2, the first hours pushed to 4,145.5, and and the rest of the day bled steadily into 4,074.0 at the low, settlement coming 16.5 points above it.
Total range: 71.5 points against a fourteen-day true range of 94.5. Contained rather than panicked. Open interest of 280,612 against 90,894 contracts traded says participation was real without being frantic.
Where the high failed is worth pausing on. The push to 4,145.5 ran straight into a shelf where a moving-average convergence stalls, a second deviation upper band sits, and a four-week midpoint retracement prints, three separate methods naming the same handful of points. Price failed there precisely.
What followed was one-way rotation. First the pivot went. Then the 18-day crossover, then the 9-day, and by afternoon price had worked through first deviation support to print the low. Settlement fell in the range's lower quartile, about 23 percent off the bottom, which is bearish by construction.
Except gold did not close on its low, and the electronic session has since recovered roughly twenty points. Sellers owned the day and declined to press the advantage into the evening.
The premium came out, and nothing replaced it
One driver, and not a domestic one. Tension eased across the Middle East, geopolitical risk premium collapsed right through the commodity complex, and crude did the transmitting. September settled 80.34, a fall of 4.33 dollars amounting to 5.11 percent, Brent finishing 83.77 after losing 4.16. Forward inflation expectations came down with it, equities added roughly 1.5 percent, moving toward record ground, and the haven bid under this metal drained away.
The dollar then made things worse in the least helpful possible order. Intraday it reached a seven-week low under pressure from collapsing oil and softer inflation expectations, then gave nearly the whole move back, closing 99.958, which is 0.04 percent higher. What turned it was July manufacturing at 55.6 where 53.9 was forecast, the quickest expansion in four years, its employment component jumping back into expansion at 52.8.
Morning took the haven premium out. Afternoon absorbed a firmer currency. Neither half of the day had both forces pointing anywhere helpful.
The rate picture is genuinely two-sided and deserves more precision than a label. A regional Fed president offered dovish commentary Monday, arguing that policy rates sit well positioned and that inflation eases through the year's second half. Supportive at the margin. Set against it, how the July vote came out: nine to three, every dissent wanting a quarter point higher instead of lower. Three members pushing for tighter policy does not describe a committee about to produce the fall in inflation-adjusted rates this metal would need before it re-rates. Prices paid at 71.1 adds to the same picture.
There is one structural item cutting the other way and it belongs on the record. Commentary published this week observed that July's press conference put fresh uncertainty into the reaction function and produced a currency headwind, specifically in the context of institutional independence. Slow-burning, and genuinely positive for this metal. No Tuesday session trades it, though it does limit how far any currency-led decline realistically runs.
The premise underneath Monday is fragile
Handle this part carefully. The complex may have travelled further than the facts underneath it warrant.
Nothing in the headline flow reads as resolved. Iranian military leadership stated Monday that no second corridor through the Strait would be permitted and that warships or forces brought there for the purpose would be targeted, and added that Iranian attacks ran on for two days once American strikes had stopped. Separately came a comment about facing no time constraint and wanting Iran given every last chance before anything more severe. Friday, only days ago, brought reporting that American and Israeli forces were preparing to hit energy targets within Iran.
The asymmetry is the whole point. What Monday's commodity complex priced was a de-escalation the rhetoric refuses to confirm, leaving the bearish driver sitting on a fragile assumption. Escalate again and the haven bid returns instantly, into positioning only just unwound, and this metal gaps under that scenario instead of drifting.
There is a second underpriced catalyst in the same direction. The yen sits historically weak, two suspected intervention episodes have occurred inside the past week, and the Treasury reportedly warned banks that intervention was possible. Independent commentary reached the conclusion that intervening puts a ceiling on the pair without addressing what actually drives yen weakness. An intervention event itself weakens the currency sharply and mechanically, with this metal an immediate beneficiary.
Bearish structure, decaying conviction
The average stack is the cleanest bearish statement available. Every average sits above price and each longer one sits above each shorter, which is definitive alignment. Two qualifications matter, though, and both cut against pressing it.
The distance first. Sitting 528.9 points under the 200-day works out at 12.9 percent, and anything stretched that far beneath a long average is a reversion candidate rather than an acceleration one. Then the convergence. Only 11.2 points separate the 5-day from the 20-day, and both sit inside the magnet band. Convergence like that expands, and with dealer gamma negative the expansion should come sharper than these compressed sessions imply.
Direction confirms the bias without confirming the conviction. Negative exceeds positive across all five lookbacks, so the bearish read is established rather than inferred. Strength readings of 30.32 at twenty days and 27.73 at fourteen clear the level marking a genuine trend, though nine days has decayed under it to 18.39. Real over three or four weeks. Its grip loosening over ten days or so. Historic volatility agrees, compressing from 26.58 percent at a hundred days to 18.77 at fourteen.
Nothing in the set reveals more than the composite's own history. Today, 56 percent sell, strength average, direction weakening. A month back it read 88 percent sell. A week back, 24. Swing 64 points one way then 32 the other inside a month and what you are describing is chop rather than conviction.
Momentum sits neutral to mildly soft everywhere and nowhere near an extreme, between 43.89 and 47.32 across the windows. Getting the fourteen-day setting back to neutral would take something like 82 points of upside. Drop 286 points and the oversold trigger finally arrives, which measures how much space exists before momentum turns into a support argument on its own. Out at fifty and a hundred days the stochastics read 16.45 and 8.09 percent. Two weeks neutral, two to five months deeply oversold, and history says that pairing resolves across time instead of through another vertical drop.
Structurally, what you have is descending highs over a base defended twice. The highs step down from the July 6 peak to Monday's rejection. Underneath, two lows separated by 3.4 points, one set July 17 and one set June 30. Nothing coincidental about that proximity, and no fact on this chart matters more. Two separate tests of one area, better than two weeks apart, holding on both occasions.
Why the hedging book argues the other way
No directly observable dealer-positioning surface exists for gold futures, so what follows is derived from the gold-backed fund that acts as the liquid options proxy, translating near 11 to 1 against December futures. Positioning reflects an August 1 update.
On the call side gamma reads negative 151.32 million; on the put side, positive 90.84 million. Net, roughly 60.5 million short. Three implications follow and each changes how Tuesday should be handled.
Short net gamma means hedging amplifies moves instead of damping them, so no pinning mechanism holds this market inside a tight band. Expect any move to travel further and quicker than these compressed sessions would imply, which is an explicit argument against assuming Monday's 71.5 quiet points repeat.
Standing open interest that leans call-heavy, sitting against call-side gamma that deeply negative, leaves dealers structurally short the upside. Force hedging with a rally and it compounds itself. That mechanical asymmetry is exactly why the bearish setup gets moderate conviction instead of high.
And optionality is cheap on both an absolute and a relative measure. One-month implied at 21.24 percent sits marginally under one-month realised of 21.33, with the implied percentile at just 25.72, a variance-model percentile of 16.06 and skew at 22.92. Priced under their own delivered movement and down near the annual range's bottom quartile. That implied move converts to about 55 futures points, comfortably under an 81.6-point daily range and a 94.5-point true range. Less is being priced than this market has been doing.
One caution on the same dataset. Outer volatility reference points translate to roughly 4,433 above and 3,663 below, well outside anything expected near term, and those particular labels render inconsistently. Treat them as distribution boundaries and low-confidence context rather than tradeable magnets. The gamma, percentile and implied-move readings are the reliable inputs here.
Where Tuesday gets decided
Resistance starts immediately and it is dense, with price already inside it. Three references, Friday's settlement, the computed target and the pivot, occupy eleven points, backed by the 5-day average and the 18-day crossover. The evening print of 4,110.9 sits within that, which turns it into Tuesday's pass-or-fail test at the open. Accept above the 18-day crossover on a sustained basis and short-term structure is repaired. Get rejected there and it is confirmed supply.
A rally ought to die in the second band. It opens at the 9-day crossover, gathers a first deviation and a 9-day stall just above, then an 18-day stall and a second deviation, then the trio of convergence stall, Monday's high and four-week retracement that already rejected price once, and a third deviation caps it. Eight references, and the fade lives there.
A third band runs from first pivot resistance up through the momentum neutrality line to the 40-day crossover. Reach that crossover and the bearish intermediate structure is invalidated rather than merely stretched, and it sits a hundred points off. Beyond, second and third pivot resistance and the monthly high define an outer ceiling not in play across one session.
Below, the first zone is built around Monday's low and the statistics near it: a 30 percent stochastic level with first deviation support just under the settlement, then the session low, second deviation support and first pivot support, then a crossover stall, third deviation support and a 20 percent stochastic level closing it. Seven separate methods inside 21 points. Well-defined in a genuine sense, and the natural first objective on the downside.
The second zone is the one that matters. Second pivot support, the monthly low and the three-month low form a base that has been tested twice and held twice. Extend any bearish thesis beyond one session and it must contend with that base, since closing beneath turns sideways compression into a breakdown proper. Under it, third pivot support and a crossover mark the first air pocket, with the momentum oversold level far below that.
The trade
Short, at moderate conviction, fading strength into the band of supply. The reasoning is positional rather than emphatic. Price sits under every average with the 5-day and 20-day both acting as overhead supply. Direction runs negative on all five lookbacks. The composite reads 56 percent sell. Eight references sit in the supply band, Monday's rejection high among them, and the calendar is thin enough for structure to govern.
Note what the setup deliberately avoids: chasing weakness into a support zone with seven converging methods underneath it. Fading strength into confirmed supply is the better side of the same view.
Entry runs 4,124 up to 4,138, scaled, and requires a rejection candle inside the band first rather than a touch. Nothing before 09:45 whatever happens, and with the ten o'clock release sitting there, the window worth preferring comes after that print instead of in the quarter hour ahead of it.
Stop 4,153.0, which sits above the third deviation, above Monday's high and above the four-week retracement. It goes past the whole supply shelf instead of within it, since negative gamma means a break there extends rather than fails. Enter at the 4,131 midpoint and risk comes to 22.0 points.
Objectives step down to the settlement first as the natural magnet, then Monday's low at the upper edge of the support band, then to first pivot support, which is where seven converging methods start defending. Roughly 1.8, 2.6 and 3.0 to one.
Invalidation is structural rather than merely a stop. Close a sustained fifteen minutes over the third deviation and the whole supply shelf has been cleared while dealers sit short upside gamma. Standing aside beats re-entering lower. The macro override voids it immediately at any price on renewed escalation, or on a confirmed intervention event, because either one gaps this metal instead of letting it drift.
The conditional long takes the other side and it is mechanically the favoured direction if support holds. Trigger is a tested and rejected approach into the first support band during the morning, and it wants genuine rejection structure at fifteen minutes, not merely a touch. Enter between 4,068 and 4,078 once confirmed, stop 4,059.5, which sits under both the third deviation and that 20 percent stochastic reading, objectives at Friday's settlement then the 18-day crossover at the top of the magnet band. From 4,073 that is 13.5 points of risk paying roughly 2.5 and 3.5 to one. The supporting case is the washed-out intermediate stochastics, bottom-quartile implied volatility making upside optionality inexpensive, plus dealers holding structurally short call gamma underneath a call-heavy book.
Five conditions say stand aside. Opening inside the magnet band and staying there through 10:15 without rejection structure at either edge, which is simply the band exerting itself and offers nothing. A violent two-sided reaction to the release that leaves price back where it started within half an hour, because whipsaw under negative gamma is unusually punishing. Realised range under 35 points by noon, which is well beneath half the daily average and signals participation too thin to carry either setup. A Middle East headline arriving during the session, in which case leave the reaction alone and hold nothing through it. And a gap beyond either invalidation level at the open, since both setups rest on levels a gap has already voided.
One release, then a heavy back half
Tuesday is genuinely light for this metal and that shapes everything above. One first-order American release, everything else peripheral. Having no catalysts is what makes this review favour rotation inside a defined band over directional expansion, and it is equally why the real risk of the week arrives later.
Ten o'clock brings job openings, the one first-order event, forecast at 7.445 million where the prior read 7.594. No other release can move the currency meaningfully, and it arrives a quarter hour into the first tradeable window, so anything opened before then carries it as live risk. Miss materially beneath 7.3 million and the dollar softens, supporting gold and likely producing the squeeze through the crossover into the supply band. Beat above 7.6 million and Monday's manufacturing strength gets reinforced, the currency firms, and the retest lower opens. In line, which is the likeliest single outcome, leaves structure in control.
Factory orders arrive alongside and rank secondary. At 8:30 the trade balance is low impact for this metal, with the Canadian releases peripheral. Overnight, Japanese meeting minutes at 19:50 matter only through the currency channel, though given live intervention risk that carries more weight than usual, and the Japanese and Chinese services surveys are peripheral.
The week escalates sharply once Tuesday is out of the way. Wednesday brings private payrolls alongside the services survey, with a policy speaker in the afternoon. Claims, productivity and unit labour costs Thursday with a second speaker. Then the employment report on Friday: payrolls forecast 80,000 where 57,000 came prior, unemployment expected to stay 4.2 percent, earnings 3.5 percent annually, and a third speaker plus inflation expectations behind it. Treat Tuesday as positioning ahead of a back half that is heavy. Reduced size, tighter objectives, and no expectation that it settles the larger question here.
Base case at 55 percent is moderately bearish rotation: rejection in the supply band, decline through the settlement toward the low and then first pivot support, with settlement in the range's lower half while that twice-defended base goes untouched. Compression continues. Thirty percent goes to an upside squeeze, where a job-openings miss, a fresh Middle East headline or an intervention event softens the currency, price reclaims the crossover, negative gamma amplifies the hedging response, and the supply band comes into play; settling above the crossover would neutralise the bearish bias into midweek. Weight that probability above what the technical picture alone would give it, for two reasons: dealers hold a structurally short upside position, and the de-escalation assumption under Monday is fragile. The last fifteen percent is a break of the base, where a firm print plus continued dollar recovery drives through first pivot support without a bounce. With managed money still net long, a decisive break there would likely accelerate on liquidation rather than stall. Lowest probability, largest magnitude. The same de-escalation premise drove the equity advance that cleared every dealer boundary on its own map, which we set out in our August 4 ES review.
The complete data picture
Every number behind Friday’s plan, charted first; the full numeric reference follows underneath.
Full numeric reference , every remaining figure from the review
| December settlement | 4,090.5, down 16.5 points or 0.40 per cent |
| Session shape | opened 4,135.2, high 4,145.5, low 4,074.0, range 71.5 points |
| Range against average | 71.5 points, only 76 per cent of the 14-day average true range of 94.5 |
| Close position | lower quartile, roughly 23 per cent up from the low |
| Volume / open interest | 90,894 contracts / 280,612 |
| Friday's settlement | 4,107.0 |
| Post-settlement recovery | the electronic market has already recovered to roughly 4,110, which means the 4,074 low was rejected once the pit closed |
| Evening session | trading near 4,110.9, bid 4,110.6 against offer 4,114.0, roughly 20 points off the low |
| Hourly bar | open 4,108.3, high 4,115.0, low 4,106.2, close 4,110.9, a nine-point range |
| 15-minute bar | open 4,112.5, high 4,113.5, low 4,110.6, close 4,110.9 |
| Since July 2 | down 73.2 points, or 1.75 per cent |
| Since May 1 | down 634.4 points, or 13.36 per cent |
| Since August 1, 2025 | up 573.8 points, or 16.21 per cent |
| 52-week high | 5,781.8 on January 29, 2026, price 28.86 per cent below |
| 52-week low | 3,498.2 on August 19, 2025, price 17.59 per cent above |
| Three-month range | 4,015.6 on June 30 to 4,885.0 on May 12 |
| One-month range | 4,019.0 on July 17 to 4,276.2 on July 6 |
| Position in the monthly range | 71.5 points above the low, 185.7 points below the high |
| 5-day | 4,115.3, price 24.8 below; period change negative 23.0 or 0.56 per cent |
| 20-day | 4,126.5, price 36.0 below; period change negative 115.2 or 2.72 per cent |
| 50-day | 4,269.7, price 179.2 below; period change negative 521.0 or 11.24 per cent |
| 100-day | 4,545.8, price 455.3 below; period change negative 1,279.1 or 23.72 per cent |
| 200-day | 4,619.4, price 528.9 below, which is 12.9 per cent; period change negative 226.6 or 5.22 per cent |
| Year-to-date | 4,714.1, price 623.6 below; period change negative 384.0 or 8.54 per cent |
| Crossover levels | the 9-day triggers at 4,131.0, the 18-day at 4,120.9, the 40-day at 4,190.8 |
| Near convergence | the 5-day and 20-day sit 11.2 points apart, both inside the magnet band |
| Relative strength | 9-day 46.99, 14-day 45.29, 20-day 43.89, 50-day 44.19, 100-day 47.32 |
| Momentum thresholds | the 14-day 50 per cent line sits at 4,172.1, roughly 82 points above; the 30 per cent trigger at 3,804.4, some 286 points below |
| Raw stochastic | 9-day 33.79 per cent, 14-day 44.74, 20-day 40.36, 50-day 14.44, 100-day 7.17 |
| Stochastic fast line | 9-day 42.21, 14-day 51.18, 50-day 16.45, 100-day 8.09 |
| Stochastic slow line | 9-day 43.76, 14-day 49.02 |
| Direction, 9-day | strength 18.39, positive 14.51 against negative 17.00 |
| Direction, 14-day | strength 27.73, positive 14.57 against negative 20.14 |
| Direction, 20-day | strength 30.32, positive 14.42 against negative 22.32 |
| Direction, 50-day | strength 20.48, positive 16.05 against negative 25.28 |
| Direction, 100-day | strength 13.03, positive 19.09 against negative 25.47 |
| Historic volatility | 9-day 20.12 per cent, 14-day 18.77, 20-day 20.88, 50-day 24.32, 100-day 26.58 |
| Composite | 56 per cent sell, strength average, direction weakening; short term 60 per cent sell, medium term 25 per cent sell, long term 67 per cent sell |
| Composite history | 88 per cent sell one month ago, 24 per cent sell one week ago, 56 per cent sell today |
| Composite internals | trend signal, the 20, 50 and 100-day price comparisons and the 20-50, 20-100 and 50-100 crossovers all sell; the 50-day parabolic has flipped to buy; four components read hold |
| Average true range | 9-day 89.5 (2.20 per cent), 14-day 94.5 (2.30), 20-day 99.5 (2.40), 50-day 113.5 (2.80), 100-day 111.1 (2.70) |
| Average daily range | 9-day 85.1 (2.07 per cent), 14-day 81.6 (1.98), 20-day 86.4 (2.10), 50-day 102.5 (2.49), 100-day 115.8 (2.82) |
| Contraction | realised movement roughly 21 per cent beneath its 50-day baseline |
| One-range band on true range | 3,996.0 to 4,185.0 |
| Envelope on daily range | 4,049.7 to 4,172.1 |
| Planning band | 4,050 to 4,172, with a 4,065 to 4,150 core covering the majority of outcomes |
| Central expectation | a 4,065 to 4,145 session, an 80-point range; a realised range beyond 90 points would represent genuine expansion |
| 4,107.0 / 4,111.4 / 4,118.0 | Friday's settlement; the computed target price; the pivot, a three-point band inside eleven points |
| 4,115.3 / 4,120.9 | the 5-day average; the 18-day crossover, reinforcing the band |
| 4,131.0 to 4,152.3 | the eight-reference supply band: 9-day crossover 4,131.0, one deviation 4,133.2, 9-day stall 4,134.2, 18-day stall 4,142.1, two deviations 4,144.0, convergence stall 4,145.2, Monday's high 4,145.5, four-week 50 per cent 4,147.6, three deviations 4,152.3 |
| 4,159.7 / 4,166.7 / 4,172.1 | first pivot resistance; an upper reference; the momentum neutrality line |
| 4,177.9 / 4,187.8 / 4,190.8 | upper references; the 40-day crossover, which would invalidate the bearish intermediate structure |
| 4,212.3 / 4,254.0 / 4,276.2 | second pivot resistance; third pivot resistance; the one-month high |
| 4,082.3 / 4,080.8 | the 30 per cent stochastic level; one deviation support |
| 4,074.0 / 4,070.0 / 4,065.4 | Monday's low; two deviation support; first pivot support |
| 4,062.7 / 4,061.7 / 4,061.2 | the 3-10 day crossover stall; three deviation support; the 20 per cent stochastic level |
| The first zone | 4,061 to 4,082, seven separate methods converging inside 21 points |
| 4,015.6 to 4,023.7 | the support base: second pivot support 4,023.7, the one-month low 4,019.0, the three-month low 4,015.6, held on June 30 and July 17 |
| 3,959.1 / 3,971.1 | the 9-to-18 day crossover; third pivot support, the first air pocket |
| 3,804.4 / 3,498.2 | the 30 per cent momentum level; the 52-week low, not a near-term consideration |
| Model note | derived from the primary gold-backed fund serving as the liquid options proxy, translating at roughly 11.0 to 1 against December futures; positioning reflects the August 1 update |
| Proxy price | 372.01 against a prior close of 371.54, up 0.13 per cent, on 6.59 million shares |
| Call-side gamma | negative 151.32 million |
| Put-side gamma | positive 90.84 million |
| Net | roughly 60.5 million short |
| Concentration | both gamma and delta exposure sit at the September 17 expiry |
| Open interest / volume | put to call 0.51, a call-heavy standing book; Monday's volume mildly put-heavy at 89,580 puts against 85,010 calls |
| One-month implied against realised | 21.24 per cent against 21.33 |
| Percentiles | implied volatility 25.72 per cent, variance-model 16.06, skew 22.92 |
| Implied move | 4.98 dollars on 372.01, or 1.34 per cent, roughly 55 December points |
| Outer volatility references | 403 upside and 333 downside, roughly 4,433 and 3,663 in futures terms; low confidence, treated as distribution boundaries only |
| Commercials | 75,460 long (down 4,997) against 287,769 short (down 5,887), net negative 212,309 |
| Non-commercials | 219,622 long (down 5,163) against 37,552 short (down 3,323), net positive 182,070 |
| Managed money | 135,093 long (down 6,394) against 15,298 short (down 1,358), net positive 119,795 |
| Swap dealers | 23,661 long (down 1,298) against 215,421 short (down 3,416), net negative 191,760 |
| Producers | 15,367 long (down 194) against 35,916 short (up 1,034), net negative 20,549 |
| Other reportables | 84,529 long (up 1,231) against 22,254 short (down 1,965), net positive 62,275 |
| Dollar index | 99.958, up 0.04 per cent, after trading to a seven-week low intraday |
| July manufacturing survey | 55.6, up 2.3 points, against a 53.9 consensus, the strongest expansion in four years; employment 52.8 from 49.7; prices paid 71.1 from 73.0 |
| July policy vote | 9 to 3, all three dissents favouring a 25 basis point increase |
| Silver, September | 57.856, up 0.12 per cent |
| Platinum / palladium | 1,626.3 down 1.95 per cent / 1,256.60 down 1.94 per cent |
| WTI crude, September | 80.34, down 5.11 per cent |
| Brent | 83.77, down 4.73 per cent |
| Dollar-yen / euro-dollar | 157.187 up 0.01 per cent / 1.15114 up 0.03 per cent |
| Other central banks | the Swiss guiding to a zero policy rate through the end of 2027; the Bank of Japan reported open to raising at a faster cadence than its historical six-month interval |
| Gold within its complex | platinum and palladium both fell close to 1.95 per cent, considerably worse than gold, which places gold mid-complex rather than at the weak end |
| 08:30 ET | United States trade balance, forecast negative 73 billion against negative 77.6 billion |
| 08:30 ET | Canadian trade balance, forecast 3 billion against 4.24 billion |
| 09:30 ET | Canadian manufacturing survey, prior 53.0 |
| 10:00 ET | factory orders, forecast positive 0.2 per cent against negative 1.3 per cent |
| 10:00 ET | job openings, forecast 7.445 million against 7.594 million, the single first-order event |
| 16:00 ET | corporate earnings, no relevance here |
| 18:45 ET | New Zealand employment, forecast 5.4 per cent unemployment |
| 19:50 / 20:30 / 21:45 ET | Bank of Japan meeting minutes; Japanese services survey; Chinese services, forecast 53.7 against 54.1 |
| Wednesday | private payrolls forecast 65,000, the services survey, a policy speaker at 16:05 ET |
| Thursday | jobless claims forecast 205,000, productivity and unit labour costs, a second speaker |
| Friday | payrolls forecast 80,000 against a prior 57,000, unemployment expected to hold at 4.2 per cent, average hourly earnings forecast 3.5 per cent year over year, a third speaker and one-year inflation expectations |
| Next policy decision | September 16 |
| Entry | 4,124 to 4,138, scaling in, only after a rejection candle forms in the band; not before 09:45 ET, preferably after the 10:00 release |
| Stop | 4,153.0, above three deviation resistance at 4,152.3, Monday's high and the 4,147.6 retracement |
| Target 1 | 4,092.0, 39.0 points, roughly 1 to 1.8 |
| Target 2 | 4,074.5, 56.5 points, roughly 1 to 2.6 |
| Target 3 | 4,065.5, 65.5 points, roughly 1 to 3.0 |
| Risk | 22.0 points from the 4,131 midpoint |
| Invalidation | a sustained fifteen-minute close above 4,152.3, which is structural rather than a stop |
| Macro override | any renewed escalation headline or a confirmed intervention event voids it immediately, regardless of price |
| Trigger | a tested and rejected approach to 4,065 to 4,074 during the morning, requiring clear rejection structure on the fifteen-minute chart |
| Entry | 4,068 to 4,078 on confirmed rejection |
| Stop | 4,059.5, beneath three deviation support at 4,061.7 and the 4,061.2 stochastic level |
| Target 1 | 4,107.0, 34.0 points, roughly 1 to 2.5 |
| Target 2 | 4,120.9, 47.9 points, roughly 1 to 3.5 |
| Risk | 13.5 points from a 4,073 entry |
| Path A, 55 per cent | rejection at 4,118 to 4,131, decline to 4,074 then 4,065, settlement between 4,065 and 4,090 |
| Path B, 30 per cent | a job-openings miss, a Middle East headline or an intervention event; reclaims 4,120.9, negative gamma amplifies, extends into 4,131 to 4,148 |
| Path C, 15 per cent | a firm print with continued dollar recovery drives through 4,065.4 without a bounce, opening 4,023.7 and the 4,015 to 4,019 area |
| Expected range, high extension | 4,148 to 4,160 |
| Upper | 4,131 to 4,145 |
| Mid, most likely | 4,074 to 4,120 |
| Lower | 4,061 to 4,074 |
| Low extension | 4,024 to 4,050 |
| Most-likely path | open near 4,105 to 4,115, attempt the 4,118 to 4,131 supply band in the first hour, fail on an in-line or firm print, rotate lower through the settlement toward 4,074 then 4,065 by early afternoon |
| Afternoon decision | if the morning resolves higher, the objective is 4,145.5, and a close above 4,120.9 repairs the short-term structure; if lower, 4,065.4 decides whether the move stops or extends toward 4,023.7 |
| Monday's handoff | gold carried into the open near 4,135, having held Friday's settlement comfortably |
| Magnet band | 4,107 to 4,120, with the compressed post-settlement bars placing price directly inside it; a settle above 4,120 would neutralise the bearish bias into midweek |
| Overnight expectation | a 4,085 to 4,125 drift with resolution deferred to the cash session |
| Opening range test | acceptance means holding above 4,111.4 with the range low above 4,107.0; rejection means failure back beneath 4,107.0 with the range high capped below 4,118.0 |
| Skip | an open inside 4,100 to 4,120 that persists through 10:15 ET with no rejection structure; a violent two-sided reaction to the release; realised range under 35 points by 12:00 ET; a Middle East headline arriving during the session; a gap beyond 4,152.3 or 4,059.5 at the open |



