
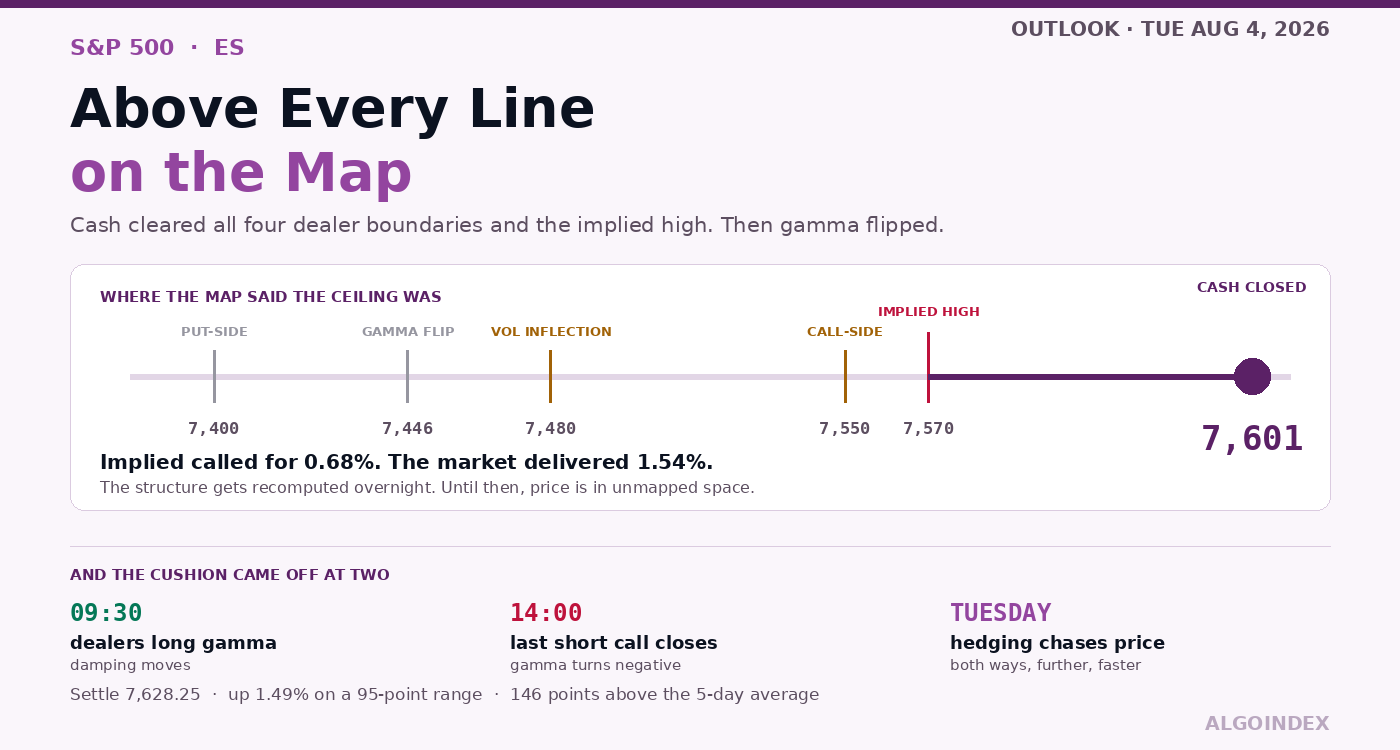
Every upper boundary on the dealer map got cleared Monday, and the options-implied high went by more than thirty points. Then around two o'clock the last sizeable same-day call position closed and gamma turned negative. Whatever had been leaning against price all morning stopped. Tuesday opens without it.
Ninety-five points, closing in the top tenth
September added roughly 112 points to finish 7,628.25, a 1.49 percent session covering 95 points. Cash ended near 7,601 from a 7,489.72 prior, its intraday high around 7,620.90 putting the index a short reach from its record. Nasdaq took 1.78 percent, the Dow 1.32. Technology led and everything else came along.
Shape matters here more than size. Globex opened at 7,550.00 on Sunday evening, marked its low within a few hours at 7,542.75, and then went one direction for essentially the next twenty-two. Pre-market was firm before the bell on reports of crude sinking. Cash extended rather than faded it, and by 10:20 the index had 1.18 percent with a manufacturing beat layered on the geopolitical relief.
Participation widened as the afternoon went on rather than thinning, and settlement landed 9.50 points shy of the high.
Finish in the top tenth of your daily range after taking ninety-five points and that is strength, not exhaustion. Nothing else about Monday reads as constructively.
Evening trade has behaved. Six points of follow-through across a six-point band tells you nobody wants the advance back, and equally that no continuation impulse exists overnight. This contract has held onto what it took and no more.
What drove it, and what it rests on
A single driver, and not a domestic one. Tension eased around the Strait of Hormuz, crude dropped hard, and out went the most direct route from energy into headline inflation, which had dominated worry for a fortnight. Afternoon comments outlined two phases, waterway first and denuclearisation after, with a suggestion the reopening might come as early as the next day.
Five basis points came off the ten-year, down to 4.68 percent. Cheaper money next to cheaper oil is what equity risk premia react to quickest.
Ten o'clock brought a domestic leg. July manufacturing came in at 55.6 where 53.9 was forecast and 53.3 was prior, the quickest expansion in four years. Employment came back up, 49.7 becoming 52.8. Prices paid cooled, 73.0 becoming 71.1. Nothing in the macro set treats equities better than growth speeding up while input costs slow down, and the market paid up accordingly.
Now for the part that should trouble anyone leaning on this. Late in the afternoon, senior Iranian military commentary said the only route permitted through the Strait would be the Iranian one, that opening any second corridor was flatly out of the question, and that any warship brought there to that end would become a target. A public refusal of the reopening premise, delivered on the same afternoon equities rallied on it. Either the market missed it or it decided to discount it.
Some context helps. Reporting on the last day of July had American and Israeli forces preparing to hit energy targets inside Iran, possibly over the weekend. Nothing happened, and that absence explains a good deal of why Monday opened bid. An absent strike is not an agreement, though, and the July 22 policy statement committed to bombing infrastructure should Strait shipping be attacked.
Put accurately: equities have priced a favourable outcome to a negotiation whose counterparty is publicly refusing its central term. Nothing else threatens the long side as much, it appears on no calendar, and a price stop does not manage it.
Trading in space nobody mapped
The levels in circulation were built off the August 1 close, referenced to cash at 7,489. Monday finished over every upper boundary on that structure. Over the call-side dealer level. Over the volatility inflection level that the desk uses to divide constructive posture from defensive. And better than thirty points past where options had put the one-day high, at 7,569.78.
Set the two against each other. Options priced 0.68 percent. The market delivered 1.54. More than twice.
Overnight that map gets rebuilt and its boundaries move up. Until they do, price is working through territory the standing positioning never accounted for, which explains precisely why gamma turned when it did.
Follow the sequence. Morning gamma came in positive off 15,000 lots of a customer short same-day call struck at 7,590. At noon that closed out, replaced by roughly 8,000 lots of the same structure struck 7,610. Two o'clock, the 7,610 position closed as well, the heatmap moved from damping to amplifying, and dealer gamma went negative. That is how the session settled.
Long gamma leans against price. Short gamma chases it. Whatever direction Tuesday moves, it should cover more ground faster than the identical move would have covered on Monday morning.
One qualifier about scale. Aggregate exposure on the cash index still nets positive, 7.29 billion of call gamma against negative 4.52 billion in puts. What turned was the marginal condition governing intraday behaviour, not the whole book.
Where the fragility actually lives
Tilt readings answer the question of which index breaks first. Cash reads 1.19 and the Nasdaq 100 reads 1.097, both comfortably positive. The Nasdaq tracking fund reads 0.843. Small caps read 0.516 on the index, 0.451 on the fund.
Notional says it in dollars. Cash carries positive 405 million. The Nasdaq fund carries negative 244 million. Small caps show negative 71.7 million at the index level, and at the fund level negative 1.079 billion. Large caps stable and tilted positive, sitting on small caps fragile and tilted negative.
Shock this market Tuesday and small caps take it first and take it hardest.
Monday's aggregate hedging flow printed positive 14 billion dollars, biggest in thirty days, and the composition beats the headline. Around ten billion came from selling longer-dated puts, four billion from buying longer-dated calls. Selling puts is slower and more deliberate than buying calls. Institutions were putting away downside protection instead of reaching for upside, which is a durable sort of bullishness and also one that takes away a cushion. Single-stock flow inside the index contributed another 5.3 billion, mostly longer-dated calls, roughly half concentrated in the biggest technology names.
Positioning through July 28 completes it. Asset managers sit net long and grew that by 15,518 contracts. Fast-money funds sit net short and trimmed theirs by 16,259. Real money adding underneath while fast money covers into it. Short covering under a rising market is fuel, some of Monday's range was precisely that, and it means part of the buying power behind the move has now been used.
Stretched fast, capacity slow
Price sits over the whole moving-average stack, which is unambiguously good for trend followers, and the worry is distance rather than direction. A hundred and forty-six points over the five-day after one session leaves things stretched, and drifting back toward it is how these things usually resolve inside two or three days.
Something else in the stack matters. Both intermediate averages now sit within 8.5 points of each other, which turns that zone into a remarkably clean line for the medium term. Hold over roughly 7,530 and the intermediate uptrend claim outlives even a real pullback.
Character changed outright on the four-hour frame. Late July had been descending highs from around 7,640 down into the monthly low, and Monday removed that whole structure in one impulse instead of the stepwise progression healthy trends normally produce. What that leaves is a higher high without any higher low beneath it at that degree, which reads as relief rather than accumulation.
It also leaves thin ground running roughly 7,560 up to 7,620, price having crossed it in one straight line during cash hours. Thin cuts both ways: not much resistance on the way up, not much support on the way back. So a pullback toward the pivot shelf ought to be quick, and it will either hold immediately or run straight on toward first pivot support.
Only the fast direction window has turned. Nine-day positive has crossed above negative on a 31.37 strength reading, which qualifies as trending. Fourteen, twenty and fifty days still show negative over positive. From the inside, that is what an early reversal looks like, and it is one day old.
Momentum splits along the same seam. Daily relative strength sits mid-to-high fifties while stochastics are pinned near 97 percent, which describes something at the top of its range that is not overbought. Intraday disagrees, reading near 98 hourly, 91 across four hours. Fast frames stretched, slow frames with room. Buy weakness, not strength.
Where Tuesday gets decided
Two to four points overhead sit the evening high and Monday's high, so the opening minutes run straight into them. Accepting above is what divides continuation from digestion.
Beyond, the map thins badly. Between Monday's high and the annual high there is one structural reference, first pivot resistance, and that scarcity is why it ought to behave as a waypoint instead of a wall, and it should get a clean test if the high goes.
Then the heavyweight zone, the strongest confluence on this chart. Annual high and 13-week high on the same number, second pivot resistance and the computed target alongside, four independent references packed into six points, and a fresh record on cash if it trades. A first approach there is somewhere to take profit rather than somewhere to add. Higher up, a deviation level, third pivot resistance and a second deviation mark the outer edge of a plausible week rather than Tuesday's business.
Downward, the overlay shelf immediately beneath spot is minor and it exists only to say whether the evening bid means anything. Consequence starts at the computed daily pivot, which happens to sit on the densest options concentration in the cash map. Tuesday should organise around it.
Under that comes the 18-day stall with a second heavy concentration beside it, then a stochastic reference and first pivot support. Sustained trade below first pivot support would say the relief advance kept none of its intraday gains.
Beneath, a band collects the nine-day stall, a 70 percent stochastic reference and Monday's actual low, which is the day's last defence. Then the intermediate zone holding both converged averages with a deviation support between them, and closing under there negates the medium-term claim.
The best-defined confluence sits lower again, packing second pivot support, the momentum midpoint, the 40-day average and the volatility inflection level into three points. Cross that and a healthy correction becomes a change of character. Below it, third pivot support pairs with the gamma flip level, and under the flip, hedging stops stabilising and starts amplifying downward.
The trade
Long, but not by chasing. Trend, breadth and macro impulse all point up, medium-term indicators read uniformly constructive, and the fast direction window has genuinely crossed. Set against that: 146 points over the five-day average, intraday oscillators extended, and a cash close above every mapped resistance and above its own implied high. Chasing that is bad risk.
Taking the first controlled retracement gets the same view at a much better price. That shelf is unusually well defended, holding the computed pivot and sitting right on the map's densest options concentration. Short gamma means the retracement, whenever it comes, should arrive quickly and cleanly instead of grinding.
Enter there, preferring the lower half. Nothing before 09:45. Nothing in the seven minutes around the ten o'clock release either, so let the number land and give the first reaction time to sort itself out. Stop 7,586, under the 18-day stall reference and under that secondary concentration, since trading there for any length of time says the shelf is gone.
Objectives run through Monday's high, first pivot resistance, then the annual-high confluence. Risk from 7,607.50 is 21.50 points, paying near enough 1.4, 2.6 and 4.0 to one. A third at the first with the stop to entry, a third at the second, trail the rest beneath whatever fifteen-minute swing low is most recent.
One management rule counts double here. Do not carry the full size into 15:15 with after-hours technology results waiting. Before 15:45 the last third gets closed or cut to a token, whatever price happens to be doing.
Invalidation is acceptance under the stop on a fifteen-minute close. A single wick through does not count. Two closes in a row do. And the macro override sits above all of it. Any headline repudiating the reopening premise, an explicit rejection, a fresh shipping incident, confirmation of strikes on energy targets, kills the setup on the spot regardless of price. Leave at market instead of waiting for a stop, because Monday's entire advance stands on that one premise and the counterparty contradicted it publicly that same afternoon.
The conditional short takes the other branch, secondary. Two failed runs at Monday's high, then a sustained pivot break, confirmed on a fifteen-minute close under 7,598. Enter on the retest of that broken pivot from underneath, stop 7,622 over the overlay shelf, objectives at first pivot support then the confluence holding Monday's low. Twenty-two points of risk from 7,600, paying roughly 1.5 and 2.6 to one. Its edge is the same short-gamma condition, which says breaking the day's organising pivot extends rather than reverses. It ranks second because it fights both trend and macro, and it wants reduced size.
Six reasons to stand aside. An open above 7,660, since the retracement entry will not exist and chasing into the annual-high confluence is poor. Overnight running above 7,690 before cash, because the upside objective arrives without us and risk turns downward. A geopolitical headline before the open either way, because confirmation and repudiation both produce gaps where mapped levels lose meaning, so wait out a full opening range and then an hour more. Job openings landing more than 300,000 from consensus either way, which repositions the rate path and demands a re-derived map. An inside range under 30 points by 11:30, the compression case where neither setup has room. And anything before 09:45 or after 16:00.
One number, then the results
Tuesday sits between Monday's manufacturing print and Wednesday's services survey, with payrolls waiting on Friday, so it is comparatively light on American macro. Treat that as a finding rather than an absence: positioning, earnings and headlines will govern this session more than data will.
Job openings at ten is the first-order item, forecast 7.445 million against a prior 7.594. First labour datapoint of the week, and it gets read as a leading indicator into Friday. Factory orders arrive at the same moment and rank second-order. Trade balance at 8:30 alongside the Canadian equivalent, and a Canadian manufacturing survey at 9:30.
Be precise about the mechanism. Monday rested on strong growth plus softening inflation. A big beat reinforces the growth side and feeds the hawkish committee minority at the same time, which leaves equities ambiguous. A big miss softens labour ahead of payrolls, unambiguously good for rates, and through them for the multiple. Asymmetry tilts slightly toward wanting a soft number.
Earnings arrive on both sides Tuesday. Pharmaceutical, industrial and consumer results before the open give a broad read, and the industrial one usefully checks the cycle that Monday's survey flattered. Launch-sector and chip results follow the close, the chip release carrying a consensus near 1.62 dollars against revenue of 11.31 billion, and it sets Wednesday's technology tone.
Which shapes the afternoon predictably. Fixed-strike volatility rising Monday says participants are buying optionality into those releases, and the consequence is directional risk coming off late. Expect a choppier, less directional final ninety minutes as accounts flatten, and any strong afternoon trend should start losing conviction past roughly 15:15.
Overnight holds two scheduled items and neither is disruptive alone. New Zealand employment at 18:45, Japanese meeting minutes at 19:50. The minutes deserve a little more attention than usual, with yen intervention fresh and reporting that the bank may move faster than its recent cadence. Read hawkish, the carry complex feels it, and that can reach American futures during Asian hours, though usually modestly. The real overnight risk is unscheduled: one headline confirming or repudiating the reopening outweighs the whole calendar.
Base case at 45 percent is digest then extend. Overnight keeps to a band of 7,610 up to 7,650. The open probes Monday's high and fails it first time. Job openings lands in line, or soft. Price rotates into the shelf, finds buyers, and turns back through the high by late morning toward first pivot resistance, with a stretch at the annual-high confluence if technology carries it. Thirty-five percent goes to failure and fade, where the high rejects twice, the pivot gives way on a second approach, and short gamma amplifies a break toward first pivot support and Monday's low, most likely triggered by a headline rather than by data. The last twenty percent is compression, a narrow band all session and an inside day, where cutting size beats forcing the trade.
The rest of the week builds behind it. Private employment, the services survey, crude inventories and a refunding announcement Wednesday, plus a policy speaker and storage and ride-hailing results. Claims Thursday. Payrolls Friday. Directionally, this market has earned some benefit of the doubt. Extending without first digesting ninety-five points has not. Friday had left this contract with the year’s cheapest volatility sitting in front of an unpriced weekend, which we mapped in our August 3 ES review. The weekend passed without a strike, and Monday is what that relief looked like.
The complete data picture
Every number behind Friday’s plan, charted first; the full numeric reference follows underneath.
Full numeric reference , every remaining figure from the review
| September settlement | 7,628.25, up roughly 112 points or 1.49 per cent |
| Session shape | opened 7,550.00 Sunday evening, low 7,542.75, high 7,637.75, a 95-point range |
| Settled off the high | 9.50 points |
| Cash index | closed near 7,601 against a prior 7,489.72, up about 1.5 per cent, intraday high near 7,620.90 |
| Other indices | Nasdaq 100 up 1.78 per cent, the Dow up 1.32 per cent |
| Pre-market | up 0.57 per cent before the cash open; up 1.18 per cent by 10:20 ET |
| Evening reopen | near 7,634.25, up 6.00 points, holding a 7,629.00 to 7,635.50 band |
| Futures basis | approximately 27 points observed against a model basis near 29.5 |
| Open interest | 2,020,830, with 46 days to the September expiry |
| One month, since July 2 | up 100.00 points, or 1.33 per cent |
| Three months | up 314.25 points, or 4.30 per cent |
| Twelve months | up 1,165.25 points, or 18.03 per cent |
| One-month window | opened 7,528.25, bottomed 7,324.00 on July 29, topped 7,637.75 |
| 52-week high | 7,693.75, set June 2, now 0.85 per cent overhead |
| 52-week low | 6,401.75, set March 31, now 19.16 per cent below |
| Distance from averages | 110 points above the 20-day and 96 above the 50-day |
| 5-day | 7,487.30, price 146.7 above |
| 20-day | 7,524.05, price 109.9 above |
| 50-day | 7,532.53, price 101.5 above |
| 40-day | 7,510.99 |
| 100-day | 7,289.06, price 344.9 above |
| 200-day | 7,142.09, price 491.9 above |
| Year-to-date | 7,203.39, price 430.6 above |
| Intermediate convergence | the 20-day and 50-day sit 8.5 points apart, at 7,524 and 7,532 |
| Relative strength | 9-day 63.05, 14-day 58.59, 20-day 56.72, 50-day 55.61 |
| Raw stochastic | 96.97 per cent on the 9, 14 and 20-day settings; 83.69 per cent on the 50-day |
| Stochastic fast line | 9-day 80.17, 14-day and 20-day 69.53, 50-day 61.71 |
| Stochastic slow line | 9-day 54.67, 14-day and 20-day 45.60, 50-day 44.88 |
| Direction, 9-day | strength 31.37, positive 18.71 against negative 16.65 |
| Direction, 14-day | strength 23.68, positive 16.55 against negative 18.11 |
| Direction, 20-day | strength 17.85, positive 16.11 against negative 18.84 |
| Direction, 50-day | strength 9.72, positive 17.60 against negative 20.53 |
| Momentum band | daily relative strength readings run in the 55 to 63 band while raw stochastics sit pinned near 97 per cent |
| Intraday oscillators | roughly 98 on the hourly frame, 91 on the four-hour, against 63 daily and 61 weekly |
| Historic volatility | 15.89 per cent on 9 days, 14.28 on 14, 12.90 on 20 |
| Average true range | 9-day 107.03 (1.40 per cent), 14-day 102.92 (1.35), 20-day 101.08 (1.33), 50-day 96.65 (1.27) |
| Average daily range | 9-day 110.22 (1.44 per cent), 14-day 99.18 (1.30), 20-day 92.99 (1.22), 50-day 98.19 (1.29) |
| Monday's range | 95.00 points, landing almost exactly on the 20-day average daily range |
| One-range band around the settle | roughly 7,525 to 7,731 |
| September futures implied | 13.55 per cent |
| Cash one-month implied against realised | 12.58 per cent against 12.45 |
| Implied volatility rank | 14.41 per cent |
| Implied one-day move | 0.68 per cent on cash, roughly 52 futures points |
| Fixed-strike volatility | rose one to seven points across the curve on a 1.5 per cent up session |
| Volatility measure | closed 15.87 with volatility-of-volatility at 90.81 |
| Risk reversal | negative 0.047 on the cash index, negative 0.061 on the Nasdaq 100; skew rank 51.38 per cent |
| 7,635.50 / 7,637.75 | the evening high; Monday's high and the one-month high |
| 7,663.08 | first pivot resistance, the only structural reference before the annual high |
| 7,693.75 to 7,698.53 | the 52-week and 13-week high at 7,693.75, second pivot resistance 7,697.92, computed target 7,698.53 |
| 7,728.38 / 7,758.08 / 7,769.85 | one deviation resistance; third pivot resistance; two deviations |
| Options-implied one-day high | roughly 7,570 on the cash index, precisely 7,569.78 |
| Cash options references above | 7,617, 7,625, 7,632, 7,647, 7,677 and 7,699, with 7,647 and 7,699 carrying the heaviest concentrations |
| 7,622.06 | the chart's overlay shelf, minor |
| 7,602.92 | the computed daily pivot, reinforced by the cash index's densest concentration at 7,602 |
| 7,588.75 / 7,587 | the 18-day average stall; a second heavy cash concentration |
| 7,575.00 / 7,568.08 | where the raw stochastic returns to 80 per cent; first pivot support |
| 7,540.25 to 7,543.63 | the 9-day average stall, the 70 per cent stochastic reference and Monday's low at 7,542.75 |
| 7,524.05 to 7,532.53 | the converged 20-day and 50-day averages with one deviation support at 7,528.12 between them |
| 7,507.92 to 7,510.99 | second pivot support, the 50 per cent relative-strength reference at 7,508.62, the 40-day average, the volatility inflection level at 7,509.5 |
| 7,473.03 to 7,475.50 | third pivot support; the dealer gamma flip level |
| 7,429.50 / 7,029.50 | the put-side dealer boundary (cash 7,400); primary gamma concentration (cash 7,000) |
| Cash options references below | 7,602, 7,587, 7,572, 7,550 and 7,527 |
| Key cash strikes | 7,000, 7,500, 7,600 and 8,000 |
| Chart overlay levels | 7,622.06 immediately beneath spot, then 7,488.72 and 7,473.03, with a longer-term reference at 7,339.69 |
| Futures equivalent of the 7,602 concentration | near 7,630, which explains the six-point evening band |
| Intermediate-trend line | holding above roughly 7,530 preserves the intermediate uptrend claim even after a meaningful pullback |
| Thin space | between roughly 7,560 and 7,620, traversed in a straight line during the cash session; a pullback should either hold quickly or continue toward 7,568 |
| Map computation | August 1 close, cash reference 7,489, futures reference 7,518.5 |
| Call-side dealer boundary | cash 7,550, futures 7,579.5 |
| Volatility inflection level | cash 7,480, futures 7,509.5 |
| Gamma flip level | cash 7,446, futures 7,475.5 |
| Put-side boundary | cash 7,400, futures 7,429.5 |
| The overshoot | cash closed near 7,601, above every upper reference and above the implied one-day high of 7,569.78 |
| Morning gamma | positive, supplied by a 15,000-lot customer short same-day call at 7,590 |
| Midday | that position closed around 12:00 ET, replaced by roughly 8,000 lots at 7,610 |
| The flip | the 7,610 position closed around 14:00 ET and dealer gamma turned negative into the close |
| Aggregate gamma | call 7.29 billion against put negative 4.52 billion, net positive |
| Gamma index | 2.099 on the cash index, negative 0.093 on the tracking fund |
| Gamma tilt | 1.19 cash index, 1.097 Nasdaq 100, 0.843 Nasdaq fund, 0.516 small-cap index, 0.451 small-cap fund |
| Gamma notional | positive 405 million dollars cash index, negative 244 million Nasdaq fund, negative 71.7 million small-cap index, negative 1.079 billion small-cap fund |
| Expiry concentration | heaviest gamma August 20, heaviest delta February 2027 |
| Hedging flow | positive 14 billion dollars, the largest reading in thirty days |
| Composition | roughly 10 billion from longer-dated put selling, 4 billion from longer-dated call buying |
| Single-stock flow | a further positive 5.3 billion, led by longer-dated calls, about half in the largest technology names |
| Options open interest | 9.444 million calls against 12.82 million puts, a ratio of 1.28; Monday's volume 738,921 calls against 1,057,000 puts |
| Asset managers | 1,159,241 long against 214,471 short; net long grew 15,518 |
| Fast-money funds | 155,964 long against 453,440 short; net short reduced by 16,259 |
| Dealers and intermediaries | 166,101 long against 923,295 short; added 41,446 to the short side |
| Commercial participants | 1,429,304 long against 1,525,233 short |
| July manufacturing survey | 55.6 against a 53.9 forecast and 53.3 prior, the fastest expansion in four years |
| Employment component | 52.8 from a prior 49.7 |
| Prices paid | 71.1 from a prior 73.0 |
| Ten-year yield | down 5 basis points to 4.68 per cent |
| July policy meeting | 9-3 vote, all three dissents favouring a 25 basis point increase |
| Leadership | Alphabet up 4.88 per cent, Microsoft 4.93, Tesla 3.49; Amazon crossed three trillion dollars in market value; Apple down 1.78 per cent |
| Software complex | the sector fund added 3 per cent to close at 97, with negative dealer gamma across much of its strike distribution |
| After the close Monday | an analytics name beat on revenue and earnings with United States commercial revenue up 150 per cent year over year, trading around 142, up roughly 13 per cent against a 10 per cent priced move |
| Cost-relief beneficiaries | two airlines up 5.82 per cent each, Ferguson 6.72, Corning 6.07, Atkore 28.22 on its own results |
| Energy funding the move | Marathon Petroleum down 2.98 per cent, Occidental 2.80, Diamondback 2.07 |
| Storage and memory | SanDisk up 6.03 per cent while Seagate lost 2.93 and Western Digital 3.23 |
| Other movers | GameStop down 12.25 per cent, Fair Isaac down 6.90 |
| Data caption | gold holding its level says the market has not fully retired the geopolitical premium; cross-asset correlation has compressed back to levels that make index-level hedging attractive against single-name hedging |
| Cross-asset | crude quoted near 80.17 in the evening; gold effectively unchanged near 4,052.91 |
| 06:30 ET | Merck, consensus negative 0.23 on 16.35 billion; Caterpillar, consensus 6.17 on 18.13 billion |
| 06:45 / 07:00 ET | Pfizer, consensus 0.68 on 14.41 billion; McDonald's, consensus 3.33 on 7.12 billion |
| 08:30 ET | United States trade balance, forecast negative 73 billion against negative 77.6 billion |
| 08:30 ET | Canadian trade balance, forecast 3 billion against 4.24 billion |
| 09:30 ET | Canadian manufacturing survey, prior 53.0 |
| 10:00 ET | job openings, forecast 7.445 million against a prior 7.594 million, first-order |
| 10:00 ET | factory orders, forecast positive 0.2 per cent against negative 1.3 per cent |
| 16:00 / 16:15 ET | SpaceX results; Advanced Micro Devices, consensus 1.62 on 11.31 billion |
| 18:45 / 19:50 ET | New Zealand employment data; Bank of Japan meeting minutes |
| Balance of week | private employment change 08:15 Wednesday, forecast 65,000 against 98,000 prior; services survey 10:00, forecast 54.5; crude inventories 10:30 against a prior draw of 7.167 million barrels; a refunding announcement 08:30 and a policy speaker 16:05, plus SanDisk, Western Digital and Uber; jobless claims Thursday 08:30, forecast 205,000 against 197,000 prior; payrolls Friday |
| Entry | 7,600 to 7,615, preferring the lower half; nothing before 09:45 ET or in the seven minutes around the 10:00 release |
| Stop | 7,586.00, beneath the 18-day stall at 7,588.75 and the cash concentration at 7,587 |
| Target 1 | 7,637.75, roughly 1 to 1.4 |
| Target 2 | 7,663.08, roughly 1 to 2.6 |
| Target 3 | 7,694.00, roughly 1 to 4.0 |
| Risk | 21.50 points from a 7,607.50 entry |
| Management | one third at Target 1 with the stop to entry, a second third at Target 2, trail the balance beneath the most recent fifteen-minute swing low; reduce to a token before 15:45 ET |
| Invalidation | two consecutive fifteen-minute closes beneath 7,586.00 |
| Macro override | exit at market on any headline repudiating the Strait reopening premise, regardless of price |
| Trigger | two failed attempts at 7,637.75, then a sustained break of 7,602.92 confirmed by a fifteen-minute close below 7,598 |
| Entry | 7,596 to 7,604 on the retest of the broken pivot from beneath |
| Stop | 7,622.00 |
| Target 1 | 7,568.08, roughly 1 to 1.5 |
| Target 2 | 7,543.00, roughly 1 to 2.6 |
| Risk | 22 points from a 7,600 entry; take at reduced size |
| Path A, 45 per cent | overnight holds 7,610 to 7,650, the open fails 7,637.75 first time, job openings in line or soft, rotation into 7,600 to 7,615 finds buyers and reverses higher through the high toward 7,663.08 |
| Path B, 35 per cent | the high rejects twice, 7,602.92 fails on the second approach, negative gamma amplifies toward 7,568.08 then the 7,540 to 7,543 confluence |
| Path C, 20 per cent | a narrow 7,610 to 7,650 band held all session, closing near the open as an inside day |
| Expected range, low | 7,545 to 7,585 |
| Expected range, mid | 7,595 to 7,668 |
| Expected range, high | 7,675 to 7,700 |
| Late-morning objective | if acceptance above 7,637.75 establishes in the 09:45 to 10:15 window, the path to 7,663 is thin and should be reached before noon |
| Afternoon objective on Path A | the 7,650 to 7,665 area during late morning and early afternoon |
| Evening reference | near 7,634 for range centring |
| Most likely daily range | 75 to 90 points, beneath Monday's 95 and above the implied 52 |
| Globex band absent a headline | 7,610 to 7,650 |
| Skip | an open above 7,660; overnight above 7,690 before the cash open; a geopolitical headline before the open in either direction; job openings more than 300,000 from consensus; an inside range narrower than 30 points by 11:30 ET; anything before 09:45 or after 16:00 ET |



