
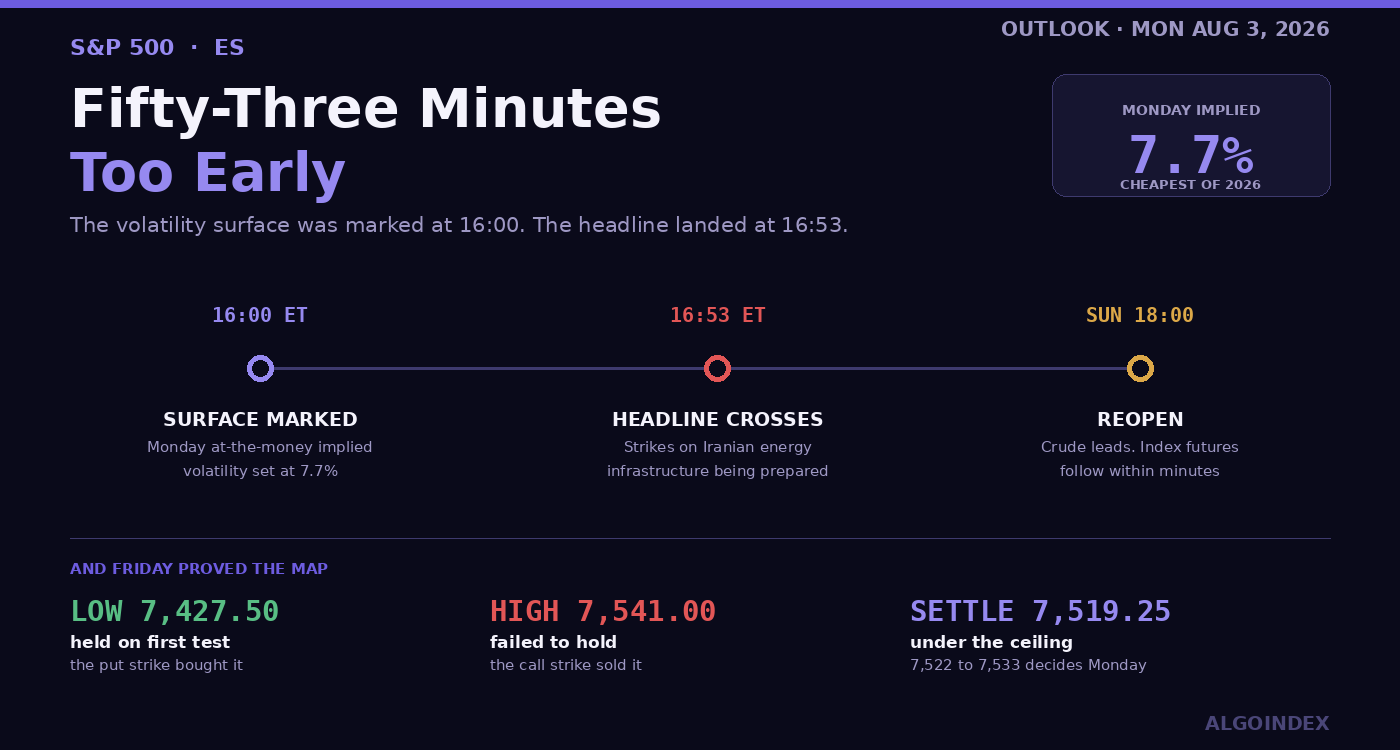
At four o'clock Friday the options market marked Monday's at-the-money volatility at 7.7 percent. Nowhere in 2026 has anything cheaper printed. Fifty-three minutes later, cash shut and futures in their maintenance break, the wires carried a report that Washington and Israel are readying strikes on Iranian energy infrastructure, conceivably within days. By Monday morning one of those two facts is going to look badly wrong.
A session that proved its own map
Take the headline away and Friday was an unusually clean piece of evidence. ES added 46.75 points to finish at 7,519.25, a gain of 0.63 percent on heavy two-way participation. It opened above Thursday's settle, sold off immediately, bottomed at 7,427.50, then travelled 113.50 points up to a 7,541.00 high, giving 21.75 of it back into the bell.
What makes the day useful is not the settlement. It is that both extremes landed on levels identified in advance, and both did what those levels said they would.
Start underneath. Friday's low printed a few points either side of two references that matter enormously: the level where dealer hedging flips from stabilising to amplifying, and a put strike carrying something like 60,000 lots. Price pushed into that pocket, the position threw off its mechanical bid, and the low held first time.
Overhead did the mirror image. The high cleared a strike where dealers hold roughly 27,000 lots of long calls, failed to stay there, and the contract closed back beneath it. A long call book sells into strength as it picks up delta, so that ceiling resists by construction. Sentiment has nothing to do with it.
Touch both edges of a positioning map inside one session and watch both behave as advertised, and the map stops being a theory. It becomes the thing you trade Monday.
A harder test sat in the middle of the afternoon. Over two and a half hours, cumulative customer delta on the index swung from around plus three billion dollars to minus three billion, which implies roughly six billion of dealer selling pushed out through hedging. Supply on that scale usually breaks something. Price ground higher into the close instead, which means demand from outside the options market, most likely month-end money rotating into equities, absorbed the lot.
By the bell that flow had round-tripped back to roughly plus three billion, near enough unchanged for the day. Its makeup was tactical, and same-day positioning dies with the session. The piece that survives into next week is about 1.6 billion of large-cap technology flow driven mostly by longer-dated calls, and that carries weeks of life rather than hours.
Three horizons, three different markets
Collapsing this into a single directional call would be a mistake, because the time frames genuinely disagree with each other.
Zoom out and the trend is intact and strong, with price hundreds of points clear of both slow means and up nearly ten percent across those windows. Zoom to a month and nothing has happened at all: the twenty-day change is negative one tenth of a percent, and the contract settled underneath both intermediate means. Zoom to a week and it is recovering, roughly 195 points off the monthly low with a five-day gain approaching one percent.
July's high has not been revisited. The annual high sits a little over two percent above, the annual low seventeen and a half percent below, and Friday's settle lands at about 63 percent of the July range. Upper middle, nowhere near the top.
That split produces what dominates Monday's board. The contract finished right underneath a ceiling built from four separate references, all inside a span of eleven points, with a computed target immediately above and a mean stall inside. Call the band 7,522 to 7,533. Whatever Monday turns out to be, it very likely gets decided on contact with it.
Direction of approach is the detail people skip. When a market pushes up at its intermediate means from underneath, five days after bouncing off a monthly low, the attempt being made is to reclaim a consolidation, not to extend a trend. Resistance under test from beneath. That is the harder side of the test to be on.
The studies disagree with the close, and they have a case
Across thirteen studies the multi-indicator composite comes to 32 percent sell, and its term structure copies the price structure precisely: heavily negative on short-term work, mildly negative in the middle, solidly positive on long-term. Every short-term component reads sell bar one on hold. Both long-term components read buy.
Direction is blunter still. The negative line beats the positive on every window measured, from nine days out to a hundred, and a nine-day strength reading in the mid thirties says the condition is genuinely trending rather than chopping. The direction it names is down. Against a session that closed up two thirds of a percent, that is a real contradiction and not a rounding error.
The reconciliation: July's slide from the monthly high set these readings, and five days of recovery has not undone them. Lagging turns is a known weakness of this family of indicators. But price is still under both intermediate means, so waving them away would be convenient rather than honest.
Relative strength contributes nothing either way, sitting in the low fifties on every lookback. Momentum thresholds in both directions are hundreds of points away, so no extreme exists to trade against. Stochastics are the one constructive note, lifting off a low base with the fast line now over the slow while the smoothed values are still catching up.
The year's thinnest volatility, and a weekend in front of it
Realised movement has held steady. True range across the nine, fourteen, twenty and fifty day windows falls between 1.28 and 1.40 percent, roughly a hundred points a session. Friday's span ran a shade above its fourteen-day figure, which is what a day that tests both edges of its map ought to look like.
The options market saw something calmer. One session of implied movement comes to 0.63 percent, about 65 index points. A month of implied at just under fourteen percent against realised just over twelve is a healthy premium rather than a distorted one, and percentile rank in the low twenties means implied volatility is cheap measured against its own trailing year. The volatility index itself closed a touch lower on the day.
Two things follow. The annualised relationships are internally consistent, so nothing is broken in the surface. And what this contract habitually covers in a day is far wider than the close-to-close outcome being priced. Those measures answer different questions, one about intraday extremes and one about where a day finishes, but the practical warning survives regardless: a session can close inside the implied band having covered a hundred points to get there. Put a stop 47 points away on something that routinely travels a hundred and noise takes it out long before the thesis does.
Applied to the settle, that implied move gives a band of about 7,472 up to 7,566. One housekeeping note on the published evening figures: the implied high and low quoted there were computed against an intraday cash reference well below the actual close, so they are stale. Use the recomputed band.
And then the qualification that outranks everything above it. That band describes what the market believed at four o'clock, before the energy reporting crossed. It fairly represents a quiet weekend and understates what Monday could actually deliver.
The headline, and what it would mechanically do
The report says preparations are under way to strike energy-related targets in Iran, possibly this weekend. Follow-on coverage named power plants and refineries, said Israel has been briefed and is coordinating, and noted that where the campaign stops has not been settled. One account described patience as having run out. An official statement framed it as pressure continuing until Iran engages seriously.
None of this arrived from nowhere. July built toward it. On the twenty-second came an explicit warning that an Iranian move against shipping in the Strait would be met by hitting a bridge or a power plant. A week later, that strikes would answer attacks on American targets in Jordan. And on Friday, word that a consortium running a pipeline has weighed halting oil and tanker operations for an open-ended period until safety guarantees materialise.
The transmission is specific, and it does not begin with equity sentiment. Hitting refining and power capacity is a supply-side energy event. Crude gaps at the Sunday reopen. Inflation expectations and the far end of the curve take the strain. The index then absorbs it twice over, once through rates and once through risk premium. This market carries the thinnest volatility of its year. Against that sequence it has no cushion at all. Friday evening's drift lower suggests it has started to acknowledge the possibility without going anywhere near repricing it.
A fragility inside the surface makes it worse. Implied volatility fell a point or three across fixed strikes into the weekend, and that decline was itself generating supportive hedging through Friday. The flow helps while volatility falls and reverses hard when it rises. With almost no compression left, a weekend event would turn that channel from helpful to amplifying in the same instant that it drove price down at the flip level. Compounding, not cancelling.
Give the symmetric case equal billing, though. If nothing happens, that same compressed surface becomes a relief mechanism, because whatever protection was bought ahead of the weekend has to come off, and that unwinding supports. Which is precisely why the setups below are built on levels instead of on a forecast.
What else is moving underneath
Policy is the second variable, and how the July decision was reached matters more than what it decided. The vote split nine to three, and all three dissenters wanted rates a quarter point higher. That reframes the internal argument: the question on the table is whether policy is loose enough, not whether it is too tight. Every upside inflation surprise from here strengthens that bloc directly.
Friday's data leaned their way. Wage costs overshot slightly, a regional activity survey beat comfortably, and final consumer sentiment came in above forecast. Firm activity alongside firm wage costs is exactly the combination the dissenters have been pointing at, and it is why the prices-paid component inside Monday's manufacturing release carries weight well beyond its usual billing.
Bonds took their cue from crude rather than from the Fed, coming under pressure as oil rose while the dollar traded lower. Watch that channel: when energy moves inflation expectations, the far end of the curve feels it without any change in guidance being required. Refunding estimates Monday afternoon and the full announcement Tuesday morning layer a supply variable onto the same pipe.
Leadership was narrow. The advance came from mega-cap technology, with one name up roughly fifteen percent on cloud results that beat. A correlation reading down at 6.2 is arithmetic for constituents moving independently of one another, and a three-quarter-percent cash gain led by one enormous single-stock move is not broad participation. It also explains part of the indicator contradiction, because a few giants are enough to carry an index weighted by size while most of its members drift, while trend measures sensitive to breadth register that drift.
Single-name volatility says the same thing from the opposite end. One storage name ran about thirty percent across two sessions on a market value near 200 billion dollars, and options on it marked at 173 percent implied. Moves that violent in companies that large are what keeps single-name volatility rich even while the index surface goes on compressing, and they explain that correlation reading directly.
Two more items belong in the file. The Treasury warned banks that yen intervention was possible, a suspected one got flagged in the early afternoon, and banks were reportedly asked to check where euro-yen was trading. Currency intervention reaches index futures through carry and through overnight risk appetite, so it deserves watching at the reopen alongside the energy story. Separately, gold fell while the dollar weakened, an odd pairing that points at positioning rather than a genuine flight to safety.
Where Monday gets decided
Above the market the confluence ceiling controls everything until it resolves. A stochastic threshold and a mean stall bracket Friday's high just over it, and clearing that narrow pair is what would confirm a genuine break rather than another probe. First pivot resistance follows with thin air between, so a confirmed break should cover that ground quickly.
Higher up, a deviation band pairs with the main upside dealer strike. Nowhere above the ceiling does hedging supply gather more thickly, which makes it the most consequential resistance up there. Sustained trade through it would restructure the whole board. Beyond sits a dense run from the second deviation up through July's high, then third pivot resistance and the annual high.
Below, two mean crossings form the first shelf with a crossover stall between them, and Friday evening has already traded down into it. The pivot shelf comes next, pairing the computed pivot with the momentum midpoint, and losing it would be the first honest sign the bounce is failing. Under that, a well-defined band gathers two retracements, Friday's open, the declared risk pivot and the volatility inflection level.
Then the decision zone, and it is unusually dense. Six separate references occupy nineteen points, among them a retracement from the four-week low, second deviation support, the dealer put strike, Friday's low, the gamma flip level and another retracement. The market already tested and held all of it once.
Above the flip level dealer hedging stabilises and pullbacks get absorbed. Below it hedging amplifies, and the market stops mean-reverting and starts trending. The put strike sits almost on top of the flip, so the two fail together, which turns a decisive loss into a signal rather than noise.
Beneath is where it gets uncomfortable. A deviation level and a stochastic threshold form the first shelf, then second pivot support near a high-probability node, then third pivot support with the downside dealer strike and the monthly low. Under that the structure thins out badly toward the quarterly low, with the primary gamma concentration strike far below. Several hundred points of very little, which is why losing the decision zone matters out of all proportion to the distance involved.
One cross-check is worth recording. Tonight's combination model puts its highest-probability nodes at six cash levels which, converted at the settle basis, land almost exactly on a map that was derived on its own, out of the computed technical set alone. One node reinforces the ceiling. Another reinforces the decision zone. Independent methods agreeing is not proof, but it is better than the alternative.
A precision note. The basis at settle and the basis embedded in the positioning data differ by roughly three points, so any cash-derived conversion carries that much slack. Levels published directly in futures terms are used exactly as published.
The trade
Short, fading the ceiling. It takes the primary slot on risk definition rather than on conviction, and the distinction is worth being explicit about. Four references stack inside the band with a computed target immediately above. Friday's high pierced it and failed. The dealer call position sells into strength mechanically. Short-term studies are heavily negative, direction leans down at every period, and price sits under both intermediate means.
Entry runs 7,524 to 7,533 on first approach, and it wants evidence rather than a touch: a five-minute close back beneath the band after trading into it, or an obvious failure to hold above it within a quarter hour. Nothing before 09:45. The stop goes at 7,547, clear of Friday's high and of the mean stall just above, so a real breakout invalidates the position and a probe does not. Measured from the middle of the zone, risk is about nineteen points.
Objectives step down the structure. First at 7,496 where the computed pivot meets the momentum midpoint, and most of the position comes off there. Second at 7,478 where two retracements, the risk pivot and Friday's open converge. Third at 7,451 pairing pivot and deviation support, a runner only. Roughly 1.7, 2.6 and 4.1 to one, and those ratios exist only because Friday's high supplies a clean invalidation immediately overhead.
Fifteen minutes of acceptance above the band is a structural invalidation and gets respected whether or not the nominal stop has printed, because at that point both intermediate means are reclaimed and the short-term structure has flipped outright. The setup also voids on a prices-paid print materially under forecast, since a disinflationary surprise of that kind argues for a breakout instead. It voids on confirmed strikes too, because that is repricing rather than anything technical, and entries built on levels mean nothing during one, however much the direction might appear to favour this side.
Two alternates sit either side. The breakout long triggers on acceptance above the band or a retest from above that holds, entering just over it with a stop back underneath and objectives at first pivot resistance and the deviation-plus-supply-strike pair. Any five-minute close back inside the band ends it.
The decision-zone long triggers on a flush into that dense support, and only after the zone confirms it is holding with a five-minute close back over its midpoint. Do not try to catch the move in. The stop goes under the flip level, objectives at the retracement shelf and the computed pivot. A quarter hour of acceptance beneath the flip ends it, because below there hedging amplifies and the next real reference is too far away to defend a long against.
Six things say stand down entirely. Confirmed strikes, because Monday becomes repricing and a gap resets the map rather than respecting it. A reopen gapping more than one percent, which kills the compressed-volatility premise the whole structure rests on. An open inside the 27-point band between the first shelf and the ceiling that then chops, because that band contains both crossings, both intermediate means plus the dealer resistance, all at once, so trading inside it on something with a hundred-point daily range just manufactures stop-outs from noise. A two-sided reaction to the manufacturing release, meaning twenty points both ways inside fifteen minutes. Hedging flow contradicting the setup at the level, which for the primary means reaching the ceiling while customer delta climbs steeply, since genuine demand overwhelming mechanical resistance puts the fade on the wrong side. And any attempt before 09:45 or after 11:30.
One release, one reopen, and a week that builds
Monday's first-order event is the ten o'clock manufacturing release, and the component that genuinely moves things is prices paid, for the reason set out above. The headline index is forecast modestly higher, the employment component carries a sub-50 prior that pushes the labour story forward into payrolls on Friday, and construction spending is a rounding error. The final manufacturing survey fifteen minutes earlier is a revision and should not matter.
Refunding estimates in the afternoon feed supply into the far end of the curve and can move the index late, with the full announcement Tuesday morning. Palantir reports after the bell, so expect the closing hour to carry single-name positioning rather than index positioning.
The overnight sequence starts before any of it. Chinese manufacturing data lands inside the Sunday reopen window, where it meets whatever the weekend has produced. European releases fill the pre-dawn: German retail sales, Swiss inflation, and a run of manufacturing surveys across the continent and Britain.
Treat the reopen as an event, not a session. Absent strikes, the Friday-evening band should hold, drifting back up at the settle as protection comes off, putting the contract into the cash session somewhere around 7,500 to 7,535. If strikes happen, it starts in crude and not in equities. Watch energy first, because a material gap higher there is the confirming signal and index futures follow inside minutes. Down that path the pivot and retracement shelves are unlikely to survive, and the only question is whether the decision zone absorbs a second test. A gap into a dealer put strike forces mechanical buying, so it should produce a real reaction even in an ugly scenario. That reaction is a bounce to assess, not a level to buy blind.
Base case, at 45 percent, is a quiet weekend and a rejection: contained trade, a turn away at the ceiling, support at the pivot and then the retracement shelf, settlement in the low 7,500s with a probability node pulling into the close. Twenty percent goes to a quiet weekend and a breakout, which would need prices paid to come in soft and the mega-cap bid to persist, and which would bring July's high back into play later on. Thirty percent goes to a weekend event and a gap-down repricing, with a violent but tradeable bounce if the decision zone holds and an amplifying pocket opening if it does not. The last five percent covers benign geopolitics with a hot prices-paid print driving a rate-channel selloff straight into the same zone without a gap.
That thirty percent is deliberately above what the options market implies, because the options market was priced before the headline. Behind it the week builds steadily: job openings, the trade balance and the refunding announcement Tuesday alongside chip and launch-sector results, services data and private payrolls Wednesday, claims and unit labour costs Thursday, and payrolls on Friday the seventh as the dominant catalyst. Fed speakers appear midweek. Friday capped a week we tracked through the squeeze and the shelf reclaim in our July 31 ES review, and the bounce has now carried price all the way back to the ceiling that has capped it since the July high.
The complete data picture
Every number behind Friday’s plan, charted first; the full numeric reference follows underneath.
Full numeric reference , every remaining figure from the review
| September settlement | 7,519.25, up 46.75 points or 0.63 per cent |
| Session shape | opened 7,479.50, low 7,427.50, high 7,541.00, span 113.50 points |
| Settled off the high | 21.75 points |
| Volume / open interest | 1,737,932 contracts / 2,025,408 |
| Cash index | 7,493.25, up 0.75 per cent from 7,437.63 |
| Futures basis at settle | plus 26.00 points; positioning data uses near plus 29.45 |
| Thursday's settle | 7,472.50 |
| Globex reopen | open 7,518.75, high 7,521.00, low 7,499.00, last 7,503.50, down 15.50 or 0.21 per cent |
| Inside market | 7,502.50 bid against 7,503.25 offered |
| Five sessions | up 0.96 per cent, roughly 195 points off the one-month low |
| Twenty sessions | down 0.12 per cent |
| Fifty sessions | up 1.12 per cent |
| Hundred sessions | up 9.17 per cent |
| Two hundred sessions | up 9.94 per cent |
| Year to date | up 7.53 per cent |
| July range | 7,324.00 to 7,632.00, a span of 308 points; settle at roughly 63 per cent |
| 13-week range | 7,255.50 to 7,693.75 |
| 52-week range | 6,401.75 to 7,693.75; the high 2.27 per cent above, the low 17.46 per cent below |
| 5-day | 7,451.30, price 67.95 above |
| 18-day | crossing 7,516.04, stall 7,528.75 |
| 20-day | 7,522.21, price 2.96 below |
| 40-day | crossing 7,506.72, stall 7,664.50 |
| 50-day | 7,530.18, price 10.93 below |
| 100-day | 7,281.58, price 237.67 above |
| 200-day | 7,138.29, price 380.96 above |
| Year-to-date | 7,200.48, price 318.77 above |
| 9-day | crossing 7,461.16, stall 7,545.75 |
| Intermediate spread | the 20-day and 50-day sit 7.97 points apart |
| Relative strength | 9-day 53.25, 14-day 51.55, 20-day 51.62, 50-day 53.54, 100-day 54.07 |
| Momentum thresholds | 50 per cent at 7,499.42, 70 per cent at 7,913.57, 30 per cent at 7,058.81 |
| Stochastic, 14-day | raw 63.39 per cent, fast line 40.15, slow line 27.95 |
| Stochastic, 9-day | raw 81.52 per cent, fast line 51.46, slow line 33.70 |
| Stochastic, 100-day | raw 86.49 per cent, fast line 80.95 |
| Direction, 9-day | strength 34.57, negative 18.99 against positive 9.88 |
| Direction, 14-day | negative 19.73 against positive 10.72 |
| Direction, 20-day | negative 20.02 against positive 12.03 |
| Direction, 50-day | negative 21.04 against positive 15.99 |
| Direction, 100-day | negative 23.44 against positive 19.94 |
| Composite | 32 per cent sell overall; short term 80 per cent sell, medium term 25 per cent sell, long term 67 per cent buy |
| Composite internals | 20-day mean against price, 20-to-50 crossover, 20-day bands and 7-day direction all sell; 10-to-8 channel hold; 100-day mean against price and 50-to-100 crossover both buy; trend signal sell |
| Average true range | 9-day 105.60 (1.40 per cent), 14-day 101.73 (1.35), 20-day 100.17 (1.33), 50-day 96.20 (1.28) |
| Average daily range | 9-day 108.67 (1.45 per cent), 14-day 98.27 (1.31), 20-day 92.18 (1.23) |
| Historic volatility | 9-day 14.73 per cent, 14-day 12.99, 20-day 12.22, 50-day 13.70 |
| Implied movement | one day 0.63 per cent or 65.49 index points; five day 1.62 per cent |
| One-month implied against realised | 13.95 per cent against 12.18, a premium of 1.77 |
| Ranks | implied volatility percentile 23.27 per cent, variance model 46.06, skew 45.85 |
| At-the-money implied, Monday | 7.7 per cent, the lowest of the year, marked 16:00 ET |
| Volatility index | 15.99, with volatility of volatility at 92 |
| Recomputed band | roughly 7,472 to 7,566 |
| Stale published figures | implied one-day high and low of 7,515.70 and 7,421.60 on cash were computed against an intraday 7,437 reference |
| 7,522 to 7,533 | the confluence ceiling: 20-day mean 7,522.21, 38.2 per cent off the 13-week high 7,526.34, dealer long call resistance 7,529.45, 50-day mean 7,530.18, computed target 7,532.56, 18-day stall 7,528.75 |
| 7,539.60 / 7,545.75 | stochastic 70 per cent level; 9-day mean stall, bracketing Friday's 7,541.00 high |
| 7,564.33 | first pivot resistance, thin space beneath it |
| 7,570.40 / 7,579.45 / 7,581.06 | stochastic 80 per cent; upside dealer supply strike (cash 7,550); one deviation resistance |
| 7,606.66 / 7,609.42 / 7,626.30 / 7,632.00 | two deviations; second pivot resistance; three deviations; the one-month high |
| 7,677.83 / 7,693.75 | third pivot resistance; the 13-week and 52-week high |
| 7,506.72 to 7,516.04 | 40-day crossing, 3-10 day crossover stall at 7,510.25, 18-day crossing |
| 7,495.92 / 7,499.42 | the computed pivot; where 14-day momentum returns to 50 |
| 7,474.63 to 7,484.45 | 50 per cent of the 13-week range; 50 per cent of the four-week range and stochastic 50 per cent both 7,478.00; Friday's open 7,479.50; declared risk pivot 7,479.45 (cash 7,450); volatility inflection 7,484.45 (cash 7,455) |
| 7,450.83 / 7,457.44 / 7,461.16 | first pivot support; one deviation support; 9-day crossing |
| 7,422.91 to 7,441.66 | the decision zone: 38.2 per cent off the four-week low 7,441.66, two deviations 7,431.84, dealer short put support 7,429.45 (cash 7,400), Friday's low 7,427.50, gamma flip 7,423.45 (cash 7,394), 38.2 per cent off the 13-week low 7,422.91 |
| 7,412.20 / 7,416.40 | three deviation support; stochastic 30 per cent level |
| 7,382.42 / 7,385.60 | second pivot support; stochastic 20 per cent level, near the 7,377 node |
| 7,324.00 to 7,337.33 | third pivot support 7,337.33, downside dealer strike 7,329.45 (cash 7,300), the one-month low |
| 7,255.50 / 7,029.45 | the 13-week low; primary gamma concentration (cash 7,000) |
| Upside dealer supply strike | 7,579.45 ES, 7,550 cash |
| Second resistance shelf | 7,554.45 ES, 7,525 cash |
| Dealer long call resistance | 7,529.45 ES, 7,500 cash, roughly 27,000 lots |
| Volatility inflection level | 7,484.45 ES, 7,455 cash |
| Declared risk pivot | 7,479.45 ES, 7,450 cash |
| Dealer short put support | 7,429.45 ES, 7,400 cash, roughly 60,000 lots |
| Dealer gamma flip level | 7,423.45 ES, 7,394 cash |
| Downside dealer support strike | 7,329.45 ES, 7,300 cash |
| Primary gamma concentration | 7,029.45 ES, 7,000 cash |
| Probability nodes, cash | 7,296, 7,348, 7,400, 7,497, 7,527, 7,549 |
| Same nodes on ES | roughly 7,322, 7,374, 7,426, 7,523, 7,553, 7,575 |
| Midday hedging swing | positive three billion dollars of cumulative customer delta to negative three, roughly six billion of implied dealer selling between 12:30 and 15:00 ET |
| Close | recovered to roughly positive three billion, near unchanged on a full round trip |
| Composition | about positive three billion of same-day call buying against negative two billion of same-day put buying |
| Large-cap technology flow | approximately positive 1.6 billion dollars, mostly longer-dated calls |
| Index call gamma / put gamma | 5.27 billion against negative 6.29 billion, net roughly negative 1.02 billion |
| Open interest | 13.106 million puts against 9.716 million calls, a ratio of 1.28 |
| Friday volume | 1.18 million puts against 784,390 calls |
| Positioning tilt | 1.035 on the index, gamma notional a small positive 53.6 million dollars |
| Fund complex gamma | negative 963.1 million broad market, negative 395.8 million technology, negative 1.049 billion small cap |
| Concentrations | largest open positioning at the August 20 expiry, largest delta far out at February 2027 |
| 25-delta risk reversal | negative 0.053, a mild put skew |
| Surface move | implied volatility fell one to three points across fixed strikes into the weekend |
| Equity fund managers | net long raised by 12,702 to 939,115 contracts |
| Equity fund speculators | net short trimmed by 28,795 to 287,277 contracts |
| July 29 decision | held, 9 to 3, with all three dissents favouring a 25 basis point increase |
| Employment cost growth | 0.9 per cent against 0.8 expected |
| Chicago regional survey | 57.6 against 56 expected and 56.7 prior |
| Final consumer sentiment | 55.2 against 54 expected |
| Eurozone inflation | headline 2.9 per cent, core 2.5 per cent, both marginally above expectations |
| Bank deposits | 19.401 trillion dollars, from 19.467 trillion the prior week |
| Oil rig count | up one to 451, total count 588 |
| Implied correlation | 6.2 |
| Single-name example | a storage name ran roughly 1,000 to 1,400 across two sessions on a market value near 200 billion dollars, options at 173 per cent implied, implied earnings move near 16 per cent |
| Currency | Treasury informed banks it may intervene in the yen; suspected intervention flagged 13:26 ET |
| 21:45 ET Sunday | Chinese manufacturing, forecast 52.0 against a prior 51.7 |
| 02:00 to 04:30 ET | German retail sales, Swiss inflation 02:30, Swiss manufacturing 03:30, French, German, Eurozone and British manufacturing 03:50 to 04:30 |
| 09:45 ET | final manufacturing survey, forecast 53.8 against 53.8, revision only |
| 10:00 ET | manufacturing index, forecast 53.9 against a prior 53.3 |
| 10:00 ET | prices paid, forecast 69.3 against a prior 73.0, the mover |
| 10:00 ET | employment component, prior 49.7 |
| 10:00 ET | construction spending, forecast 0.2 per cent against 0.1 |
| 15:00 ET | Treasury quarterly refunding estimates, full announcement Tuesday 08:30 |
| After the close | Palantir second-quarter results |
| Week ahead | job openings, trade balance and the refunding announcement Tuesday with chip and launch-sector results; services and private payrolls Wednesday; claims and unit labour costs Thursday; payrolls Friday August 7; Fed speakers midweek |
| Entry | 7,524 to 7,533 on first approach, on evidence of rejection; earliest 09:45 ET |
| Rejection defined | a five-minute close back below 7,522 after trading into the zone, or failure to hold above 7,533 within fifteen minutes |
| Stop | 7,547, above Friday's 7,541.00 high and the 7,545.75 stall; roughly 19 points |
| Target 1 | 7,496, approximately 32 points, roughly 1 to 1.7 |
| Target 2 | 7,478, approximately 50 points, roughly 1 to 2.6 |
| Target 3 | 7,451, approximately 77 points, roughly 1 to 4.1, runner only |
| Invalidation | fifteen minutes of acceptance above 7,533 |
| Macro override | void on a prices-paid print materially below 69.3, or on confirmed strikes |
| Trigger | fifteen minutes of acceptance above 7,533, or a retest from above that holds |
| Entry | 7,534 to 7,542 |
| Stop | 7,514, roughly 24 points |
| Target 1 | 7,564, approximately 26 points, roughly 1 to 1.1 |
| Target 2 | 7,580, approximately 42 points, roughly 1 to 1.75 |
| Invalidation | any five-minute close back below 7,522 |
| Entry | 7,428 to 7,441, only after a five-minute close back above 7,432 |
| Stop | 7,410, roughly 25 points |
| Target 1 | 7,478, approximately 44 points, roughly 1 to 1.8 |
| Target 2 | 7,496, approximately 62 points, roughly 1 to 2.5 |
| Invalidation | fifteen minutes of acceptance below 7,423 |
| High | 7,566 ES, 7,540 cash |
| Mid, most likely | 7,519 ES, 7,493 cash |
| Low | 7,472 ES, 7,446 cash |
| Intraday travel | excursion to roughly 7,455 or 7,570 would not violate the expectation |
| Settlement magnet on a quiet day | the 7,523 to 7,527 ES area |
| Firm defence area | 7,427 to 7,430, followed by a stall beneath the ceiling |
| Positioning note | a fund-manager net long above 939,000 contracts is a substantial committed position |
| Structural thinness | between 7,324 and 7,029 support is sparse, which is why losing the decision zone carries outsized consequence |
| Confluence readings | price settled between the 18-day crossing at 7,516 and its stall, and beneath the 7,520 to 7,530 pair |
| Cash-domain caution | cash-derived conversions carry roughly three points of uncertainty |
| Reference supports in a struck-weekend scenario | the 7,423 to 7,441 decision zone, then 7,329 |
| Shelves unlikely to survive a gap | the 7,495 pivot shelf and the 7,474 to 7,480 retracement shelf |
| Path A, 45 per cent | quiet weekend, rejection at the ceiling; holds 7,474 to 7,541, support 7,495 then 7,478, settles 7,505 to 7,525 |
| Path B, 20 per cent | quiet weekend, breakout; accepts above 7,533, clears 7,545, runs to 7,564 with scope toward 7,581 |
| Path C, 30 per cent | weekend energy event, gap below the 7,474 shelf, tests the decision zone; if it breaks, 7,382 then 7,324 to 7,337 |
| Path D, 5 per cent | benign geopolitics but a prices-paid print above 73.0 driving a rate-channel selloff into the decision zone |
| Reopen, quiet path | holds the 7,499 to 7,521 band, cash session opens roughly 7,500 to 7,535 |
| Skip | confirmed strikes; a reopen gapping more than one per cent, outside roughly 7,444 to 7,594; chop inside 7,506 to 7,533; a two-sided reaction of more than 20 points either way within fifteen minutes of 10:00 ET; hedging flow contradicting the setup at the level; any entry before 09:45 or after 11:30 ET |



