
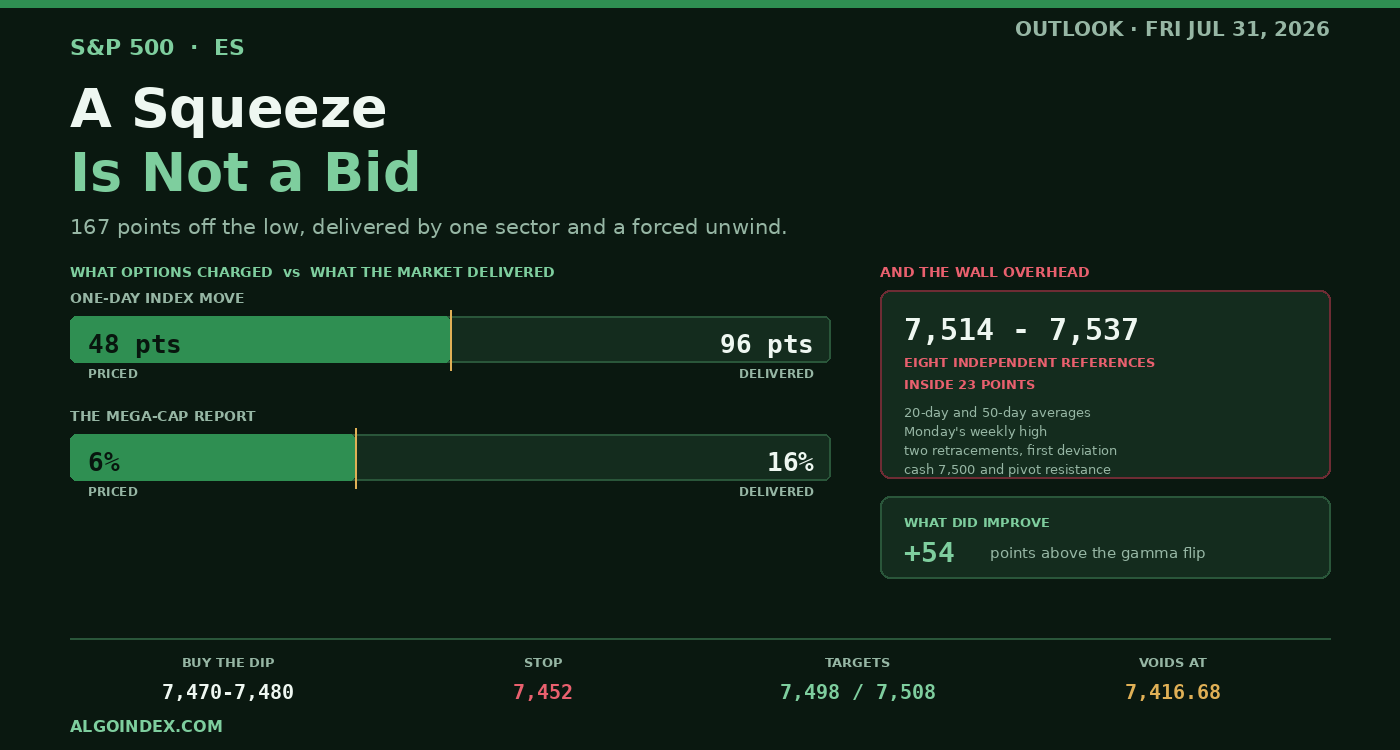
Thursday looked like a bottom. The E-mini ran 167 points off its base at 7,331.00, settled 7,472.50 in the top sliver of that range, and the cash index put on 1.7 percent while technology managed double it. One session earlier the contract had flushed to 7,324.00, which is still the low for both the week and the month. Two days later roughly 170 of those points are back. Wednesday night the story was three dissents and the shelf at 7,331. The shelf held, and Thursday came off it hard.
Now look at where it came from. Chips added 9 percent as a group. One mega-cap put on 16 percent, closing at 451, its biggest day since the autumn of 2008 and something like 500 billion dollars of value created in six and a half hours. Options had priced that name for roughly 6 percent. Two other names in the complex ran 18 and 26.
That is not breadth. That is one sector and one company carrying an entire index higher, and it raises an obvious question about what happens when they stop.
A squeeze is not a bid
The provenance matters more than the size. Commentary around the market attributes a good part of Thursday's advance in artificial-intelligence names to what one hedge fund held at the top of its book. That fund was reportedly wound up on Wednesday and its positions handed to a larger manager, with its assets said to be heading toward 10 billion dollars.
Liquidations of that kind hit whichever names were most crowded, hit them hard, and then stop. Nothing is left behind afterward. Real institutional demand puts a base under a rally; a finished liquidation has merely taken away a seller. Those two things look identical on a one-day chart and behave nothing alike on the second day.
Dealer hedging made it worse. For most of the day the index sat on the negative side of the gamma line, so intermediaries were trading alongside the move instead of resisting it. That probably stretched the mega-cap advance from somewhere near 390 up to 450, without being what caused it. Mechanical amplification on top of mechanical supply removal.
What genuinely improved
Two things did change for the better, and neither is cosmetic.
The volatility complex reset hard. The index shed 17.29 percent to finish at 17.08 after touching 20.08 intraday, and the measure that tracks volatility of volatility dropped 14 percent to 94.66. Fixed-strike readings came off between one and six points right across the curve. Three points of round trip alongside that second decline means hedges were genuinely being taken off, not that the measure drifted. Event premium from the Wednesday meeting and the Thursday morning inflation batch came out, and the desk note had said beforehand that releasing it would itself produce mechanical buying.
The second improvement is the more important one. Cash closed 7,438, which is roughly 54 points clear of where dealer gamma flips, down at 7,384. Through Thursday the index sat below that line, which is why the session produced so much two-way movement and why the advance ran as far as it did. On a closing basis the condition has inverted. Stay above that flip and dealer hedging stops destabilising and starts stabilising, with dips drawing systematic buying and the day's range tightening. That is the actual mechanical argument for a calmer Friday, and it is why the lean is constructive at all.
The catch is how narrow the corridor is. Futures have come to roughly 7,492 overnight, barely 15 points shy of the inflection level. With the flip underneath and that inflection overhead, this market is threading something tight, and the guidance all week has been that genuine stability needs 7,500 cash or better, which converts to 7,532.68 here. Until that trades, the improvement stays provisional.
Options are charging half of what this market delivers
This is the most exploitable number on the page. Across every lookback from 9 days out to 20, actual daily range has averaged close to 96 points. For the coming session options charge 0.64 percent, call it 48. So the market pays for about half of what it has been producing.
That gap is the arithmetic of releasing event premium, not a judgement about Friday. If the contract simply keeps doing what it has been doing, options are cheap against recent behaviour, and any range plan built off the implied band will understate the tail. It is also why the planning bands in this piece run wider than the quoted options band.
The wall overhead
Price has parked itself directly beneath the densest supply on the entire chart. Across the 23 points running from about 7,514 up to 7,537 there are eight separate references: one retracement measured off the four-week peak, a 20-day average, Monday's weekly high, a second retracement measured off the 13-week peak, a first deviation band, a 50-day average, the cash 7,500 conversion, and first pivot resistance.
Eight things agreeing on the same 23 points is not a level, it is a wall. Accept above it for any length of time and the intermediate structure changes. Get turned away and July's decline is confirmed as still running. And a consolidation directly beneath that much reference material does not usually break through on its first attempt.
Beneath the market the picture is friendlier. Five references stack inside 15 points between 7,468.25 and 7,482.68, including both 50 percent retracements and the settlement itself. Lower down comes the strangest coincidence anywhere on this map. Gamma flip: 7,416.68. First deviation support: 7,416.64. Four hundredths of a point between them. An options-derived structural line and a purely statistical one landing on the same price is a real confluence, and it marks where an orderly pullback would turn into something less orderly.
Positioning refused to join in
Nobody unwound their protection into Thursday's rally. Put gamma of negative 3.83 billion runs against call gamma of 1.16 billion, better than three to one, netting near negative 2.67 billion. Open interest tilts the same way, 12.886 million puts against 9.573 million calls, and volume did too. The 25-delta risk reversal sits at negative 0.065 with puts bid over calls.
There is a genuine counterpoint in the flow data, though. Hedging flow recorded around positive 7 billion dollars net on the session, roughly 3 billion of same-day put selling plus 4 billion of longer-dated call buying, with single-name flow adding about 3.5 billion of the same and 2.3 billion of that concentrated in the seven largest technology names. Writing puts and buying calls together expresses a direction. It is not an adjustment to a hedge. So the options market did participate in Thursday, which is the strongest argument that the move was not purely mechanical.
One more detail from the same model deserves attention. The high-conviction combination strikes score materially better beneath the market than above it, with three readings above 89 on the downside against one on the upside. Downside structure in the options is simply better mapped than upside structure. Put differently, this market has done more preparing for a fall than for a rise.
Friday has no data and two unpriced reports
The United States calendar is empty. Everything heavy arrived Thursday at 08:30: both inflation gauges, advance growth, the income and spending figures, and weekly claims. What is left is a European morning of second-tier prints and two domestic reporters before the bell, neither of which sets direction.
The actual first-order event is not on any calendar. Two of this index's heaviest constituents reported once Thursday's bell had gone, calls at 16:51 and 16:53, and no cash session has yet touched either result. What opens on Friday is largely a verdict on those two companies rather than on anything Thursday's chart contains. That single fact is why conviction stays moderate no matter how good the gamma-flip argument looks.
July finishes here too, and month-end brings rebalancing that is mechanical and mostly price-blind. The month sits 0.70 percent lower with two hard rally days immediately behind it, which makes guessing which way that flow points unreliable. Expect distortion into the bell and cut size through the last hour instead of adding to it.
The trade
Buy a pullback rather than the breakout. Entry runs 7,470 to 7,480, which covers the overnight low, the settlement, both 50 percent retracements and sits just under the cash pivot equivalent. Stop at 7,452, beneath the whole shelf but above the 5-day average. From the midpoint that is 23 points of risk. Targets are 7,498.00, then the inflection at 7,507.68, then 7,524.75.
Be honest about the geometry. Against a 96-point average range, 23 points of risk is about a quarter, which is tight, and nothing but the density of that shelf makes it defensible. Should the opening range come in above 30 points wide, take the stop down to 7,444 and shrink size to match, rather than running a tight stop at full size. First target is barely better than a scratch, so the trade earns at the second or the third. Recent calibration also says anything past roughly 50 points out has stopped paying dependably here, which makes 7,524.75 a ceiling rather than a staging post.
If Friday flushes instead of pulling back, the better structure is lower. The 7,420 to 7,432 pocket carries that gamma-flip coincidence, a 13-week retracement and the cash 7,400 equivalent, with a stop at 7,392 and objectives back at the settlement and the inflection. Around 33 points of risk for a considerably better payoff. It is the only place on this map that justifies full size, and it is also the less likely to be offered.
Against the primary bias, a clean rejection off 7,524 to 7,534 is tradeable short with a 7,545 stop back to 7,498 and 7,478. Half size at most, and it needs an actual rejection signature rather than a touch.
Weighting it: constructive containment, holding the overnight low all session and testing the inflection without accepting above 7,537, takes 45 percent. Rejection and rotation lower back through 7,468.25 toward that 7,416 confluence takes 35, and the downside combination scores plus the three-to-one gamma skew are what make it far more than a tail. Upside expansion through the shelf takes the remaining 20, and it needs both reports to land well plus follow-through that a forced unwind cannot supply.
Two caveats worth stating rather than burying. First, the dealer-positioning table is anchored to cash at 7,316, a price from before Thursday closed, so every structural level on it moves higher when Friday's morning run recomputes them. Second, Thursday's high, low and settlement for the regular session were solved out of the published pivots, because the history grid failed to draw. That working was checked against three separately published pivot levels and holds together to a hundredth of a point.
The honest summary is that Thursday fixed the mechanics without settling the argument. Dealer hedging now works for dips instead of against them, and the volatility premium is gone. But the rally that delivered those improvements was substantially a forced unwind, the composite has read sell for a month and did not flip, and price is compressed beneath eight overlapping references with two of the largest index members reporting into an empty calendar. Trade the shelf. Do not extrapolate the squeeze.
The complete data picture
Every number behind Friday’s plan, charted first; the full numeric reference follows underneath.
Full numeric reference , every remaining figure from the review
| September settlement | 7,472.50 |
| Session low / high | 7,331.00 / 7,498.00 |
| Range | 167 points, closing in the top 15 percent |
| Cash index | 7,438, up 1.7 percent |
| Technology benchmark | up 3.4 percent |
| Wednesday's low | 7,324.00, the weekly and monthly low |
| Two-session recovery | roughly 170 points off the low |
| Globex reopen | opened 7,479.50, range 7,468.25 to 7,504.50, near 7,492 at capture |
| Overnight volume | 45,210 contracts |
| Technology contract overnight | 28,402.75, up 165 points, high 28,572.00 |
| Basis | plus 32.68 points |
| Current 4-hour bar | 7,493.00 to 7,500.50, a compressed range |
| Three months | up 195.75 points, or 2.68 percent |
| 52 weeks | up 880.25 points, or 13.31 percent |
| July | down 53.00 points, or 0.70 percent, against a monthly open of 7,548.25 |
| Monthly high | 7,632.00 on July 16 |
| 50% retracement, four-week | 7,478.00 |
| 50% retracement, 13-week | 7,474.63 |
| Swing change of character | a higher low at 7,331.00 over 7,324.00, then a higher high at 7,504.50 over 7,498.00 |
| Not yet reclaimed | the weekly high at 7,524.75, set Monday July 27 |
| 5-day | 7,446.50, price above by roughly 46 points |
| 20-day | 7,521.01, price below by roughly 29 points |
| 50-day | 7,529.70, price below by roughly 38 points |
| 100-day | 7,281.34, price above by roughly 211 points |
| 200-day | 7,138.17, price above by roughly 354 points |
| 20-day to 50-day separation | 8.69 points, both inside the supply shelf |
| Relative strength, 9 / 14 / 20-day | 50.69 / 49.80 / 50.39 |
| Relative strength, 50 / 100-day | 53.07 / 53.83 |
| 9-day stochastic | raw 71.50 percent, fast 48.12, slow 32.58 |
| 14-day stochastic | raw 55.60 percent, fast 37.55, slow 27.08 |
| Composite | 32 percent sell for Friday, unchanged from the prior session |
| Composite history | 24 percent sell a week ago, 64 percent buy a month ago |
| Composite averages | 20-day at 80 percent sell, 50-day at 25 percent sell, 100-day at 67 percent buy |
| Average true range, 9-day | 97.02 points, 1.29 percent |
| Average true range, 14-day | 96.21 points, 1.28 percent |
| Average true range, 20-day | 96.30 points, 1.28 percent |
| Average daily range, 14-day | 92.75 points, 1.24 percent |
| September implied volatility | 14.38 percent with 49 days to expiry |
| Implied volatility rank | 38.01 percent |
| Options-implied one-day move | 0.64 percent, roughly 48 points |
| Options-implied five-day move | 1.62 percent |
| Options implied move, dollars | 74.95 |
| One-range band around the settle | 7,376 to 7,569 |
| Implied band | roughly 7,424 to 7,520 |
| Volatility index | closed 17.08, down 17.29 percent, having ranged 17.00 to 20.08 |
| Volatility of volatility | closed 94.66, down 14 percent |
| Fixed-strike volatility | down between 1 and 6 points across the curve |
| Immediate | 7,498.00 Thursday's high, 7,504.50 the overnight high |
| Volatility inflection | 7,507.68, cash 7,475 |
| The supply shelf | 7,514.34, 7,521.01, 7,524.75, 7,526.34, 7,528.36, 7,529.70, 7,532.68 and 7,536.67, eight references inside 23 points |
| Beyond the shelf | 7,551.49 second deviation, 7,557.68 cash 7,525 equivalent |
| Then | 7,569.25 third deviation, 7,582.68 cash 7,550 equivalent |
| Higher | 7,600.83 second pivot resistance |
| Double reference | 7,632.00 July high with 7,632.68 the cash 7,600 equivalent |
| Extended | 7,693.75 the 52-week and 13-week high, 7,703.67 third pivot resistance |
| Call wall | 7,732.68, cash 7,700, with no meaningful options ceiling nearer |
| First shelf | 7,482.68 cash pivot equivalent, 7,478.00, 7,474.63, 7,472.50 and 7,468.25, five references inside 15 points |
| Morning pullback objective | the 7,470 to 7,485 shelf, where the constructive path looks for a bid |
| Secondary shelf | 7,446.50 the 5-day average, 7,441.66 the 38.2 percent four-week retracement |
| Pivot band | 7,433.83 the pivot, 7,432.68 the cash 7,400 equivalent |
| The double confluence | 7,416.68 the dealer gamma flip and 7,416.64 the first deviation support, four hundredths of a point apart, with 7,422.91 just above |
| Beneath | 7,393.51 second deviation, 7,375.75 third deviation, 7,369.67 first pivot support |
| The major base | 7,324.00 the weekly and monthly low, 7,331.00 Thursday's low, 7,332.68 the put wall, all inside 9 points |
| Deeper | 7,266.83 second pivot support, 7,255.50 the 13-week low, 7,202.67 third pivot support |
| Primary gamma concentration | 7,032.68, roughly 460 points beneath current trade |
| Net hedging flow | roughly positive 7 billion dollars |
| Composition | approximately 3 billion of same-day put selling, 4 billion of longer-dated call buying |
| Single-name flow | approximately 3.5 billion of longer-dated call buying, roughly 2.3 billion from the largest seven technology names |
| Put open interest | 12.886 million against 9.573 million calls |
| Volume | 1.046 million puts against 758,235 calls |
| 25-delta risk reversal | negative 0.065, puts bid over calls |
| Call gamma / put gamma | 1.16 billion / negative 3.83 billion, net roughly negative 2.67 billion |
| Estimated gamma notional | roughly negative 1.7 billion |
| Gamma tilt ratio | 0.785 |
| Net gamma index | negative 2.502 |
| Skew rank | 36.76 percent |
| Largest gamma expiry | August 20, 2026 |
| Model structural levels, cash and futures | inflection 7,475 / 7,507.68, flip 7,384 / 7,416.68, put wall 7,300 / 7,332.68, call wall 7,700 / 7,732.68, primary strike 7,000 / 7,032.68 |
| Ladder, cash | resistance 7,500, 7,525, 7,550 and 7,600; pivot 7,450; support 7,400 and 7,300 |
| Pivot behaviour | the cash 7,450 pivot acted as resistance repeatedly, with the close at 7,438 |
| Distance above the flip | cash closed roughly 54 points above 7,384 |
| Distance to the inflection | futures near 7,492, some 15.68 points beneath 7,507.68 |
| Combination strikes above spot, cash | 7,499 at 82.87, 7,528 at 68.70, 7,543 at 72.83, 7,550 at 80.13, 7,572 at 84.23, 7,601 at 90.15 |
| Combination strikes below spot, cash | 7,448 at 83.22, 7,419 at 78.65, 7,397 at 92.56, 7,375 at 78.24, 7,367 at 89.87, 7,353 at 97.12 |
| Key strikes, cash | 7,000, 7,400, 7,500 and 8,000 |
| Wednesday's decision | rates held on a 9 to 3 vote, three dissents favouring a 25 basis point increase |
| Market positioning into it | the widest uncertainty over a possible hike in roughly three decades |
| Press conference read | less hawkish than the prevailing baseline, pulling the two-year yield lower and steepening the curve |
| Thursday's core inflation | expected 3.3 percent year over year against 3.4 percent prior |
| Thursday's headline inflation | 3.7 percent against 4.1 percent prior |
| Advance growth | 2 percent against 2.1 percent |
| 10-year yield | 4.651 percent, down 0.47 percent, having ranged 4.647 to 4.673 |
| Dollar index | 100.163, up 0.20 percent |
| Crude | roughly 81.90, down about 2 percent overnight |
| Credit warning | the United States private credit default rate reached a new high in the second quarter of 2026 |
| Semiconductor sector | up 9 percent, with individual names up 18 and 26 percent |
| The largest single move | up 16 percent to close at 451, the biggest session since October 2008, roughly 500 billion dollars of market capitalisation added against an implied move near 6 percent |
| Amplification | negative gamma likely stretched that advance from roughly 390 to 450 |
| Provenance | commentary attributes a meaningful share of the day's gains to the top holdings of a hedge fund reportedly liquidated Wednesday, its book sold to another large manager, with that fund's assets set to fall to 10 billion dollars |
| Thursday miss | revenue 1.22 billion against 1.29 billion expected, transaction revenue 599.2 million against 635.1 million |
| Thursday beat | revenue 1.66 billion against 1.52 billion expected, deliveries 12,194 against 11,471, loss per share 0.63 dollars against 0.97 a year prior |
| Infrastructure news | capacity announced for up to 3,000 artificial-intelligence racks per month |
| Unpriced into Friday | two of the largest index weights reported after the close, with calls at 16:51 and 16:53 |
| Entry zone | 7,470 to 7,480 |
| Stop | 7,452, structural |
| Risk from the 7,475 midpoint | 23 points |
| Target 1 | 7,498.00, plus 23 points |
| Target 2 | 7,507.68, plus 33 points |
| Target 3 | 7,524.75, plus 50 points |
| Reward | roughly 1.0, 1.4 and 2.2 to one |
| Adjustment | if the opening range prints wider than 30 points, stop to 7,444 and reduce size |
| Invalidation | sustained trade beneath 7,468.25 on rising participation; a close beneath 7,416.68 voids the constructive thesis entirely |
| Macro override | any escalation report on Iran or the Strait |
| Deep confluence long, entry | 7,420 to 7,432 |
| Stop | 7,392 |
| Targets | 7,472.50, then 7,507.68 |
| Risk / reward | roughly 33 points for 1.4 and 2.5 to one; the only location justifying full size |
| Supply shelf short, entry | 7,524 to 7,534 |
| Stop | 7,545 |
| Targets | 7,498.00, then 7,478.00 |
| Risk / reward | roughly 16 points for 1.9 to one; half size, and it requires a rejection signature rather than a touch |
| Constructive containment | 45 percent, closing 7,490 to 7,520 |
| Rejection and rotation lower | 35 percent, through 7,468.25 toward the 7,416 confluence, with 7,375 to 7,393 and the 7,324 to 7,333 base beyond |
| Upside expansion | 20 percent, converting 7,537 to support toward 7,551 and 7,557.68 |
| High band | 7,530 to 7,540 |
| Upper mid | 7,507 to 7,525 |
| Most likely | 7,472 to 7,510 |
| Lower mid | 7,432 to 7,468 |
| Low | 7,415 to 7,425 |
| Most likely settlement | 7,480 to 7,515 |
| Overnight base case | containment inside 7,468 to 7,510 |
| Session rules | no entries before 09:45 or after 16:00 |
| No edge | any open that gaps directly into 7,507 to 7,537 |
| Rebuild required | a reaction gapping the contract more than roughly 1.5 percent, about 112 points |
| Absent participation | an opening range that penetrates both extremes without acceptance |
| Geopolitical | any Iran or Strait escalation report |
| Month end | the final hour, where rebalancing flows will not respect technical levels |
| United States macro | none scheduled |
| 01:00 | Japanese housing starts, forecast 12.7 percent year over year against 33.9 percent prior |
| 02:00 | German import prices, forecast 6.0 percent year over year against 6.8 percent prior, negative 0.7 percent monthly against 0.7 percent prior |
| 02:30 | Swiss retail sales, 3.5 percent prior |
| 02:45 | French harmonised inflation, forecast 2.0 percent against 2.0 percent prior; consumer prices 0.3 percent monthly against negative 0.3 percent, 1.8 percent annually against 1.8 percent |
| 06:15 | Energy major, second quarter results |
| 07:45 | Pharmaceutical major, second quarter results |
| 10:00 | Cabinet meeting, tentative |
| Month end | July closes with this session |
| Monday August 3, 15:00 | Treasury quarterly refunding estimates |
| Tuesday August 4, 08:30 | Refunding announcement |
| Model vintage | the dealer-positioning table is referenced to a cash price of 7,316 and a futures price of 7,348.68, both predating Thursday's close; levels migrate on the morning run |
| Derived session figures | Thursday's regular-hours high, low and settlement were solved from the published pivot set because the daily history grid did not render, verified against three independently published pivot levels and internally consistent to a hundredth of a point |
| Capture timing | 22:15 ET, roughly four hours into the Friday Globex session, against an 18:30 schedule |
| Desk note used | Thursday's own 17:15 ET edition |



