
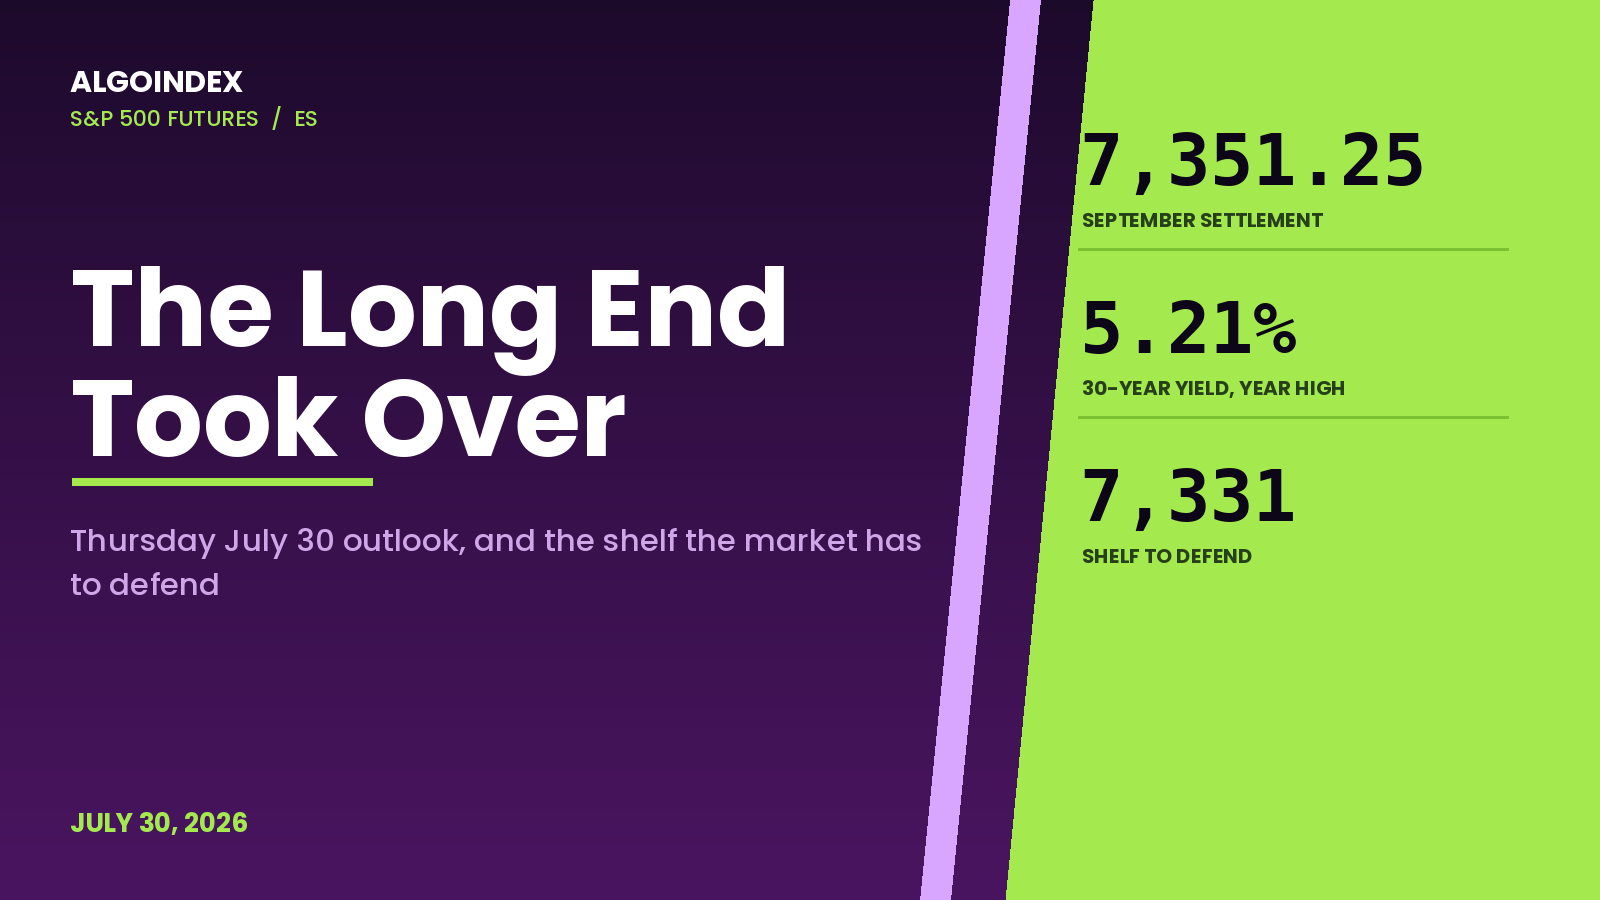
By 2:50 Wednesday afternoon the hedging demand propping up the S&P 500 was worth roughly ten billion dollars in delta notional, and it had just erased the entire day's loss. Ten minutes later it rolled over. The cash index closed 7,316, down 1.52 percent and its weakest finish in a month, while the September E-mini settled 7,351.25, off 1.59 percent.
Ten billion dollars of buying lost because the buying was in the wrong asset. The Federal Reserve held at 3.75 percent, then showed a 9 to 3 vote with three officials dissenting in favour of a quarter-point increase. The 30-year yield jumped 2.2 percent to 5.21, its highest print of the year, and equity support stopped behaving normally. Thursday inherits that with a personal consumption expenditures report at 8:30. One quirk keeps it tradeable. Dealers are short gamma above spot as well as below, so a credible upside catalyst forces them to buy.
How Wednesday came apart
Into the 6:30 hour the September contract was up 0.24 percent. At 8:16 that ended, when press reports carried the President’s statement that United States strikes would take place against Iran in response to attacks on American targets in Jordan. By 10:06 the cash index was down 0.18 percent with the Dow off 0.85. By 11:25 the index was down 0.71, the Dow 1.53 and the Nasdaq 100 0.98.
Then the afternoon looked, briefly, like a real recovery. Hedging flow accumulated from 12:20 and price erased the whole loss into the 2:00 announcement. The statement was a hold. The vote was the story: 9 to 3, with language retained noting inflation remains elevated. Rate futures had walked July hike odds from 13 percent to between 32 and 36 over the prior week, and the market priced roughly 64 percent for no change. The dissent structure was not discounted.
Support rolled over near 3:00 and selling took the last hour. An 8,000 lot same-day iron condor set at 7,475 and 7,480 against 7,325 and 7,320 had its lower put side breached into the bell. A 13,000 lot put had gone up at the 7,290 strike near 1:00. Somebody leaned short into the event and got paid.
In Wednesday's note we put the decision gate at 7,484 in the E-mini and called the market defensive underneath it. Price never printed above that line, not once all session. The cash index instead travelled a 185 basis point range against the 72 basis points its own same-day options had priced.
The bond market took the wheel
Stocks, bonds and the dollar all closed lower together. That is the signature of an inflation scare, not a growth scare, and it explains why ten billion dollars of demand could not hold a bid. The dollar index fell 0.6 percent despite a hawkish outcome, which is what happens when a market reads inflation as a credibility question. Gold pushed above $4,000, up 0.7. The discount rate went up and the multiple came down.
Crude did the setup work first. Tuesday at 5:45 in the evening Iranian forces fired ballistic missiles at American troops in Jordan, all intercepted. September crude reversed anyway, from a 79.26 settlement to 82.68 with an 83.25 high. Wednesday’s strike headline carried it to 84.09 by 8:38, up 6.19 percent, and a 7.167 million barrel inventory draw pushed it to 85.22 by late morning. Energy was one of the few green sectors.
Bond volatility bled into equity volatility from there. Fixed-strike implied volatility lifted 0.3 to 1.0 points across the surface, the volatility index closed 20.63, and at-the-money implied volatility for Thursday finished 23.59 percent. That prices roughly 108 index points against an 88.52 point average daily range. Premium costs more now. The expected range widened too.
Short gamma cuts both ways
Dealer positioning is negative essentially everywhere, and the readings are not marginal. Protection is bid on top of it: put volume of 892.15 thousand beat call volume of 695.06 thousand, put-to-call open interest sits at 1.27, and the 25-delta risk reversal reads negative 0.062 on the cash index.
That arrangement is why Wednesday’s break accelerated. Hedging requires selling into declines when dealers are short gamma, and the negative pocket runs continuously from spot down to the 7,000 cash strike. The mirror image keeps getting ignored. Negative positioning also sits above spot, so a credible upside catalyst forces dealers to buy, and that buying begets more of it.
Dated 5:22 in the evening, the published level map puts the call side barrier at 7,700 cash, the volatility inflection level at 7,465, the gamma flip at 7,385, the put side barrier at 7,300 and the primary gamma concentration strike at 7,000. On a 33.45 point basis those read 7,733.45, 7,498.45, 7,418.45, 7,333.45 and 7,033.45 in futures. We grade every one of these levels forward.
Leveraged funds are the one crack. Reported positioning as of July 21 has dealers adding 32,158 shorts, asset managers 10,742 and commercials 15,620, while leveraged funds cut 30,757 shorts and added 11,380 longs. Somebody in the fast money has started covering.
The megacaps split the difference
During cash hours the largest memory maker fell 9.94 percent, a power and cooling supplier 17.26, a storage name 7.32, a packaging and test supplier 6.48, a merchant chip designer 5.51 and a radio frequency supplier 5.40. Index damage follows mechanically from that.
Microsoft then beat cleanly. Adjusted earnings of $4.74 against a $4.25 estimate, revenue of $90.01 billion against $87.72 billion, and cloud revenue of $59.3 billion growing at its fastest pace since 2022. Capital expenditure landed at $35.80 billion against $35.22 billion expected. The stock traded roughly 2 percent higher.
Meta went the other way. It missed, narrowed its capital expenditure guidance, and fell roughly 11 percent against the 7 percent its options had priced. Management framed artificial intelligence as a packaged business service sold through subscriptions and volume pricing, a longer-dated story than anyone wanted next to a miss. Qualcomm matched at $2.21 and beat on revenue, then guided fourth quarter earnings below consensus.
Breadth underneath was worse than the headline. The Dow’s 2.19 percent decline exceeded the broad index’s 1.52, unusual when technology leads lower, and the Nasdaq 100 fell 2.06 to a three-month low. Airlines dropped 5.70 and 3.39 percent and a large freight name lost 4.39. Software held.
What the structure says
The daily picture is a finished distribution. This week opened 7,490.00, printed 7,524.75 and has fallen to 7,324.00, a 200.75 point range. Five-day change is negative 189.00 points, twenty-day negative 197.00, or 2.51 and 2.61 percent. Almost the whole monthly decline arrived in five sessions.
Zoom out and it reads differently. The three-month window is still positive by 128.25 points and the 52-week window up 726.75, 10.97 percent, leaving price 4.45 percent under its annual high. Short-term down, intermediate neutral to down, long-term up. That argues against carrying shorts into the long-horizon averages.
The 5-day average at 7,431.45, the 20-day at 7,526.21 and the 50-day at 7,528.75 all sit overhead, the 100-day at 7,269.55 and the 200-day at 7,131.75 beneath. Reclaiming 7,431.45 is the minimum evidence for the word recovery.
Momentum readings are deeply stretched. The 14-day raw stochastic prints 8.85 percent and 14-day relative strength 37.01, down 8.41 on the session. The 9-day directional index reads 32.31 with negative movement at 26.21 against positive at 7.39, then decays to 6.50 by the 100-day window. This is a young impulse, and young impulses produce the most violent counter-moves.
Thursday's map
Overnight already declared its intent. It reopened at 7,338.00, probed straight to 7,331.00, then ran 45.5 points to 7,376.50 on the Microsoft result and has consolidated under the high on light volume since. Working references are 7,376.50 to clear and 7,331.00 to defend. A slide under 7,351.25 says the earnings bid is finished before the cash market opens.
Europe fills the hours in between. German preliminary consumer prices at 8:00 are the only print with real spillover, forecast 2.7 percent against 2.30 prior. Then the 8:30 block decides the day, leaving the opening range as pure reaction. The afternoon has its own problem: Wednesday’s precedent says the last hour is where support disappears, so fade morning extremes between 12:00 and 2:00. The dashboard tour walks the same read end to end.
The primary trade is a long off the confluence shelf, where five independent references sit inside fourteen points. Buy 7,331 to 7,338. Require the first test to hold with no 15-minute close below 7,324.00, stop at 7,319, and scale most of the position at the first two targets. The third is the flip at 7,418.45, where hedging inverts.
Lose 7,324.00 on a 15-minute close and the whole thesis voids, with no long re-entry beneath it, because negative positioning runs continuously from there toward 7,033. The macro override is separate: core at or above 3.5 percent, or the advance growth price index materially above 4.0, or the 30-year above 5.30. Wednesday was the demonstration.
The ways to be wrong are worth naming. Nothing before 9:45 and nothing after 4:00. An open below 7,283 invalidates both setups. An open above 7,435 invalidates both at their planned levels. Price between 7,345 and 7,405 at 10:30 with a contracting range is a stand-aside.
Call it 45 percent for the constructive resolution: 7,351.25 defended, 7,376.50 cleared, the 7,392 to 7,397 band worked through and 7,418.45 tested. The inflation-driven break is 35, losing 7,351.25, then 7,333.45, then 7,324.00 on a 15-minute close and accelerating into 7,283 to 7,309. Chop takes the remaining 20.
Five references sit inside fourteen points at 7,331, and by 9:45 the bond market will already have told everyone whether they matter.
The complete data picture
Every level, print and reading behind Thursday’s plan. Levels are quoted in the September E-mini domain; the cash index equivalent runs roughly 33 to 35 points lower, and cash strikes are shown where the level originates in the options data.
| 7,733.45 | Upper call side gamma barrier, cash 7,700 |
| 7,693.75 | 52-week high, set June 2 |
| 7,637.17 | Third computed resistance point |
| 7,632.00 | July high, set the 16th |
| 7,591.50 | 18-day average stall |
| 7,569.08 | Second computed resistance point |
| 7,533.00 | First stability reference, cash 7,500, top of the heaviest supply band |
| 7,528.75 | 50-day average |
| 7,526.21 | 20-day average, converged with the 50-day |
| 7,524.75 | This week's high |
| 7,521.24 | 18-day average crossing |
| 7,514.60 | 40-day average crossing |
| 7,500.25 | July opening print |
| 7,499.84 | Where 14-day relative strength registers 50 |
| 7,498.45 | Volatility inflection level, cash 7,465 |
| 7,490.00 | This week's opening print |
| 7,483.00 | Directional pivot, cash 7,450, bearish below and bullish above. Capped the entire Wednesday cash session |
| 7,478.00 | 50 percent retracement of the 4-week range |
| 7,465.94 | 9-day average crossing |
| 7,460.17 | First computed resistance point |
| 7,441.66 | 50 percent retracement of the 13-week range |
| 7,441.38 | 38.2 percent retracement from the 4-week low |
| 7,433.00 | Support reference turned resistance, cash 7,400 |
| 7,431.45 | 5-day average. Minimum reclaim before recovery is the right word |
| 7,430.14 | Third standard deviation resistance |
| 7,418.45 | Dealer gamma flip level, cash 7,385. Hedging inverts above it |
| 7,415.66 | Second standard deviation resistance |
| 7,396.80 | First standard deviation resistance |
| 7,392.08 | Computed daily pivot, first decision point of the session |
| 7,376.50 | Overnight high, the line to clear |
| 7,372.00 | Current overnight print, up 20.00 points or 0.27 percent on the settle |
| 7,367.50 | Overnight consolidation low, first support |
| 7,351.25 | Wednesday settlement. Settlements act as magnets the following session |
| 7,338.00 | Globex reopening print, upper edge of the confluence shelf |
| 7,333.45 | Put side dealer barrier, cash 7,300 |
| 7,331.00 | Overnight low, tested and rejected 45.5 points higher |
| 7,329.11 | Computed target price |
| 7,324.00 | One-month low and Wednesday's low. Structure breaks on a 15-minute close beneath |
| 7,309.39 | 18 to 40 day average crossover |
| 7,305.70 | First standard deviation support |
| 7,294.25 | 3 to 10 day average crossover stall |
| 7,286.84 | Second standard deviation support |
| 7,283.17 | First computed support point, first objective of a data driven break |
| 7,272.36 | Third standard deviation support |
| 7,269.55 | 100-day average, first genuinely long horizon support |
| 7,217.64 | Where 14-day relative strength registers 30 |
| 7,215.08 | Second computed support point |
| 7,200.21 | 61.8 percent retracement of the 52-week advance |
| 7,196.38 | Year-to-date average |
| 7,189.00 | 13-week low |
| 7,131.75 | 200-day average, deep structure |
| 7,106.17 | Third computed support point |
| 7,033.45 | Primary gamma concentration strike, cash 7,000, lower boundary of the negative positioning pocket |
| 6,401.75 | 52-week low, set March 31 |
| Globex reopen, 18:00 Eastern | 7,338.00 |
| Overnight band | 7,331.00 low to 7,376.50 high, 45.5 points |
| Current 4-hour candle | O 7,338.00 · H 7,376.50 · L 7,331.00 · last 7,372.00, up 36.75 |
| Current 1-hour candle | Same open, high and low, up 37.00 points or 0.50 percent |
| Latest 30-minute candle | O 7,371.25 · H 7,373.25 · L 7,367.50 · C 7,372.50, light volume |
| Prior close, Wednesday settlement | 7,351.25 |
| Current print against settlement | Near 7,371, up 20.00 points or 0.27 percent |
| Wednesday cash session | Close 7,316, down 1.52 percent, 185 basis point range |
| Expected range envelope, Thursday | 7,300 low endpoint to 7,435 high endpoint, about 135 points |
| Overnight working plan | 7,376.50 to clear, 7,331.00 to defend, 7,392 constructive, under 7,351.25 exhausted |
| 01:30 | French preliminary second quarter growth, forecast 0.2% quarter over quarter against negative 0.1% prior |
| 02:00 | German flash second quarter growth, forecast 0.1% quarter over quarter against 0.3% prior |
| 03:00 | Swiss leading indicator, forecast 100.9 against 101.2 prior |
| 04:00 | Italian preliminary growth, forecast 0.05% against 0.3% prior |
| 05:00 | Eurozone flash growth, forecast 0.2% quarter over quarter against negative 0.2% prior, and unemployment, forecast 6.2% unchanged |
| 07:00 | Bank of England rate statement and bank rate, forecast 3.75% unchanged, prior vote 7 unchanged, 2 hike, 0 cut |
| 08:00 | German preliminary consumer prices, forecast 2.7% year over year against 2.30% prior, and harmonised prices, forecast 2.8% against 2.40% |
| 08:00 | Mastercard second quarter results |
| 08:30 | United States core personal consumption expenditures, forecast 3.3% year over year against 3.4% prior, and 0.2% month over month against 0.3% prior |
| 08:30 | United States headline personal consumption expenditures, forecast 3.7% year over year against 4.1% prior, and negative 0.1% month over month against 0.4% prior |
| 08:30 | United States advance second quarter growth, forecast 2.0% against 2.1% prior, growth price index forecast 4.0% against 3.6%, advance core prices forecast 3.5% against 4.4% |
| 08:30 | United States initial jobless claims, forecast 200,000 against 187,000 prior, and continued claims, forecast 1.795 million against 1.796 million |
| 08:30 | United States personal income, forecast 0.3% against 0.7% prior, consumer spending, forecast 0.4% against 0.7%, and real personal consumption, forecast 0.4% against 0.3% |
| 16:00 | Amazon second quarter results |
| 16:05 | Rivian second quarter results |
| 16:15 | Coinbase second quarter results |
| 16:30 | Apple third quarter results |
| 23:30 | Bank of Japan rate statement and decision, forecast 1% unchanged |
Full numeric reference, every remaining figure from the review
| Target rate | Unchanged at 3.75%, matching forecast and prior |
| Vote | 9 to 3, three dissents in favour of a 25 basis point increase |
| Market pricing into the day | Roughly 64% no change, hike odds repriced 13% to 32-36% over the week |
| Session timeline | Up 0.24% into 06:30, strike headline 08:16, index down 0.18% at 10:06, down 0.71% at 11:25, flow support 12:20 to 14:50, rollover near 15:00 |
| Hedging flow | Roughly $10 billion in delta notional, supportive then inverted |
| Structural options positions | 8,000 lot same-day iron condor 7,475 and 7,480 against 7,325 and 7,320, put side breached; 13,000 lot put opened at the 7,290 strike near 13:00 |
| Cross-asset | 30-year yield 5.21%, up 2.2%; dollar index down 0.6%; gold above $4,000, up 0.7%; crude sharply higher |
| Crude inventories | Draw of 7.167 million barrels against a forecast build of 1 million and a prior build of 2.010 million |
| Thursday's inflation forecasts | Core 3.3% against 3.4% prior; advance second quarter core deflator 3.5% against 4.4% prior |
| Tariff note | Effective United States tariff rate reported at 7.4% |
| This week | Open 7,490.00, high 7,524.75, low 7,324.00, range 200.75 points, week to date down 76.75 or 1.03% |
| 5-day and 20-day change | Down 189.00 points or 2.51%; down 197.00 points or 2.61% |
| July | Open 7,500.25, high 7,632.00 on the 16th, low today, month down 149.00 points or 1.99% |
| Three-month window | Up 128.25 points or 1.78%; 13-week low 7,189.00 |
| 52-week window | Up 726.75 points or 10.97%; high 7,693.75 on June 2, low 6,401.75 on March 31 |
| Distance from extremes | 4.45% below the 52-week high, 14.83% above the 52-week low |
| Swing pivots working back | 7,632.00 on July 16, then 7,524.75, then 7,324.00 |
| Trend state | Short-term down, intermediate neutral to down, long-term up |
| 5-day | 7,431.45, price 60.20 points below |
| 20-day | 7,526.21, price 154.96 points below |
| 50-day | 7,528.75, price 157.50 points below, converged with the 20-day |
| 100-day | 7,269.55, price 101.70 points above |
| 200-day | 7,131.75, price 239.50 points above |
| Year to date average | 7,196.38 |
| Crossings and stalls | 9-day 7,465.94, 18-day 7,521.24, 40-day 7,514.60, 18-day stall 7,591.50, 18 to 40 day crossover 7,309.39, 3 to 10 day crossover stall 7,294.25 |
| Relative strength | 9-day 29.80, 14-day 37.01 down 8.41, 20-day 41.97, 50-day 50.08, 100-day 52.35 |
| Relative strength trigger prices | 14-day reaches 30 at 7,217.64 and 50 at 7,499.84 |
| Stochastics, 14-day | Raw 8.85%, %K 16.57%, %D 17.19% |
| Stochastics, 9-day | Raw 10.86%, %K 17.24%, %D 17.41% |
| Stochastics, 20-day | Raw 8.85%, %K 18.20%, %D 24.39% |
| Stochastics, 100-day | Raw 73.49%, %K 78.93% |
| Directional index, 9-day | 32.31, negative movement 26.21 against positive 7.39 |
| Directional index, 14-day | 23.35, negative movement 24.32 against positive 9.49 |
| Directional index, longer | 20-day 17.19, 50-day 9.54, 100-day 6.50 |
| Multi-indicator composite | 56% sell, average strength, direction strengthening; trend signal sell |
| Composite by horizon | Short term 100% sell, medium term 50% sell with the 20 to 100 day crossover constructive, long term 33% buy on the 100-day average and the 50 to 100 day crossover |
| Composite comparison | Hold yesterday, 40% buy one week ago, 32% buy one month ago |
| Average true range | 14-day 95.73 points or 1.30%, 9-day 96.82, 20-day 95.91, 50-day 94.40 |
| Average daily range | 14-day 88.52 points or 1.20%, 9-day 97.19, 20-day 87.53, 50-day 96.04 |
| Historic volatility | 9-day 11.32%, 14-day 10.60%, 20-day 10.31%, 50-day 13.20%, 100-day 14.23% |
| Implied volatility | At the money 23.59% for Thursday, one month 14.48% against one month realised 9.53% |
| Implied move | About 147 basis points or 108 index points; daily options implied move $67.91 |
| Ranks | Implied volatility rank 26.71%, skew rank 32.14%, variance forecast rank 17.58% |
| Surface shift | Fixed strike implied volatility lifted 0.3 to 1.0 points; volatility index closed 20.63 |
| Realised against priced | Cash index travelled 185 basis points against 72 basis points priced by same-day options |
| Gamma notional | Cash index negative $109.186 million, large-cap fund negative $1.429 billion, technology fund negative $829.538 million, Nasdaq 100 index negative $6.575 million, small-cap index negative $66.077 million, small-cap fund negative $959.888 million |
| Gamma tilt | Cash index 0.993, large-cap fund 0.609, technology fund 0.590 |
| 25-delta risk reversal | Cash index negative 0.062, large-cap fund negative 0.041, Nasdaq 100 negative 0.071 |
| Volume and open interest | Put volume 892.15 thousand against call volume 695.06 thousand, ratio 1.28; put to call open interest 1.27 |
| Aggregate gamma | Call gamma 4.24 billion against put gamma negative 4.05 billion |
| Largest expirations | Gamma August 20, delta February 18, 2027 |
| Cash level map | 7,700 call side barrier, 7,465 volatility inflection, 7,385 gamma flip, 7,300 put side barrier, 7,000 primary concentration; basis 33.45 points |
| Published ladder | Resistance 7,500, 7,525, 7,550, 7,600 cash; support 7,400 and 7,300; pivot 7,450; stability required 7,500 or higher; note dated 17:22 Eastern |
| Dealers and intermediaries | 148,984 long against 881,849 short, short side up 32,158 |
| Leveraged funds | 146,834 long against 469,699 short, short side down 30,757, long side up 11,380 |
| Asset managers | 1,143,723 long against 214,564 short, short side up 10,742 |
| Commercials | 1,387,523 long against 1,494,442 short, short side up 15,620 |
| Microsoft | Adjusted $4.74 against $4.25; revenue $90.01 billion against $87.72 billion; operating income $40.60 billion against $39.02 billion; cloud $59.3 billion against $58.7 billion, fastest growth since 2022; capital expenditure $35.80 billion against $35.22 billion, $41 billion including leases against $42.05 billion; shares up roughly 2% |
| Meta | Missed, narrowed capital expenditure guidance, shares down roughly 11% against a 7% priced move and a roughly 10% four-quarter average |
| Qualcomm | Matched at $2.21 adjusted, revenue $9.95 billion against $9.62 billion, fourth quarter guide $2.05 to $2.25 against $2.35; Chinese handset revenue bottomed in the third quarter |
| Index moves | Broad index down 1.52%, Dow down 2.19%, Nasdaq 100 down 2.06% to a three-month low |
| Semiconductor and infrastructure decliners | Largest memory maker down 9.94%, power and cooling supplier down 17.26%, storage down 7.32%, packaging and test down 6.48%, merchant chip designer down 5.51%, radio frequency supplier down 5.40% |
| Other movers | Airlines down 5.70% and 3.39%, freight down 4.39%; energy exploration and production up 4.64% and 3.89%; design software up 3.32%, human capital software up 5.21%, information services up 2.95% |
| Crude path | September settled 79.26 Tuesday, reversed to 82.68 with an 83.25 high, 84.09 by 08:38 up 6.19%, 85.22 by late morning |
| Path A, constructive resolution | 45%. Core at or below 3.3%, long end eases, defends 7,351.25, clears 7,376.50, works 7,392 to 7,397, tests 7,418.45, extends 7,460 and possibly 7,478; capped short of 7,498 to 7,533 |
| Path B, inflation driven break | 35%. Core or the advance deflator surprises high, 30-year extends above 5.21%, loses 7,351.25 then 7,333.45 then 7,324.00 on a 15-minute close, accelerates into 7,283 to 7,309 with 7,269.55 the objective; a close below opens 7,215 and 7,189 |
| Path C, balance and chop | 20%. Data in line, megacap divergence cancels at the index level, oscillation roughly 7,330 to 7,400, volume fades into Apple and Amazon |
| Low band | 7,300 to 7,325, containing 7,305.70, 7,309.39 and 7,324.00 |
| Mid band, most likely | 7,355 to 7,390, with 7,351.25 just beneath and 7,376.50 and 7,392.08 above |
| High band | 7,415 to 7,435, containing 7,415.66, 7,418.45, 7,430.14 and 7,431.45 |
| Full envelope | Roughly 7,300 to 7,435, about 135 points; blended working expectation 100 to 110 points |
| Primary, long | Entry 7,331 to 7,338 after 09:45 with the data absorbed, stop 7,319, risk 14 to 19 points, targets 7,371, 7,392 and 7,418, roughly 36, 57 and 83 points, ratios 1:2.4, 1:3.8 and 1:5.5 from the 7,334.50 midpoint on 15.5 points of risk |
| Primary invalidation | A 15-minute close below 7,324.00. No long re-entry beneath it |
| Macro override | Core at or above 3.5% year over year, or advance growth price index materially above 4.0%, or 30-year above 5.30%. Stand down on the long regardless of price |
| Conditional, short | Entry 7,415 to 7,422 on the first test into rejection, stop 7,436, risk 14 to 21 points, targets 7,392, 7,371 and 7,351, roughly 26, 47 and 67 points, ratios 1:1.5, 1:2.7 and 1:3.8 from the 7,418.50 midpoint on 17.5 points of risk |
| Conditional invalidation | A 15-minute close above 7,431.45, meaning hedging has inverted to dampening |
| Time rules | No entries before 09:45 and none after 16:00. The opening range is a reaction range, gapped against the 07:59 level |
| Gap invalidations | An open below 7,283 voids both setups, re-map after the opening range. An open above 7,435 voids both at their planned levels, rebuild around 7,460 to 7,483 |
| Chop filter | Price between 7,345 and 7,405 at 10:30 with a contracting range means stand aside |
| Sizing constraint | Half of normal on both setups. Implied volatility of 23.59% against an 88.52 point realised range demands a wider stop and therefore fewer contracts |
See how AlgoIndex turns this kind of level-gated read into systematic signals.
View pricing →


