
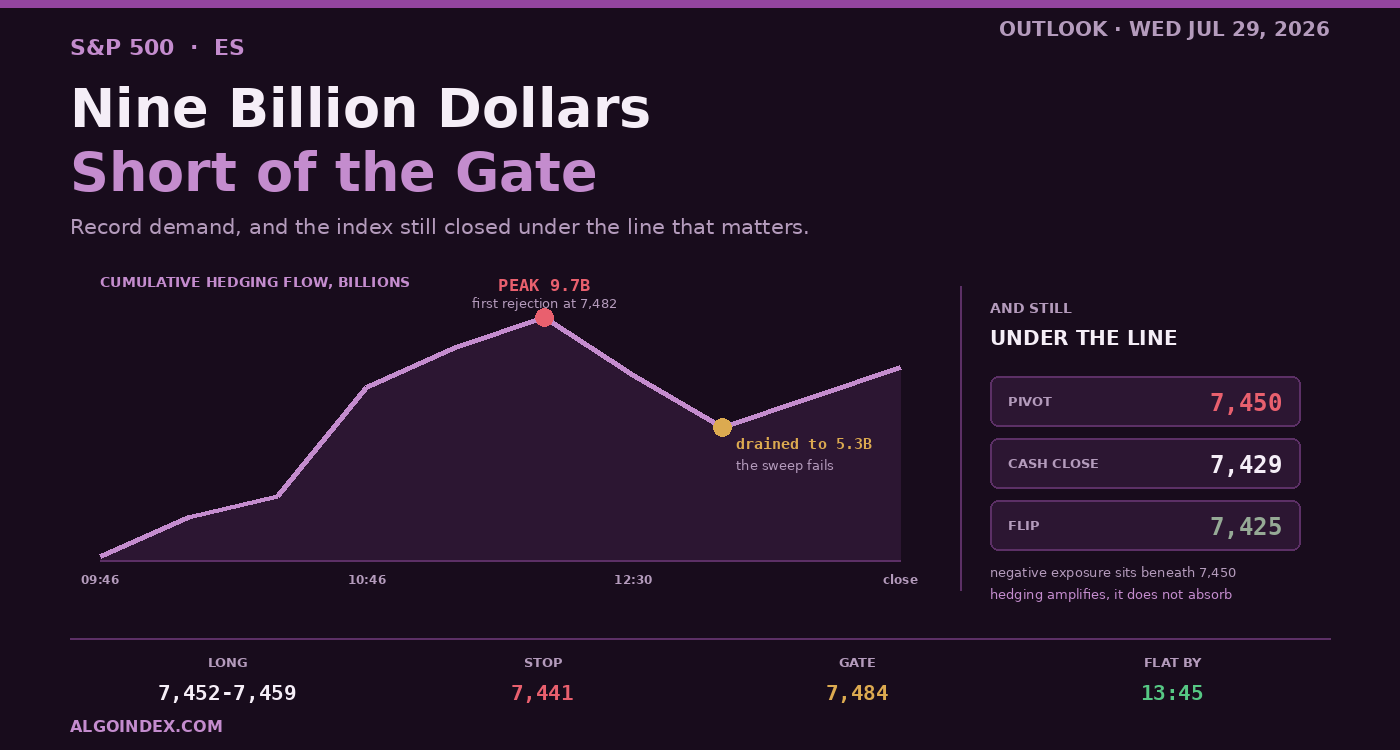
Roughly 9 billion dollars of hedging demand hit the equity index on Tuesday. Across the prior thirty sessions nothing came close. Nearly the whole amount arrived in a two-hour window after the open, and it lifted the market 82 basis points while it lasted. The cash index finished the day at 7,429 anyway, which leaves it under 7,450, the line that separates a constructive environment from a defensive one.
Buying that size, unable to take the pivot back, reads as a warning rather than a confirmation. Going into Wednesday afternoon it is the cleanest fact on the page. Monday night the problem was the same amplifier, eleven points the wrong way. Tuesday threw record money at it and moved twenty.
How Tuesday actually traded
Opening near 7,456, the contract surrendered that area within ninety seconds. This was real sell aggression rather than drift, and the volume delta shows it: a positive fourteen hundred just before the bell, then a reading of negative 585, then lower still. By about 9:40 the low was in at 7,418.
From there the 7,420 handle became the story. Four separate attempts to break it were turned away. A five-point reflex came off the first touch near 7,421, the true low printed on the retest, and each later probe met visible absorption sitting in the resting book. Concealed bids kept appearing in the 7,434 to 7,447 pocket all morning. Meanwhile the flow print was climbing through 139 million, then 1.7 billion, then 2.53 billion on three straight observations, every bit of it building while price sat at the lows. A falling volume delta beside a surging flow reading was the day's sharpest divergence, and it broke upward.
Recovery came in pieces. Mid-morning took back the volume node between 7,442 and 7,438. A little after eleven the supply between 7,455 and 7,457 got eaten. Two large resting offers, one at 7,476 and another just beneath at 7,473.75, capped things briefly, and their removal opened the way to 7,482 by 11:52.
The afternoon taught the most. Three probes turned back. One died at 7,482, the next at 7,481, the third at 7,483, each of them at the leading edge of a stubborn offer around 7,483.75 that grew to nearly twelve hundred lots. Attempt number four, near 13:13, punched through and touched 7,485.75. Minutes later price was back down at 7,474. What remained of the session compressed in a twenty-point pocket, lower highs against higher lows. Settlement printed 7,465.25.
The flow peak came at 11:48 near 9.7 billion. That is within minutes of the first rejection. The drain to 5.3 billion landed at 13:47, which is within minutes of the terminal sweep failing. Money moved first in both directions and price came along afterward.
The rotation underneath
A 0.21 percent gain on the index tells you nothing useful. Blue chips added 1.03 percent while the technology benchmark shed 0.98, and at the intraday extreme the two were 0.85 up against 2.03 down. Chips carried the entire load, their sector proxy off around 5 percent, while healthcare and staples each picked up about 2.
That technology benchmark is now something like 10 percent under the record it set in June, which puts it in correction. A pair of memory names that led the last leg higher are 37 and 55 percent below where they traded a month ago. None of this originates domestically. Korea's benchmark dropped 10 percent overnight and is down near 55 over a month, which has the shape of a forced unwind in artificial-intelligence hardware exposure.
For this contract specifically, the point is that equal-weighted measures came through fine while cap-weighting dragged the headline down. That's rotation, not de-risking. It also argues that on any shock both indices share, this one should fall less.
Why a third of the market disagrees with consensus
Policy sits at 3.75 percent and the consensus call is that it stays. Futures put 32 percent on an increase and the remaining 68 on no change. One chance in three, at a meeting already on the calendar, is not an ordinary distribution, and it explains why Wednesday's expiration went out at 19.25 percent implied while the one-month reading sat at 14.71.
There are real foundations under the hawkish view. At the most recent projection round, half the participants, nine of eighteen, indicated they expect an increase at some point during 2026. The last statement also removed language about further adjustments, and the market took that as an easing bias being deleted rather than a tightening bias being added. Monday brought a circulated note from a large market-making firm making the case outright, and it shifted the discussion.
Pulling the other way, the inflation data has been friendly. Core consumer prices for June came in two basis points negative, and one research desk reckons that maps to something near eighteen basis points on the core personal-consumption measure. Thursday's print is expected at 3.3 percent on the core annual figure versus 3.4 before it. Two-year yields have been easing as the meeting approaches. A market braced for tightening does not behave that way. Set against all that, Tuesday's seven-year auction went off at a 4.473 percent high yield, up from 4.260, on a cover of 2.490, a soft outcome that says appetite for duration is thinning at these levels.
The sequencing risk is the part worth flagging. Hawkish on Wednesday followed by soft inflation on Thursday would whipsaw hard, and not much positioning is built to survive it.
Then the missiles
Around 17:45 Eastern, well after the bell, Revolutionary Guard forces fired multiple ballistic missiles toward American troops in the region, with reports naming a base in Jordan. The military verified the launch, said every missile was intercepted successfully, and noted forces are on high alert. Saudi Arabia downed more drones inside the same window.
Crude flipped instantly. September went from settling at 79.26 to 82.68, up 4.31 percent, printing 83.25 at the top. Equity futures have hardly reacted, sitting near 7,455 and down about a tenth of a percent, which fits a market that has read a clean interception and no reported casualties as a symbolic and contained response.
It still matters, and here is the reasoning. All through the cash session, treating Middle East headlines as background noise was correct, because the asset with the most exposure to that risk kept falling while the headlines got louder. Crude was down about 3.2 percent on the day, helped along by an industry estimate showing inventories built 3.296 million barrels. When the exposed asset drops into the news, the news is not what is driving anything.
That relationship just turned over. Energy is now charging for supply risk it dismissed a few hours earlier. And crude staying up cuts directly against the disinflation trajectory the dovish case rests on, which hands ammunition to the third of the market betting on a hike. Around six o'clock the two big risks of the week stopped being separate variables. That correlation is the best single reason to carry less size.
Where the mechanics leave the market
Cash finished at 7,429. The positioning flip is at 7,425 and the pivot at 7,450, so the close wedged into the gap between them. Underneath 7,450 sits accumulated negative dealer exposure, which means hedging in this particular zone adds to moves instead of absorbing them. Go lower and no mechanical bid shows up until around 7,400. Go higher and nothing of substance pushes back until well past the pivot.
It's an unstable place to be sitting with a one-in-three surprise a day away. The stability read oscillated between 8 and 20 percent through the session, and anything below 20 warns of high amplitude without picking a side. Tuesday then produced 67.75 points of range against a gain of only fifteen, validating the warning to the letter.
One detail cuts the other way and deserves keeping. Exposure on the two tracking proxies was positive, roughly 487 million on one and 555 million on the other, while the cash-index figure was negative near 767 million. That combination generates precisely what Tuesday delivered: quick swings that keep finding a footing at proxy strikes. Should it hold, declines ought to catch support earlier than the raw cash number implies.
The plan
Primary trade is a long and it exists only in the morning. Buy the 7,452 through 7,459 pocket, which spans the computed pivot and the positioning-flip equivalent. Work it toward the upper part rather than the extreme, since every mapped line Tuesday respected got turned one to four points early. Stop goes at 7,441, below the volume node, because anything placed inside that node would have been picked off on noise repeatedly. Objectives are 7,470, then the gate, and 7,500 only if the decision produces continuation.
Flat by 13:45, no exceptions, nothing new opened until the press conference is underway. Against surprise odds near a third and roughly 120 basis points of implied intraday movement, holding through the statement is a bad bet no matter how confident the direction feels.
The conditional short belongs at the gate. Sell 7,481 through 7,486 into rejection with flow decelerating, never into the approach, stop at 7,497, clear of first pivot resistance, working 7,470, then 7,456, then 7,441. Five times that band turned the market on Tuesday, and the terminal sweep stopped within a quarter point of where the map said it would.
The weightings: 35 percent on compression followed by an upside resolution if the tone reads neutral. 30 percent on a hold delivered hawkishly, keeping September explicitly alive. 20 percent on the increase actually arriving. Only 8 percent on a genuinely dovish outcome, and the overnight energy move is what dragged it down there, since expensive crude undermines the very argument that path needs. The last 7 percent covers a geopolitical override, meaning confirmed casualties, a retaliatory strike, or Hormuz transit genuinely interrupted. Under that one, every level here is provisional and sitting out beats trading them.
The pre-open tells are simple enough. Crude steady above 82 with the contract holding 7,440 says the escalation is priced as contained and this plan survives intact. Crude pushing toward 85 with equities following says geopolitics has taken the wheel and these levels turn provisional. Separately, a bad miss from the staples bellwether at seven in the morning removes the rotation cushion quietly protecting this index right now, and the long loses the structure holding it up.
A final word on the close. Two of the largest constituents report within minutes of it, carrying implied moves of 6 and 7 percent, and one of those is priced under its own four-quarter average. Whatever you hold into the settlement, you also hold into those. Wednesday is not one event. It is three of them stacked inside a couple of hours.
The complete data picture
Every number behind Wednesday’s plan, charted first; the full numeric reference follows underneath.
Full numeric reference , every remaining figure from the review
| September settlement | 7,465.25, up roughly 18 points |
| Cash index close | 7,429, up 0.21 percent |
| Open / low / high | approximately 7,456 / 7,418 / 7,485.75 |
| Range | 67.75 points |
| Settlement position in the range | roughly the 70th percentile |
| Daily candle wicks | lower roughly 38 points, upper roughly 20, body a 9-point advance |
| Volume delta at the open | positive 1,400 at 09:20, then negative 585 |
| First structural test | 7,449, where stacked resting bids absorbed the initial probe |
| Base tests | the 7,420 area held on four separate attempts |
| Reclaim waypoint | 7,462 on the way through the supply band |
| Hidden bid interest | repeatedly detected between 7,434 and 7,447 |
| Capping offers | 7,473.75 and 7,476, then a reinforced offer near 7,483.75 at nearly 1,200 lots |
| First high / terminal sweep | 7,482 near 11:52 / 7,485.75 near 13:13 |
| Afternoon consolidation | 7,455 to 7,474, closing near 7,461 |
| Globex reopen | 7,457.25 to 7,474.00, near 7,455 |
| Monday cash close / range | 7,413.18 / 7,382.74 to 7,480.15 |
| Working basis | approximately 34 points, 33 at midday, roughly 36 at settlement |
| Weekly bar | opened 7,490.00, high 7,524.75, low 7,416.25, now 9 points below the open |
| Five days | down 80.50 points, or 1.07 percent, from 7,545.75 |
| Five-day high / low | 7,563.50 on July 22 / 7,411.75 on July 23 |
| One month | up 63.50 points, or 0.86 percent |
| Three months | up 239.25 points, or 3.31 percent |
| Year to date | up 472.25 points, or 6.75 percent |
| Monthly high | 7,632.00 on July 16 |
| 52-week high / low | 7,693.75, 2.97 percent above / 6,401.75, 16.61 percent below |
| Swing sequence | lower highs 7,632.00, then 7,563.50, then 7,485.75; lows 7,411.75 then 7,418 |
| Retracement references | 38.2 percent off the four-week low at 7,487.39, 50 percent of the four-week span at 7,515.00, 50 percent of the 13-week span at 7,440.38 |
| 5-day | 7,469.25, four points above the settlement |
| 20-day | 7,536.06, roughly 71 points above |
| 50-day | 7,531.54, roughly 66 points above |
| 100-day | 7,264.48, roughly 201 points below |
| 200-day | 7,128.76, roughly 337 points below |
| Projected crossings | 9-day 7,484.25, 18-day 7,535.37, 40-day 7,523.18 |
| Relative strength, 9 / 14 / 20 / 50-day | 42.11 / 45.42 / 48.06 / 52.68 |
| Price for a 14-day reading of 50 | 7,511.27 |
| Raw 14-3 stochastic | 24.29 percent, %K 19.03, %D 20.02 |
| 9-day and 20-day %K | 19.03 and 26.20 |
| Directional index, 9-day | 29.35, positive 9.27, negative 19.50 |
| Directional index, 14-day | 21.77, positive 10.94, negative 20.02 |
| Directional index, 20-day | 16.31 |
| Composite | neutral overall with falling short-term direction |
| Composite components | short term negative 20, medium term negative 25, long term positive 67 |
| Composite history | prior session negative 8, one week ago positive 40, one month ago positive 8 |
| Average true range, 14-day | 89.48 points, or 1.20 percent |
| Average true range, 9 / 20 / 50-day | 86.79 / 91.64 / 92.71 points |
| Average daily range, 14 / 9 / 20-day | 81.50 / 86.83 / 82.97 points |
| Historic volatility, 9 / 14 / 20-day | 9.45 / 9.75 / 9.29 percent |
| Historic volatility, 50-day | 13.05 percent |
| One-month implied / realised | 14.71 / 10.38 percent, a premium near 4.3 points |
| Implied volatility rank | 28.17 percent |
| Options-implied one-day move | approximately 68.82 points |
| Wednesday expiration implied volatility | 19.25 percent, roughly 120 basis points or 89 index points |
| Thursday expiration | 19.45 percent, roughly 122 basis points |
| Volatility index / volatility-of-volatility | 18.20, having reached 19.17 / 98.5 |
| One-range projection | 7,376 to 7,555, with the implied-move method giving 7,376 to 7,554 |
| The decision gate | 7,484 to 7,492 (7,450 to 7,458) |
| Components | positioning divide 7,450 cash, concentration ceiling 7,455 cash, Tuesday's 7,485.75 high, the 9-day crossing at 7,484.25, retracement at 7,487.39 |
| First clear air | 7,495 to 7,506 (7,461 to 7,472), holding 7,495.00, 7,500.17 and 7,505.74 |
| Third deviation | 7,520 |
| Structural ceiling | 7,511 to 7,525 (7,477 to 7,491), holding 7,511.27, 7,515.00, 7,522.52, 7,523.18 and 7,524.75 |
| Trend repair band | 7,528 to 7,537 (7,494 to 7,503), holding 7,535.37, 7,535.39 and the mapped 7,534 |
| Weekly objective | 7,559 to 7,564 (7,525 to 7,530), holding 7,563.75 and last week's 7,563.50 |
| Extended | 7,584 to 7,634, with the primary call concentration at 7,600 cash |
| Not in play | 7,693.75 (7,660 cash) |
| Immediate base | 7,455 to 7,461 (7,421 to 7,427), holding the pivot at 7,456.00 and the positioning flip equivalent near 7,459 |
| Heaviest volume node | 7,438 to 7,442 (7,404 to 7,408) |
| Next band | 7,424 to 7,434, holding 7,426.25 and 7,424.76 with the mapped 7,434 |
| The demonstrated base | 7,416 to 7,422 (7,382 to 7,388), holding Tuesday's 7,418 low and the 7,416.25 weekly low |
| Deeper | 7,395 to 7,408 (7,361 to 7,374), holding 7,407.98, the 7,398.00 monthly low and 7,395.11 |
| Measured objectives | 7,387 (7,353), then 7,357 to 7,366 (7,323 to 7,332) with third pivot support at 7,357.50 |
| Structural base | 7,334, the primary put concentration at 7,300 cash |
| Headline delta notional | approximately positive 9 billion dollars, strongest of the prior 30 sessions |
| Timing | almost entirely between 09:30 and 11:30, driving an 82 basis point advance |
| Decomposition | roughly 5 billion from same-day put selling, roughly 4 billion from longer-dated call buying, plus 1.4 billion single-stock |
| Intraday track | 139 million at 09:46, 1.7 billion at 10:14, 2.53 billion at 10:31, 6.9 billion at 10:46, 8.5 billion at 11:20, peak near 9.7 billion at 11:48 |
| Drain and recovery | roughly 5.3 billion by 13:47, recovering toward 7.7 billion into settlement |
| Mapped pivot | 7,450 cash, approximately 7,484 futures |
| Mapped resistance | 7,500, 7,525, 7,550 and 7,600 cash |
| Mapped support | 7,400 and 7,300 cash |
| Concentration ceiling | 7,455 cash, approximately 7,489 futures |
| Positioning flip | 7,425 cash, approximately 7,459 futures |
| Stability readings | 12 percent pre-market, 8 mid-morning, 11 at eleven, 13 midday, 16 late morning, 20 by noon, easing to 15 in the afternoon |
| Structural support detail | a 7,000-lot same-day put position around 7,390 cash, partially closed after 14:00 |
| Proxy exposure split | index-tracking approximately positive 487 million, technology-tracking positive 555 million, cash index negative 767 million |
| Options volume | 615,870 calls against 739,350 puts |
| Open-interest ratio | 1.27 |
| Dealer exposure | call side 2.92 billion, put side negative 2.99 billion |
| Top expirations | exposure August 20, delta February 2027 |
| Institutional working range | sold puts at the 733 proxy strike near 7,385 futures, at-the-money protection at 740 closed near 7,455 |
| Non-commercial | long 256,150, short 272,934, short side reduced 22,439 |
| Leveraged funds | long 146,834 up 11,380, short 469,699 down 30,757 |
| Asset managers | long 1,143,723, short 214,564, adding 10,742 shorts |
| Dealers and intermediaries | long 148,984, short 881,849, adding 32,158 shorts |
| Dow / S&P 500 / Nasdaq 100 | up 1.03 percent / up 0.21 percent / down 0.98 percent |
| Intraday extreme | Dow up 0.85 percent against Nasdaq 100 down 2.03 percent |
| Semiconductors | sector proxy off approximately 5 percent |
| Healthcare / consumer staples | each up roughly 2 percent |
| Nasdaq 100 from its June record | roughly 10 percent below |
| Memory complex leaders | down 37 percent and 55 percent from last month's highs |
| Korean benchmark | down 10 percent overnight, roughly 55 percent over one month |
| Small-cap proxy | dealer exposure in the second percentile, puts concentrated 283 to 290 |
| Crude during the cash session | down roughly 3.2 percent, five-day change negative 6.02 percent |
| Industry inventory estimate | a build of 3.296 million barrels against an expected draw |
| Policy rate | 3.75 percent, consensus unchanged |
| Futures pricing | 68 percent hold against 32 percent increase |
| Projection round | nine of eighteen participants signalled an increase during 2026 |
| Seven-year auction | 4.473 percent against 4.260 percent prior, cover 2.490 against 2.500 |
| June core consumer prices | negative two basis points |
| Expected core translation | roughly eighteen basis points on core personal consumption |
| Thursday core inflation forecast | 3.3 percent year over year against 3.4 percent prior |
| Tuesday results | aerospace, beverage and coatings names beat and were supportive |
| Card payments processor | adjusted 3.32 dollars against 3.23 expected, revenue 11.6 billion against 11.4 billion, transactions 71.7 billion against 71.17 billion |
| Legacy automaker | adjusted 0.42 dollars against 0.36 expected, commercial operating profit 1.72 billion, combustion 1.14 billion against 792.7 million, electric revenue 1.0 billion against 1.31 billion expected |
| Wednesday pre-open | consumer staples bellwether, 1.41 dollars on 21.34 billion |
| Wednesday after the close | 9.11 dollars on 60.23 billion, 2.21 dollars on 9.63 billion, 0.65 dollars on 9.16 billion, 4.25 dollars on 87.72 billion |
| Implied moves | 12 percent, 10 percent, 9 percent, 7 percent and 6 percent across the reporters |
| Underpricing note | the 7 percent name sits below its own four-quarter average realised move of roughly 10 percent |
| Time | 17:45 ET, after the cash close |
| Event | multiple ballistic missiles launched at United States troops, reporting indicates a base in Jordan |
| Outcome | all missiles reported effectively intercepted, forces at high readiness |
| Crude reaction | from a 79.26 settlement to 82.68, a gain of 4.31 percent, high 83.25, low 79.92 |
| Equity reaction | E-mini near 7,455, down roughly 0.13 percent |
| Additional items | Saudi air defences downed further drones; a tanker reported turned back |
| Trade channel | confirmed bans on new Chinese robotics and power inverters |
| Entry zone | 7,452 to 7,459 futures (7,418 to 7,425 cash), worked at the upper portion |
| Stop | 7,441 (7,407 cash) |
| Target 1 | 7,470 (7,436 cash) |
| Target 2 | 7,484 (7,450 cash) |
| Target 3 | 7,500 (7,466 cash), post-decision only |
| Reward | approximately 1:1, 1:2.0 and 1:3.1 from a 7,455.50 midpoint |
| Invalidation | fifteen-minute acceptance beneath 7,438 with cash sustaining under 7,404 |
| Time rule | all positions closed by 13:45, nothing new between 13:45 and 14:30 |
| Entry zone | 7,481 to 7,486 (7,447 to 7,452 cash), on rejection with decelerating flow |
| Stop | 7,497 (7,463 cash) |
| Targets | 7,470, then 7,456, then 7,441 |
| Reward | approximately 1:1.1, 1:2.2 and 1:3.3 from a 7,483.50 midpoint |
| Invalidation | fifteen-minute acceptance above 7,492 with cash holding over 7,458 |
| Compression then upside resolution | 35 percent, close 7,480 to 7,510, plus 0.3 to 0.6 percent |
| Hold with hawkish tone | 30 percent, close 7,410 to 7,440, minus 0.4 to 0.8 percent |
| The increase lands | 20 percent, close 7,380 to 7,420, minus 0.7 to 1.3 percent |
| Dovish resolution | 8 percent, close 7,510 to 7,535, plus 0.7 to 1.0 percent |
| Geopolitical override | 7 percent, close beneath 7,400 with 7,387 and 7,357 to 7,366 as objectives |
| Low-range scenario | 7,442 to 7,492, approximately 50 points |
| Mid-range scenario | 7,420 to 7,510, approximately 90 points |
| High-range scenario | 7,380 to 7,535, approximately 155 points |
| Overnight base case | 7,435 to 7,485, extending to 7,395 if the escalation is not contained |
| Gap without structure | more than 40 points in either direction overnight |
| No auction | an opening range inside a five-point band |
| Time rules | before 09:45 or after 13:45 |
| Escalation triggers | confirmed casualties, an announced retaliatory strike, or an actual interruption to Hormuz transit |
| Energy trigger | crude extending through 85 |
| Flow instability | hedging flow swinging more than 2 billion dollars within a single hour |
| Standing limit | half size is the maximum appropriate exposure even if every condition is clear |
| 21:30 Tuesday | Australian quarterly inflation, headline 0.7 percent against 1.4 percent prior, trimmed mean 0.9 percent quarterly and 3.7 percent annually against 3.5 percent |
| 04:00 | Euro-area wage tracker |
| 04:30 | UK credit data, consumer credit 1.7 billion, mortgage lending 3.9 billion, approvals 57,100 |
| 07:00 | Consumer staples bellwether, 1.41 dollars on 21.34 billion |
| 10:30 | Crude inventories, a build of 1.0 million forecast against 2.010 million prior |
| 13:30 | Canadian central-bank minutes |
| 14:00 | Rate statement and decision, 3.75 percent forecast |
| 14:30 | Press conference |
| 16:00 to 16:10 | Four large-cap reports after the close |
| Thursday 08:30 | Advance growth and core inflation, 3.3 percent forecast against 3.4 percent prior |
Follow-up: the decision landed with three dissents and the long end took over. Read the Thursday July 30 S&P 500 outlook.



