
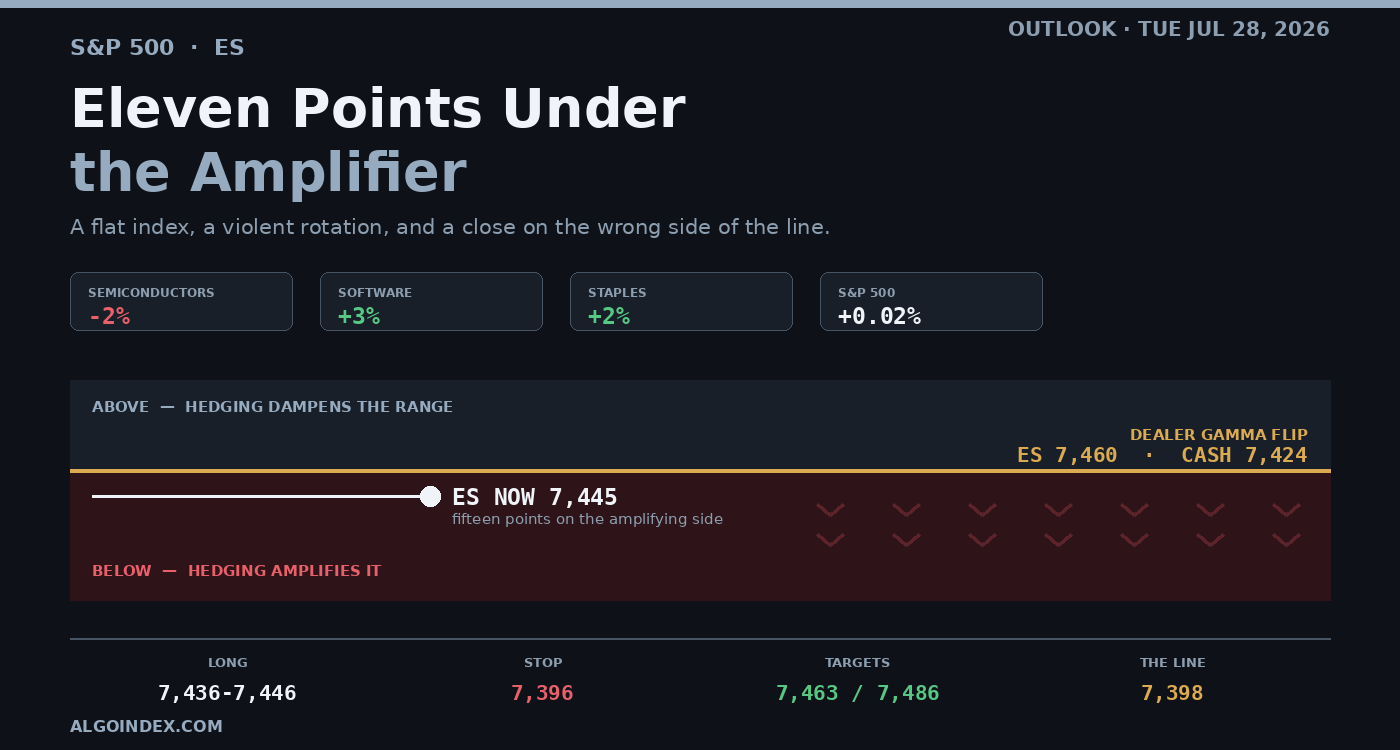
Monday closed the September E-mini out at 7,448.25, a two-hundredths-of-a-percent gain and not a tick more. That number doesn't describe what actually happened underneath it. Chipmakers dropped near 2 percent while software climbed near 3 and staples added 2. The blue-chip average finished 0.51 percent higher at a one-week peak while the tech benchmark closed 0.32 percent lower at its worst level in two and a half months. Nobody withdrew money from equities on Monday. They just moved it somewhere else in the building. Friday's note called it a flat surface sitting over a rotation. Monday ran the same script with the volume turned up.
Geopolitics started it. A third straight day passed without strikes between Washington and Tehran, crude broke more than 7 percent intraday on the easing, and futures opened firm on the headline the way they usually do when energy costs drop. What blunted it was a separate worry with nothing to do with Iran: investors are increasingly uneasy about how much capital the largest artificial-intelligence infrastructure buyers are committing. Money left the chip complex and the hardware around it, went into beaten-down software, and the broad index couldn't do anything but sit between the two.
The number that makes Tuesday dangerous
Forget the settlement for a moment. The cash index finished at 7,413. Dealer hedging changes character at 7,424. Eleven points. That is the entire distance between a market where hedging flows suppress movement and one where they add to it.
The same boundary lands at 7,459.88 in the September contract, with the future near 7,445 overnight, some fifteen points underneath. Tuesday therefore begins where hedging amplifies, on the far side of the most consequential structural line here. Positioning confirms it: the gamma index reads negative 1.421 and notional negative 286 million, and desks placed the short-gamma build specifically under cash 7,450. The close was inside that build.
What that means in practice is simple enough. When hedgers are short gamma under a level, they sell more as price falls and buy more as it rises. Declines then run longer and quicker than the last few weeks of very tame realised volatility would have you believe. What the market just did is a poor guide to what it does next.
Both sides of that contradiction, with numbers
The heavy side. Price closed under its 5-day, 20-day and 50-day averages. Trend strength on the 9-day window reads 29.35, its negative direction line printing 21.15 against a positive line of only 10.06, better than two to one. The multi-indicator composite prints 8 percent sell, and the deterioration has been quick: the same composite read 40 percent buy a week ago. The 20-day and 50-day have merged into a ceiling spanning 7,531 up to 7,535. Projected crossings for the 9-day, 18-day and 40-day windows sit near 7,498, near 7,539 and near 7,529. All three are above Tuesday's plausible range, which is a numerical way of saying one session cannot repair this.
The washed-out side. Raw stochastic readings on the 9-day, 14-day and 20-day windows all print 17.71 percent, with the fast line at 16.84. That is genuinely depleted. One-month implied volatility sits at 14.72 percent against realised of 10.39, a spread better than four points, so options look dear next to what has actually been delivered even though an implied rank of 28.26 percent makes them cheap outright. Options machinery is stacked underneath: named support at the cash 7,400 equivalent becomes 7,436 on the futures side, sitting directly below spot.
And the flow reading cuts against the price action. Index-level hedging closed Monday around positive 5 billion in cumulative delta, roughly 3 billion of it from same-day put selling. Supportive, and it explains why Monday never broke despite what the biggest names were doing. Single-name flow told the opposite story at roughly negative 1 billion, mostly longer-dated call selling. Supportive at the index, distributive underneath it. One session, two directions, which is the whole session in a sentence.
The shock absorber that held
One detail from Monday deserves attention because it will likely repeat. One cash-index put spread, 7,385 by 7,380 and roughly nine thousand lots, soaked up supply every time the index pushed into it. Price stalled around those strikes and consolidated instead of accelerating through. That is dealer hedging demand doing its job, and it is why a session with that much weakness in its largest components produced no downside momentum at all.
The strike map says the pattern has room to continue. Concentrations beneath the market are dense, with high-confidence readings running 7,397 and 7,375, then 7,353, then 7,323, then 7,301 at the bottom. Above the market they thin out badly. The nearest meaningful level is 7,449, and after that essentially nothing until 7,553. That asymmetry runs both ways. Declines meet absorption. Anything that takes out cash 7,449 has very little standing in front of it.
Levels for Tuesday
Overhead the shelf is unusually well defined. The gamma flip equivalent sits at 7,460, the session pivot three points above it at 7,463, and a 5-day average of 7,466.35 on top of that, three independent measures inside six points. A market that opens under that shelf and can't take it back has confirmed Monday. Above it, 7,486 marks the risk decision level, flagged bearish underneath and bullish over it, and cash closed 37 points shy. Reclaiming it is the least this market has to do before you'd call the short-term damage repaired.
Beneath, the base is 7,444 from the overnight low and 7,436 at the lower gamma shelf, eight points deep and the natural first place for bids. The number that actually matters is lower. First computed support at 7,401 sits under four points away from June 29's monthly low of 7,398, and that pairing builds a defended pocket whose failure would be real rather than cosmetic. Below it, genuine absorption does not turn up again until the 7,336 equivalent, which leaves about 60 points of thin air in between.
The trade
The primary setup is a long from support. Buy the 7,436 through 7,446 zone, preferably its lower half, nothing before 09:45, stop at 7,396 beneath the computed support and the monthly low. Targets are 7,463, then 7,486, then 7,501. Risk from a 7,441 fill is 45 points and the three objectives return 22, 45 and 60, so the profile only works if you actually take partial size off at the first. Carrying full size to the third target isn't what this structure supports.
The conditional short needs acceptance under 7,398, meaning two consecutive 30-minute closes, ideally after 10:15 so the confidence release is behind you. Sell the 7,390 through 7,398 pocket on a retest from underneath, stop 7,424, working toward 7,377, then 7,355, then 7,336. That trade exists precisely because of the short-gamma build described above.
Weighting the outcomes: a range with an upward lean, holding 7,436 and reclaiming 7,463 without clearing 7,486, carries 45 percent. Downside resolution through 7,436 into that 7,401 and 7,398 pocket runs 30 percent. An upside break through 7,486 toward 7,501 and 7,510, which lines up with a published desk view hunting a short-dated technology rally, takes the remaining 25 percent.
What can break it
Three things. Consumer confidence at 10:00, forecast 92.4 against 91.2, is the only first-order scheduled item and it lands fifteen minutes after entries become permissible. With nothing else competing, it will carry more weight than the release normally deserves. The 11:00 meeting on Iran can shift crude hard, and crude has served as the main channel into equities for three sessions running. And the 7-year auction at 13:00 follows two soft results on Monday, where the 2-year cleared 4.315 percent against 4.189 previously and the 5-year cleared 4.408 against 4.200 with its cover ratio slipping to 2.280.
Behind all of it sits Wednesday. Companies worth about 34 percent of the index deliver results across this week, and options are charging roughly 2.6 percent for the whole of it. The policy decision lands Wednesday at 14:00 with consensus for a hold at 3.75 percent, but market pricing carries something near a 40 percent chance of a hike, which is an unusual configuration and a large part of why Monday rotated instead of committing.
The honest read is that dispersion is extreme and the index is pinned. In that environment a directional bet on the index is poorly paid and a level-based tactical trade is well paid. Monday demonstrated it for six and a half hours. There is no obvious reason Tuesday behaves differently until something forces it to.
The complete data picture
Every number behind Tuesday’s plan, charted first; the full numeric reference follows underneath.
Full numeric reference , every remaining figure from the review
| September settlement | 7,448.25, a gain of roughly 0.02 percent |
| Cash index close | 7,413 |
| Basis | approximately 35 points |
| Volatility close | 18.68, with the volatility-of-volatility measure at 100.91 |
| Absorbing structure | a cash put spread at 7,385 by 7,380, on the order of 9,000 lots |
| Globex reopen | open 7,453.00, high 7,456.00, low 7,444.00, near 7,445 on roughly 5,000 contracts |
| Reopen 30-minute period | open 7,444.75, high 7,448.50, low 7,444.50, close 7,445.50 |
| Overnight band | 12 points |
| Contract high | 7,693.75 on June 2, price 3.16 percent beneath |
| One-month range | 7,398.00 on June 29 to 7,632.00 on July 16 |
| Position in that range | lower third, roughly 20 percent measured from the low |
| Five sessions | down 95.00 points, or 1.26 percent |
| Five-day range | 7,411.75 on July 23 to 7,563.50 on July 22 |
| One month | up 49.00 points, or 0.66 percent |
| Three months | up 224.75 points, or 3.11 percent |
| Year to date | up 457.75 points, or 6.55 percent |
| Recent structure | new five-day lows twice in five sessions, a new one-month low once |
| Swing sequence | lower high near 7,563 from July 22, nearest untested low 7,411.75 |
| 5-day | 7,466.35, price below |
| 20-day | 7,535.34, price roughly 89 points below |
| 50-day | 7,531.25, price roughly 85 points below |
| 100-day | 7,264.33, price roughly 182 points above |
| 200-day | 7,128.68, price roughly 317 points above |
| Year-to-date | 7,195.19, price roughly 251 points above |
| Projected 9-day crossing | approximately 7,498 |
| Projected 18-day crossing | approximately 7,539 |
| Projected 40-day crossing | approximately 7,529 |
| 9-day and 14-day | raw 17.71 percent, %K 16.84 percent, %D 19.11 to 19.29 percent |
| 20-day | raw 17.71 percent, %K 24.01 percent, %D 32.19 percent |
| 50-day | raw 39.48 percent |
| 100-day | raw 81.19 percent |
| 14-day relative strength | 43.91, up 0.27 on the session |
| Price for a 50 reading | 7,514.81 |
| Price for a 30 reading | 7,210.19 |
| Price for a 70 reading | 7,908.19 |
| 9-day | trend 29.35, positive 10.06, negative 21.15 |
| 14-day | trend 21.77 |
| 20-day | trend 16.31 |
| 50-day | trend 9.40 |
| 100-day | trend 6.50 |
| Overall | 8 percent sell, trend signal hold |
| Short-term group | 40 percent sell |
| Medium-term group | 25 percent sell |
| Long-term group | 67 percent buy |
| Prior session | 8 percent sell |
| One week ago | 40 percent buy |
| One month ago | 8 percent buy |
| Average true range, 9-day | 80.02 points, or 1.07 percent |
| Average true range, 14-day | 85.12 points, or 1.14 percent |
| Average true range, 20-day | 88.59 points, or 1.19 percent |
| Average true range, 50-day | 91.49 points, or 1.23 percent |
| Average true range, 100-day | 83.78 points, or 1.12 percent |
| Average daily range, 14-day | 76.96 points, or 1.03 percent |
| Average daily range, 9-day | 79.78 points |
| Historic volatility, 9 / 14 / 20-day | 9.20 / 9.68 / 9.25 percent |
| Historic volatility, 50 / 100-day | 13.03 / 14.17 percent |
| One-range band, 14-day basis | roughly 7,363 to 7,533 |
| One-range band, 9-day basis | roughly 7,371 to 7,525 |
| One-month implied volatility | 14.72 percent |
| One-month realised volatility | 10.39 percent |
| Implied volatility rank | 28.26 percent |
| Fixed-strike implied volatility | this week's expirations up roughly 2.5 to 4 points on the session |
| First barrier | 7,456, the overnight high |
| Dealer gamma flip | 7,460, cash 7,424 |
| Computed pivot | 7,463 |
| 5-day average | 7,466.35 |
| Risk decision level | 7,486, cash 7,450, bearish beneath and bullish above |
| Dense band | 7,489.61, 7,498.31, 7,506.75 |
| Volatility inflection | 7,501, cash 7,465 |
| Computed resistance points | 7,510, then 7,572, then 7,618 |
| Third deviation | 7,520 |
| Crossing projections | 7,529 and 7,539 |
| Average convergence ceiling | 7,531 to 7,535 |
| Upper gamma shelves | 7,536 cash 7,500, then 7,636 cash 7,600 |
| Named strike equivalents | 7,561 cash 7,525, 7,586 cash 7,550 |
| One-month high | 7,632 |
| 52-week and 13-week high | 7,693.75 |
| Immediate base | 7,444 overnight low, 7,436 cash 7,400 lower gamma shelf |
| Projected target price | 7,424 |
| First deviation support | 7,407 |
| First computed support | 7,401, precisely 7,401.42 |
| One-month low | 7,398.00, set June 29 |
| Second deviation support | 7,390 |
| 38.2 percent off the 13-week low | 7,381 |
| Third deviation support | 7,377 |
| Second computed support | 7,355 |
| Principal lower gamma | 7,336, cash 7,300 |
| Third computed support | 7,293 |
| Momentum and retracement references | 7,210 for a 30 reading, 7,200 at 61.8 percent off the 52-week low |
| 13-week low | 7,187 |
| 52-week low | 6,401.75, noted for completeness |
| Gamma index | negative 1.421 |
| Gamma notional | negative 286 million dollars |
| Gamma tilt | 0.873 |
| Put open interest | 12.533 million contracts |
| Call open interest | 9.342 million contracts |
| Monday volume | 917 thousand puts against 645 thousand calls |
| Put-to-call open interest | 1.27 |
| 25-delta risk reversal | negative 0.061 |
| Call gamma / put gamma | 4.21 billion / negative 3.34 billion |
| Index-level hedging flow | approximately positive 5 billion dollars of cumulative delta |
| Driver | roughly 3 billion dollars of same-day put selling |
| Constituent hedging flow | approximately negative 1 billion, mostly longer-dated call selling |
| Implied one-day move | 0.63 percent, a band of roughly 7,401 to 7,495 |
| Implied five-day move | 1.62 percent |
| Weekly implied move on the index | approximately 2.6 percent |
| Strike concentrations beneath | 7,397, 7,375, 7,353, 7,323, 7,301 |
| Strike concentrations above | 7,449, 7,553, 7,597 |
| Named strikes | 7,000, 7,500, 7,600, 8,000 |
| Structural map, cash and future | flip 7,424 / 7,459.88, inflection 7,465 / 7,500.88, upper gamma 7,600 / 7,635.88, lower gamma 7,300 / 7,335.88, primary strike 7,000 / 7,035.88 |
| Published desk view | a short-dated technology rally toward 705 on the fund proxy via call butterflies, not valid beyond July 30, with risk-off beneath cash 7,450 |
| Source timing | evening note published Monday July 27 at 5:13 PM ET |
| Policy rate | 3.75 percent, consensus unchanged, implied hike odds roughly 40 percent |
| Two-year auction | 4.315 percent against 4.189 percent prior, cover 2.660 against 2.640 |
| Five-year auction | 4.408 percent against 4.200 percent prior, cover 2.280 against 2.350 |
| Seven-year, prior auction | 4.260 percent, cover 2.500 |
| US durable goods | 0.3 percent against 1.8 percent forecast |
| US core durable goods | 0.6 percent against 0.8 percent forecast |
| Domestic crude | near 82.20 to 82.30 |
| International crude | holding above 93 dollars after falling roughly 7 percent intraday |
| Gold | near 4,074, down approximately 0.2 percent |
| Share of index capitalisation reporting this week | approximately 34 percent |
| Semiconductors | down approximately 2 percent |
| Software | up approximately 3 percent, several large names 6 to 7 percent |
| Consumer staples | up approximately 2 percent |
| Blue-chip average | up 0.51 percent at a one-week high |
| Technology benchmark | down 0.32 percent at a two and a half month low |
| Standout software move | a breakout on approximately 80 million dollars of hedging flow delta, its strongest in thirty days |
| Standout decline | a memory and storage name down 11 percent |
| Entry zone | 7,436 to 7,446, lower half preferred, not before 09:45 |
| Stop | 7,396 |
| Target 1 | 7,463 |
| Target 2 | 7,486 |
| Target 3 | 7,501, with 7,510 above |
| Risk from a 7,441 entry | 45 points |
| Reward | 22 points, 45 points and 60 points, approximately 1:0.5, 1:1 and 1:1.3 |
| Invalidation | acceptance below 7,398, two consecutive 30-minute closes |
| Trigger | acceptance beneath 7,398, ideally after 10:15 |
| Entry zone | 7,390 to 7,398 on a retest from beneath |
| Stop | 7,424 |
| Targets | 7,377, then 7,355, then 7,336 |
| Range with upward bias | 45 percent, close between 7,455 and 7,480 |
| Downside resolution | 30 percent, close between 7,395 and 7,420 |
| Upside breakout | 25 percent, close above 7,490 |
| High band | 7,486 to 7,500 |
| Mid band, most likely | 7,436 to 7,466, a 30-point corridor |
| Low band | 7,398 to 7,410 |
| Session range expectation | 30 to 45 points |
| Most-likely path detail | an early test of 7,460 to 7,466 from beneath, rotation back toward 7,440, then a defence of the 7,436 gamma support |
| No edge | the market opens inside 7,455 to 7,465 and oscillates there through the morning |
| Headline gap | a Middle East headline gapping more than 25 points, allow thirty minutes |
| Event-driven session | the 10:00 release producing an immediate move beyond 40 points |
| Session rules | no entries before 09:45 or after 16:00 |
| 02:45 | French consumer confidence, forecast 85, prior 84 |
| 06:00 / 06:55 / 07:30 | Parcel, beverage and aerospace quarterly earnings, before the open |
| 09:00 | Case-Shiller twenty-city, forecast 1.3 percent, prior 1.1 percent |
| 10:00 | Consumer confidence, forecast 92.4, prior 91.2, the first-order event |
| 11:00 | Meeting on Iran, tentative |
| 13:00 | Seven-year note auction |
| 16:05 | Automotive and payments quarterly earnings, after the close |
| 21:30 | Australian inflation, trimmed mean 3.7 percent forecast against 3.5 percent prior |
| Wednesday 14:00 | Rate decision, forecast 3.75 percent unchanged, press conference 14:30 |
| Wednesday after the close | Four large technology and consumer names |
| Thursday 07:00 | Bank of England decision |
| Thursday 08:30 | Advance growth, core inflation prices and jobless claims |
| Thursday after the close | The largest hardware name, with a further mega-cap Friday |
| Overnight Thursday | Bank of Japan decision |



