
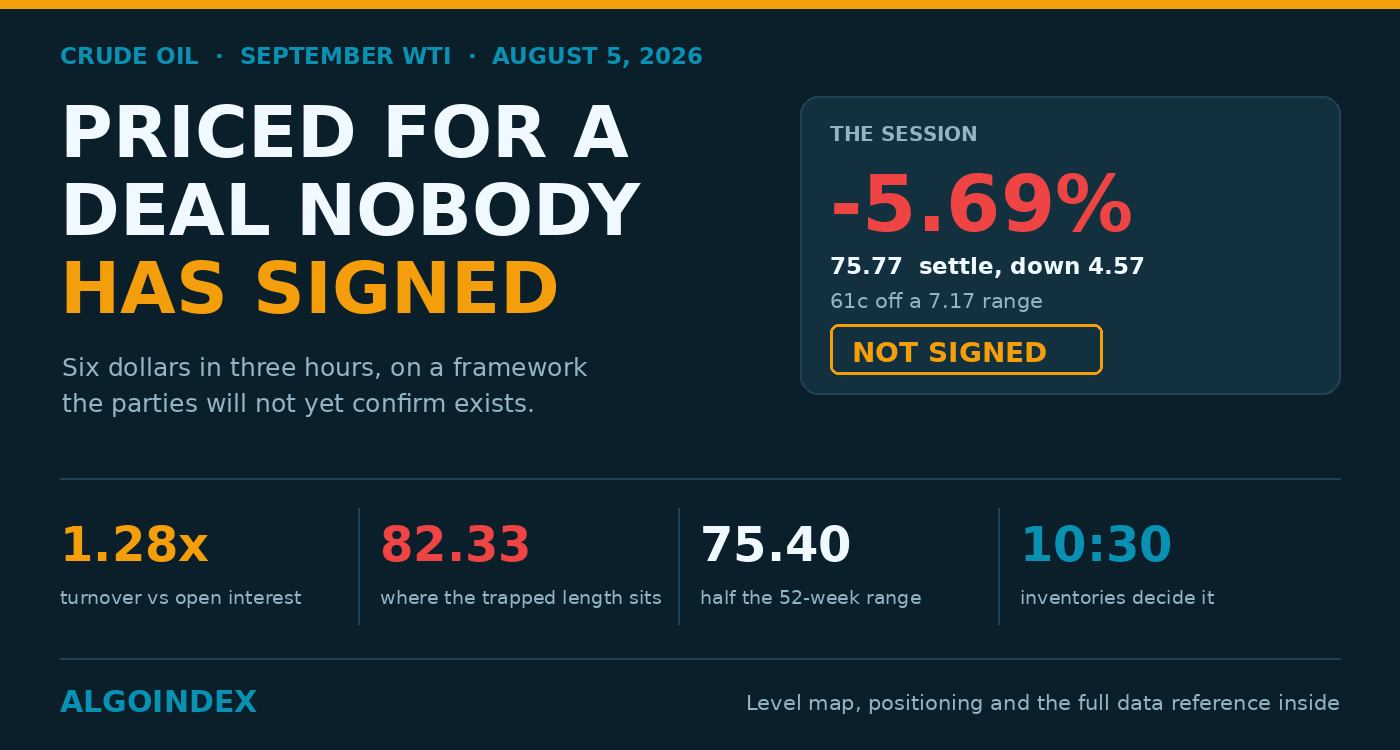
Crude gave up 4.57 dollars on Tuesday, settling 75.77, its worst two-day stretch in weeks and its lowest close in three. It did so on the strength of an agreement that nobody has signed, and that nobody involved will yet confirm exists.
The Gulf spokesman who put the story in motion said explicitly that nothing had been concluded. A separate American official spent the afternoon calling the Strait international water controlled by nobody in particular, which is how you talk while bargaining, not after settling. Price doesn't seem to have noticed.
How the day came apart
Globex opened 80.10 and pushed up through the European morning to 82.33 shortly after five in the morning. That high deserves a name, because it was the last print made under the old assumption, the one where the Strait stays closed indefinitely.
At 06:44 Eastern a spokesman for a Gulf government confirmed draft language moving between the two capitals. Hourly structure broke inside one bar. At 07:43 the Treasury Secretary went on a business broadcast and said an agreement might land within a day or two.
Over the next three hours crude shed more than six dollars. On the way through it cut all three pivot supports, then the 40-day, then the low of the week before, and never produced a bounce worth the name. The selling was orderly rather than panicked, lower highs stacking against declining averages into the 14:31 settlement.
Two numbers finish the picture. Settlement came 61 cents off the low of a range spanning 7.17 points, so sellers ran the close and no value was accepted higher. And 328,624 contracts traded, roughly ten per cent above the twenty-day average. Real participation, not a holiday air pocket.
What the turnover is telling you
Put 328,624 contracts of volume beside 255,445 of open interest and the ratio clears 1.28. That is worth pausing on.
Traders opening fresh shorts to ride a new trend build open interest. Turnover running above open interest means something else is happening: positions are leaving, not arriving. Pair it with the volume distribution and the story writes itself. The heaviest transacted band of the entire decline sits up around 82, where 39 to 42 per cent of visible activity went through. Every one of those barrels is now more than six dollars offside.
This is crisis-era length being forced out of the market. Liquidation moves fast and tends to overshoot, which explains the speed. It also exhausts. Once the trapped inventory around 82 has cleared, pressing lower stops being automatic and starts requiring somebody to sell crude here on purpose.
The premium being removed was partly imaginary
Through late July this market absorbed reports of American and Israeli preparations against Iranian energy infrastructure, presidential threats to bomb infrastructure over any attack on shipping, and a pipeline consortium considering an open-ended stop to loading operations. That environment is where the premium got built.
One detail undercuts it. American command confirmed it had assisted more than a thousand vessels through the Strait across the past three months. Throughput was running considerably higher than the closure narrative implied, which made the premium more fragile than it looked from the screen.
A second, physical input reinforced Tuesday's move. Red Sea export volumes out of Saudi Arabia have climbed, and Yanbu had its heaviest loading day since spring. Real barrels, arriving by a route that avoids the contested chokepoint entirely, and they keep arriving whether or not the diplomacy works.
The counterweight almost nobody is pricing
Refining margins are the most contrarian signal on the board and they are shouting.
Gasoline settled 2.8522 a gallon, diesel 3.7705. Converted to a barrel basis against crude at 75.77, the implied spreads run far wider than normal, distillate most of all. The physical product market is still signalling tightness while the flat price falls apart.
That matters because durable crude declines usually need products to confirm them. Gasoline lost 3.86 per cent, a four-and-three-quarter-month low, so products are indeed following. Even so, margins in absolute terms stay high enough that refiners bidding aggressively for feedstock at these prices would put a genuine obstacle in front of the bearish case.
A second dissent belongs here too. Equities closed at records and the volatility gauge rose 3.91 per cent to 16.49 anyway. Rising implied volatility into record highs is hedging demand, or repositioning before an event. With the Hormuz outcome unresolved, read it as options traders refusing to endorse the resolution story.
Sitting exactly on the halfway line
Tuesday's settlement landed on 75.62, the year-to-date average, and just above 75.40, the halfway mark of the whole 52-week range.
Half of everything crude gained from 55.49 has been given back in two sessions. That number is the most important single reference in this review, and price closed 37 cents clear of it. Together with the 3 to 10 day crossover at 75.26, it forms a narrow shelf directly under the market.
Beneath the shelf, 75.16 was Tuesday's low and momentum work flagged it as structurally weak, made by momentum instead of by absorption. Lows like that get revisited. Treat it as a magnet, not a barrier.
Everything above is now supply
Because crude settled under every pivot support, the whole pivot structure has flipped into overhead resistance. That is the defining feature of Wednesday's map.
The third support at 75.88 sits eleven cents above the settle and the first hour will almost certainly go and touch it; reclaiming it is the minimum entry fee for any constructive argument. Then 76.42, the first deviation inverted, sitting on the upper lip of that volume shelf near 76.5, where about 30 per cent of the decline transacted. Above that, 77.15.
The zone that matters most runs 77.63 to 77.99: the 38.2 per cent retracements off four-week and thirteen-week lows, 77.63 and 77.88, with the 40-day sitting at 77.99. Densest concentration on the board, and the most probable place for a corrective bounce to die.
Higher still, 80.02, 80.09 and 80.34 sit within 32 cents of one another, the session pivot alongside the 61.8 per cent retracement and Monday's close. That grouping is the structural line between a breakdown and one that failed. Take 80.34 back and the bearish case is finished.
Washed out on one clock, ordinary on another
The nine and fourteen-day raw stochastics both read 1.36 per cent, meaning the close sat right at the very base of the recent range. That normally reads as exhaustion.
Relative strength disagrees. The fourteen-day sits at 43.06 after dropping 6.30 points in a single session, and the twenty-day at 45.10. There's nothing oversold there by any conventional measure, and getting the fourteen-day down to 30 would take crude to roughly 58.60. What the pairing really tells you is that the range before this was enormously wide, and there is a great deal of room underneath before anything mechanical starts supporting price.
Trend strength backs the direction without endorsing its maturity. Over nine days the reading is 31.67, negative direction 28.15 against positive 18.99. Decisively bearish. Twenty days falls to 18.68 with the two lines nearly level. Call this downtrend about two sessions old, and it has yet to reach the longer window.
How to trade it
Don't sell the low. Sell the bounce.
Scale into 77.15 to 78.00 with a preferred fill near 77.60, which puts you short into the inverted pivot supply where the retracements and the 40-day converge. Stop 78.85. That sits above where the breakdown zone tops out, and above the inverted first pivot support at 78.75. That is 1.25 of risk. Take 40 per cent at 76.00, another 40 at 75.16, and hold the last fifth for 73.55. Roughly 1.3, 2.0 and 3.2 to one.
Hold a 30-minute close over 78.75 and the structure voids outright, and any acceptance above 80.02 ends the discussion. Trim if 77.99 gets taken back and holds for over an hour.
The long side exists only conditionally, and only if the corrective structure shows up early: 76.42 reclaimed and held across two 15-minute closes, best of all after the inventory number prints a draw north of three million. Stop 75.05, which sits under the 75.16 front-contract low and the 75.11 continuous print alike. Objectives 77.15, then 78.75, then 79.61 where the 50-day sits. The first pays less than one-to-one, so treat it as a partial scale and nothing more.
Stand aside the moment any agreement headline crosses mid-session, since you cannot trade that move with defined risk and stops gap badly through it. Stand aside for the quarter hour either side of 10:30. Stand aside if crude gaps under 74.80 overnight, since the primary objective is already met and what remains to 73.55 doesn't justify entering at the extreme. And stand aside on an open between 75.90 and 76.40 that just sits there until half past ten, because dead centre of the inverted pivot range offers no structural edge whatsoever.
The two things that decide it
Ten thirty, the government inventory report. Consensus looks for a draw of 1.5 million barrels where the prior week drew 7.167 million, and the industry estimate on Tuesday evening had already shown stocks building. Any build at all, or a draw well short of 1.5 million, and the bearish case is confirmed, pushing price under 75.16, on toward 74.80, then 73.55. A draw above roughly three million contradicts the supply story on the very day that geopolitical premium is getting stripped out, and would likely squeeze toward 77.00.
And the headline, which has no time attached to it. The Treasury Secretary named Tuesday or Wednesday. Talks are being described as nearly done.
If it lands, trail targets aggressively rather than holding them. If negotiations visibly collapse, close the short at market and don't manage it to the stop, because so little structure exists from 78.00 up to 80.50 that a reversal covers ground fast.
The market has priced completion. The paperwork hasn't caught up.
Gold traded the opposite side of the same headline and rose anyway, which says something about who is buying: Gold (GC): the fear left, and gold went up anyway.The complete data picture
Every number behind Friday’s plan, charted first; the full numeric reference follows underneath.
Full numeric reference , every remaining figure from the review
Full data reference
Every figure behind the analysis above. September WTI, session of Tuesday 4 August 2026, prepared for Wednesday 5 August. Dollars per barrel unless marked.
| Reference | Value |
|---|---|
| Contract | September 2026 NYMEX WTI, CL1!, CLU26 |
| Settlement | 75.77, down 4.57 or 5.69 per cent |
| Monday's close | 80.34 |
| Globex open | 80.10 |
| Session high | 82.33, tagged shortly after 05:00 ET |
| Session low, front contract | 75.16 |
| Continuous-contract low | 75.11 |
| Daily range | 7.17 points, about 1.56 times the 14-day average daily range |
| Close off the low | 61 cents, bottom tenth of the range |
| Volume | 328,624 against a 20-day average of 298,672 |
| Open interest | 255,445 |
| Turnover ratio | above 1.28 |
| Late consolidation band | 75.11 to 75.42 |
| Last hourly bar | open 75.79, high 75.84, low 75.11, close 75.14 |
| Settlement time | 14:31 ET |
| Weighted alpha | positive 19.83 |
| Five-session change | down 4.86 per cent |
| Reference | Value |
|---|---|
| 52-week high | 95.30, price 20.87 per cent below |
| 52-week low | 55.49, price 35.90 per cent above |
| One-month low | 67.82 |
| 13-week low | 67.12 |
| 20-session change | up 5.07 or 7.21 per cent |
| 50-session change | down 13.95 or 15.61 per cent |
| Year-to-date change | up 18.40 or 32.28 per cent |
| Terminal swing high | 82.33 |
| Lower highs on the way down | near 79.5, then near 77.0 |
| Heaviest volume band | around 82, roughly 39 to 42 per cent of visible activity |
| Second volume band | near 76.5, roughly 30 per cent |
| Thin structural patch | roughly 78 to 80.5 |
| Absent daily reference | roughly 73.55 to 71.90 |
| Reference | Value |
|---|---|
| 3rd pivot support inverted | 75.88 |
| 1 deviation inverted | 76.42 |
| 2nd pivot support inverted | 77.15 |
| 38.2 per cent off the 4-week low | 77.63 |
| 38.2 per cent off the 13-week low | 77.88 |
| 40-day average | 77.99 |
| 1st pivot support inverted | 78.75 |
| Calculated target price | 79.24 |
| 50-day average | 79.61 |
| Session pivot | 80.02 |
| 61.8 per cent off the 52-week low | 80.09 |
| Monday's close | 80.34 |
| 20-day average | 80.89 |
| 1st pivot resistance | 81.62 |
| 5-day average | 81.69 |
| Session high | 82.33 |
| Reference | Value |
|---|---|
| Year-to-date average | 75.62 |
| 50 per cent of the 52-week range | 75.40 |
| 3 to 10 day average crossover | 75.26 |
| Session low, front contract | 75.16 |
| Continuous low | 75.11 |
| 2 deviations of support | 74.80 |
| 3 deviations of support | 73.55 |
| 18-day crossover stalls | 71.90 |
| 200-day average | 71.08 |
| 38.2 per cent off the 52-week low | 70.70 |
| One-month low | 67.82 |
| 13-week low | 67.12 |
| Reference | Value |
|---|---|
| 5-day | 81.69, settle 5.92 below |
| 20-day | 80.89, settle 5.12 below |
| 50-day | 79.61, settle 3.84 below |
| 100-day | 81.64, settle 5.87 below |
| 200-day | 71.08, settle 4.69 above, 6.6 per cent |
| Year-to-date average | 75.62, settle 0.15 above |
| Reference | Value |
|---|---|
| 9-day raw stochastic | 1.36 per cent |
| 14-day raw stochastic | 1.36 per cent |
| 20-day raw stochastic | 20.73 per cent, %K 44.49 |
| 14-day %K and %D | 20.96 against 37.29 |
| 9-day relative strength | 38.51 |
| 14-day relative strength | 43.06, down 6.30 points on the session |
| 20-day relative strength | 45.10 |
| 50-day relative strength | 48.54 |
| 100-day relative strength | 50.38 |
| Where 14-day strength reaches 30 | roughly 58.60 |
| Reference | Value |
|---|---|
| 9-day | index 31.67, negative 28.15, positive 18.99 |
| 14-day | index 24.85, negative 25.30, positive 21.80 |
| 20-day | index 18.68, negative 23.84, positive 22.71 |
| Multi-indicator composite | 56 per cent sell, average strength, strengthening direction |
| Short-term components | 40 per cent sell |
| Medium-term components | 75 per cent sell |
| Long-term components | 67 per cent sell |
| Trend signal | neutral |
| 20 against 50 day crossover | still positive, a legacy of the July advance |
| Reference | Value |
|---|---|
| 9-day true range | 5.11, 6.78 per cent; daily range 5.00; historic volatility 76.08 per cent |
| 14-day true range | 4.72, 6.25 per cent; daily range 4.59; historic volatility 69.35 per cent |
| 20-day true range | 4.47, 5.93 per cent; daily range 4.27; historic volatility 67.98 per cent |
| 50-day true range | 3.92, 5.20 per cent; daily range 3.73; historic volatility 52.90 per cent |
| 100-day true range | 3.21, 4.26 per cent; daily range 3.91; historic volatility 50.95 per cent |
| Realised above longer-run | roughly 59 per cent |
| One-range band on the settlement | 71.05 to 80.49 |
| Daily-range band | 71.18 to 80.36 |
| Pivot-anchored band, stale | 75.30 to 84.74 |
| Reference | Value |
|---|---|
| Brent | 79.36, down 4.41 or 5.26 per cent |
| Brent to WTI differential | 3.59 |
| September gasoline | 2.8522 per gallon, down 3.86 per cent, a 4.75-month low |
| Diesel | 3.7705 per gallon |
| September natural gas | 2.6820 per million British thermal units, down 3.56 per cent |
| Energy sector fund | down 0.46 per cent |
| Broad equity contract | up 1.80 per cent; cash index up 1.79 per cent |
| Nasdaq contract | up 3.36 per cent |
| Dow contract | up 1.75 per cent |
| Gold | 4,152.6, up 1.52 per cent |
| Volatility index | 16.49, up 3.91 per cent |
| Dollar index | 99.892, down 0.10 per cent |
| Reference | Value |
|---|---|
| Low | 73.55 to 74.80, agreement confirmed or a bearish build |
| Most likely | 75.00 to 77.20, no decisive headline |
| High | 78.00 to 80.35, talks stall or a large draw |
| Statistical one-range band | 71.05 to 80.49 |
| Pre-cash band on no headline | 74.80 to 76.90 |
| Path | Probability and description |
|---|---|
| Path A, bearish continuation | 40 per cent. Fails to reclaim 75.88, a build confirms, breaks 75.16 toward 74.80 with extension to 73.55, settling in the low 74s |
| Path B, corrective bounce that fails | 35 per cent. Rally into 76.42 then the 77.63 to 77.99 band, rejected, settles 75.80 to 76.80 |
| Path C, squeeze higher | 25 per cent. Talks stall or a large draw, thin structure allows travel toward the 80.02 pivot, settling above 78.75 |
| Reference | Value |
|---|---|
| Entry zone | 77.15 to 78.00, scaling in |
| Preferred fill | 77.60 |
| Stop | 78.85 |
| Risk | 1.25 |
| Target 1 | 76.00, returns 1.60, roughly 1:1.3, take 40 per cent |
| Target 2 | 75.16, returns 2.44, roughly 1:2.0, take 40 per cent |
| Target 3 | 73.55, returns 4.05, roughly 1:3.2, hold 20 per cent |
| Invalidation | a sustained 30-minute close above 78.75, or acceptance above 80.02 |
| Reduce | on a reclaim of 77.99 held beyond one hour |
| Reference | Value |
|---|---|
| Trigger | 76.42 reclaimed on two consecutive 15-minute closes, ideally after a draw above 3 million |
| Stop | 75.05 |
| Risk from 76.50 | 1.45 |
| Target 1 | 77.15, returns 0.65, a partial scale only |
| Target 2 | 78.75, returns 2.25, roughly 1:1.6 |
| Target 3 | 79.61, returns 3.11, roughly 1:2.1 |
| Invalidation | loss of 75.16 after entry, or a confirmed agreement headline |
| Time | Event |
|---|---|
| 05:00 | Eurozone producer prices, 4.6 per cent annual against 5.9 |
| 08:15 | Private employment change, 65,000 against 98,000 |
| 08:30 | Treasury financing announcement |
| 09:45 | Services and composite activity final, 53.6 |
| 10:00 | Services index 54.5 against 54.0; prices paid 65 against 67.7 |
| 10:30 | Weekly crude inventories, minus 1.5 million against minus 7.167 million |
| 16:05 | A central bank official speaks, after crude settlement |
| Unscheduled | a Strait of Hormuz agreement announcement, any hour |
| Reference | Value |
|---|---|
| United States services expectation | 54.5 against 54.0 |
| Eurozone composite output | 51.9 |
| UK composite output | 52.1 |
| Chinese services | 53.7 against 54.1 |
| Vessels assisted through the Strait | more than one thousand over three months |
| Saudi Red Sea exports | increased, Yanbu at its busiest loading day in months |
| Industry inventory estimate | showed a build, against an official forecast of a 1.5 million draw |
| Prior week official draw | 7.167 million barrels |
| Nearest overhead reference | 75.88, sitting 11 cents above the settlement |
| First target beneath the low | 74.80, roughly 97 cents below the settlement |
| Structural downside targets | the 1 month low at 67.82 and the 13 week low at 67.12 |
| Settle against the 20-day | 5.12 below |
| Data capture window | 17:03 to 17:12 ET, after the 14:31 settlement |
| Reference | Value |
|---|---|
| Late July | reports of preparations against Iranian energy targets; threats over any attack on shipping; a pipeline consortium weighing an indefinite halt |
| 06:44 ET | Gulf spokesman confirms drafted language, cautions nothing concluded |
| 07:43 ET | Treasury Secretary says a deal could arrive Tuesday or Wednesday |
| Reported | European states may underwrite part of a reopening arrangement |
| Reported | a United States official reframes the Strait as international waterway |
| Reported | a Saudi official denies mediated talks with the Houthi group |
| Policy signals | the Energy Secretary expects fuel prices to fall and a shipping waiver extension; the President says oil companies earn too much |
| July central bank decision | unchanged with three dissents for a 25 basis point increase |
| Reference | Value |
|---|---|
| Wednesday before the open | a major media group, a large pharmaceutical producer, a ride-hailing operator |
| Thursday morning | a major integrated energy producer |



