
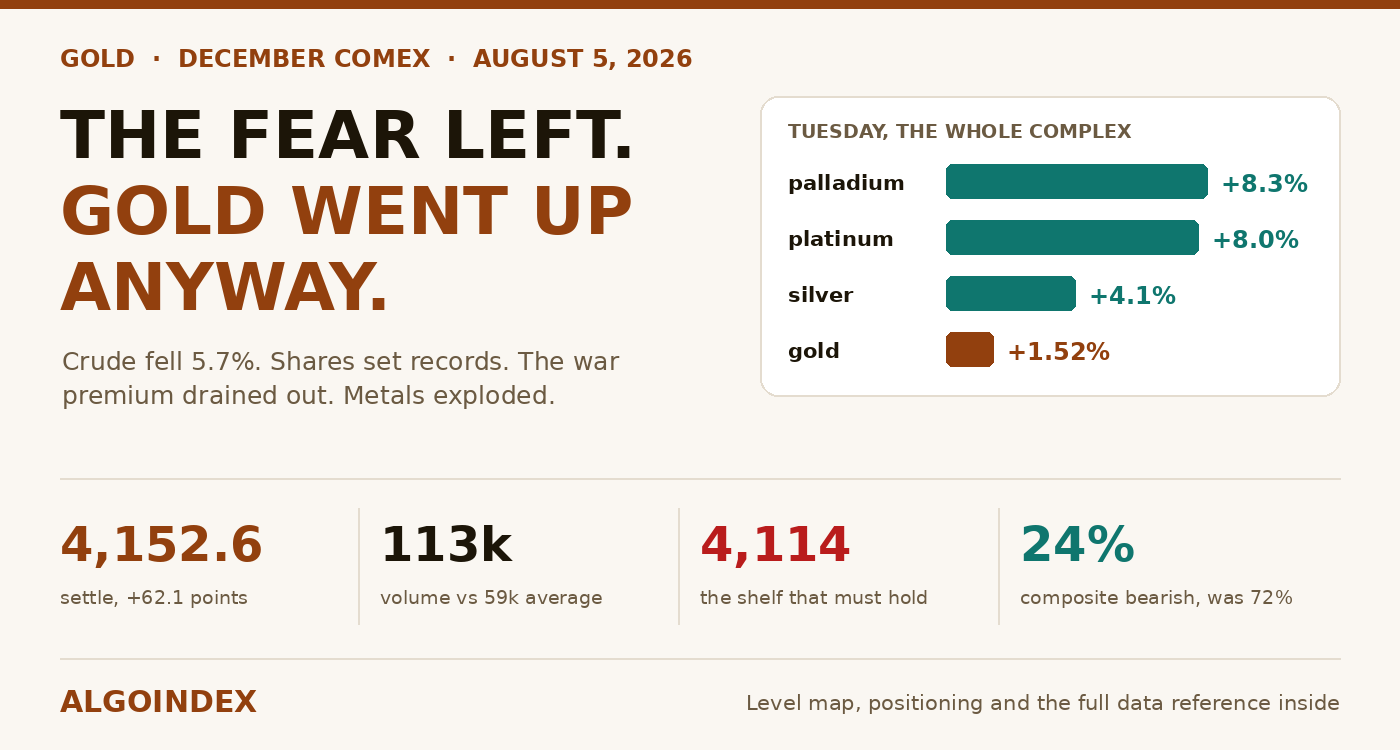
Everything that normally holds gold up went away on Tuesday. Crude collapsed 5.69 per cent. Shares printed records. The war premium was being negotiated out of the market in real time. Gold closed up 62.1 points at 4,152.6, and the rest of the metals went up far more.
That combination has exactly one coherent explanation, and it is not fear.
The day, in the order it happened
Monday finished at 4,090.5. Tuesday opened 19 points higher at 4,109.6, dipped to 4,098.2 early, and never went back. The low printed only eight points above the previous settlement, which tells you sellers had no appetite to press beneath it.
From there the bid was patient rather than violent. Nothing vertical, no spike that failed, simply a market grinding up through 4,132.7 and closing above it, which converts that number from a ceiling into the buyers' first line of defence. That 4,163.8 high arrived late, and giving 11.2 of it back into the settle is ordinary profit-taking rather than rejection.
Two details make the session more than a bounce. The close landed in the upper 83 per cent of a 65.6-point range. And 113,098 contracts changed hands against a twenty-day average near 59,400. Nearly double the usual participation, on a day when the metal gained 62 points while using less travel than a normal session provides.
Why it should not have happened
Headlines all day pointed one way: the Strait reopening under a negotiated arrangement, mediators confirming drafted language, a senior Treasury official suggesting a deal could land Wednesday, European governments reportedly willing to help fund it. Strikes already planned were shelved so the talks could continue.
September crude settled 75.77, lower by 4.57 dollars. The broad equity index rose 1.91 per cent, the Nasdaq 3.21. Under that arrangement, an asset held for protection gets sold.
Instead every precious metal on the board detonated. Silver 4.1 per cent higher. Platinum up 8.0. Palladium up 8.3. Gold, at 1.52 per cent, was the laggard of its own family.
So who was buying
Rates buyers and currency-debasement buyers. Two soft American prints landed in the morning. Openings came in at 7.359 million. Forecasters wanted 7.4535 million, and the prior month had shown 7.594, and factory orders down 0.3 per cent where a 0.2 per cent gain was expected. Bonds firmed on the pair, front-end yields eased, real yields compressed.
What it costs to hold an asset paying you nothing comes down, more reliably than anything else, to the real yield. Compress it and that cost falls. Tuesday compressed it, and the dollar eased on the very same numbers.
Investment-bank commentary this week reinforced the mechanism, calling the most recent central bank press conference dovish in tone, then pointing out that long-end yields climbed afterwards on the back of inflation breakevens. Falling near-term inflation expectations from cheap energy, rising long-run inflation pricing at the back end. That divergence is precisely the condition under which this metal outperforms.
There is a further wrinkle worth holding onto. On 29 July the committee held policy steady, splitting 9 to 3, all three dissenters wanting 25 basis points added rather than removed. Hawkish dissent beneath an unchanged setting limits any front-end rally that soft data alone might produce. Put a dovish-sounding chair together with hawkish internal disagreement and climbing breakevens and you produce the debasement bid that showed up on Tuesday.
Why the buyer matters more than the number
A rally into de-escalation has a better ownership structure than a rally into panic. Fear buyers leave when the headline resolves. These buyers haven't got a headline to wait for.
Which sets up Wednesday's specific risk cleanly. A formal signed agreement could still trigger a reflexive 20 to 40 point sale in metals on the print. If 4,114 holds through that, the dip is an opportunity rather than a turn. If it doesn't hold, the thesis was wrong. Don't front-run the headline in either direction.
Seven references inside eighteen points
That shelf running 4,114 to 4,133 matters more than anything else on the board, and it is crowded. Working down: 4,132.7 is the reclaimed resistance, 4,131.3 the two-deviation band, then 4,121.0 where the 20-day sits, then one deviation at 4,119.4, 4,117.5 the 5-day, 4,116.1 the 9-day crossing, and 4,114.4 the 18-day.
Seven independent references inside eighteen points gives unusually tight risk definition. It is where a pullback should be bought and equally where a failure becomes disqualifying.
Overhead sits the decision zone, 4,182.1 down to 4,174.8: the second resistance projection, 4,177.9 for the 38.2 per cent retracement off the four-week high, and the 40-day crossing. Three references inside eight points. Settle above 4,182 and it becomes the first real medium-term structural improvement this metal has managed since early July.
And just beneath that, a neat coincidence. Tuesday's high at 4,163.8, 4,166.7 where the raw stochastic projects to 70, and the neutral-50 strength marker at 4,166.3, all inside three points of each other. Clear that pocket and the short-term oscillator picture flips outright constructive.
The part that is still broken
None of this is a reversal that's finished, and treating it as one is the way to lose money on it.
Price sits 106.4 points under a 50-day of 4,259.0. The 100-day is 381 points further off, the 200-day 465.5. It trades 28.5 per cent under the 29 January peak of 5,781.8, and three months have taken 10.85 per cent off it. Every longer average sits above every shorter one, which is a bearish stack by definition.
What changed is the bottom of that stack. Price is back over the 5-day and the 20-day together, something it has not managed in weeks, and the pair of them sit 3.5 points apart, which sets up a short-term crossover if Wednesday holds. As for the multi-system composite: 72 per cent bearish a month back, 56 a week ago, and 24 now. Short-term components net 20 per cent bullish while long-term components remain 67 per cent bearish.
Constructive near-term, broken structurally. Both statements are true and neither cancels the other. Call it what it is, a recovery running counter to a larger decline. Buy pullbacks that actually hold, respect what sits overhead, and refuse to extrapolate one strong session into a finished bottom.
A trend that stopped trending
Nine-day directional strength has fallen away to 16.37, the two direction lines effectively tied at 15.48 and 15.43. Under 20, with directions converged, you are looking at the statistical signature of a market that quit trending. At fourteen and twenty days sellers still lead, 26.56 and 29.72 with negative direction on top, but both are decaying. Fourteen-day historic volatility has fallen to 19.21 per cent from 24.45 on the fifty-day. The market is calming while it bases.
The options are not paying attention
Implied volatility on the proxy reads 26.29 per cent, down in the bottom quarter of where it has traded this year. Skew ranks 32.67, so protection demand is modest. The implied single-session move works out near 55 points on the December contract, set against a daily range averaging 81.7 points.
Option markets aren't pricing Wednesday's data risk. Combine that with dealers carrying negative call-side gamma of 161.99 million, which obliges them to chase strength and offer weakness up in the higher part of the distribution, and the mechanical path of least resistance points up, with the caveat that a genuine data surprise is poorly hedged and would travel further than the pricing implies.
How to trade it
Buy the shelf, not the strength. Entry 4,120 to 4,135, ideally somewhere near 4,125 to 4,132 inside that 09:45 to 10:00 window with structure sitting right underneath and a catalyst fifteen minutes out. Don't chase above 4,160 ahead of the data. A second entry exists if price breaks decisively above 4,167 and holds there, accepting worse risk placement.
Stop below 4,094, under Tuesday's low and under Monday's close. From 4,128 that is 34 points. Targets: 4,163.8 for partial size, then 4,178 inside the supply band, then 4,204, which needs both data points to come in soft. Roughly 1.1, 1.5 and 2.2 to one, about 1.6 blended.
Two 15-minute closes in a row under 4,114 void the setup regardless of where the stop sits. A close under 4,090.5 kills the bounce thesis outright and puts 4,061 back in play, and under that the base, 4,019 down to 4,015.
The fade exists only with an explicit signature: price up into 4,182 from 4,174, an upper wick of twelve points or better on the 15-minute, a close back under 4,172, and a hot prices-paid print alongside it. Sell 4,172 to 4,178, stop above 4,190, targets of 4,152.6, then 4,132.7, and finally the 20-day. Half size, since it argues against both how the session closed and how dealers are positioned.
The one thing that overrides everything
Should the ten o'clock services survey run hot on both the headline and prices paid, stand the long down wherever price happens to be.
That pairing goes straight at the real-yield machinery behind Tuesday, and favourable chart structure counts for nothing against a reversal in rates. Everything constructive written above is downstream of one number.
The same 10:00 print decides the equity session too, for the opposite reason: ES / S&P 500: a record on loan.The complete data picture
Every number behind Friday’s plan, charted first; the full numeric reference follows underneath.
Full numeric reference , every remaining figure from the review
Full data reference
Every figure behind the analysis above. December gold, session of Tuesday 4 August 2026, prepared for Wednesday 5 August.
| Reference | Value |
|---|---|
| Contract | December 2026 COMEX gold, GC1!, Dec 26 delivery |
| Settlement | 4,152.6, up 62.1 points, 1.52 per cent |
| Monday's close | 4,090.5 |
| Open | 4,109.6 |
| Session high | 4,163.8 |
| Session low | 4,098.2 |
| Session range | 65.6 points |
| Close position in range | upper 83 per cent |
| Retreat from the high | 11.2 points |
| Volume | 113,098 against a 20-day average near 59,400 |
| Open interest | 279,897 |
| Weighted alpha | positive 3.57 |
| Twelve-month picture | positive 15.89 per cent |
| Late-session hourly band | 4,131 to 4,137, sub-3-point compression on the 15 and 1-minute |
| Reference | Value |
|---|---|
| 13-week low | 4,015.6, set 30 June |
| One-month low | 4,019.0, set 17 July |
| One-month high | 4,276.2, set 6 July |
| Above the base | 137 points |
| Below the one-month high | 123.6 points |
| January high | 5,781.8, set 29 January |
| Below the January high | 28.5 per cent |
| Three-month change | down 10.85 per cent |
| Swing pivots to carry | 4,163.8 above, 4,098.2 below |
| Higher low since the base | above 4,098 |
| Reference | Value |
|---|---|
| Session high | 4,163.8 |
| Where strength reaches 50 | 4,166.3 |
| 70-level stochastic projection | 4,166.7 |
| 2nd resistance projection | 4,174.8 |
| 38.2 per cent off the 4-week high | 4,177.9 |
| 40-day average crossing | 4,182.1 |
| 80-level stochastic projection | 4,187.8 |
| 18-day average stall | 4,201.4 |
| 3rd resistance projection | 4,204.2 |
| 9-day average stall | 4,210.3 |
| One-month high | 4,276.2 |
| Reference | Value |
|---|---|
| 1st resistance, now support | 4,132.7 |
| 2 deviations | 4,131.3 |
| 20-day average | 4,121.0 |
| 1 deviation | 4,119.4 |
| 5-day average | 4,117.5 |
| 9-day average crossing | 4,116.1 |
| 18-day average crossing | 4,114.4 |
| Daily pivot | 4,103.3 |
| Session low | 4,098.2 |
| Monday's close | 4,090.5 |
| 1 deviation of support | 4,061.6 |
| 1st support projection | 4,061.2 |
| 20-level stochastic projection | 4,061.2 |
| 2nd support projection | 4,031.8 |
| One-month low | 4,019.0 |
| 13-week low | 4,015.6 |
| 3rd support projection | 3,989.7 |
| Reference | Value |
|---|---|
| 5-day | 4,117.5, price 35.1 above, period change plus 33.6 or 0.82 per cent |
| 20-day | 4,121.0, price 31.6 above, period change minus 86.1 or 2.04 per cent |
| 50-day | 4,259.0, price 106.4 below, period change minus 511.4 or 11.01 per cent |
| 100-day | 4,533.6, price 381.0 below, period change minus 1,198.7 or 22.49 per cent |
| 200-day | 4,618.1, price 465.5 below, period change minus 247.8 or 5.66 per cent |
| Year-to-date | 4,710.0, price 557.4 below, period change minus 365.2 or 8.12 per cent |
| Gap between the 5-day and 20-day | 3.5 points |
| Reference | Value |
|---|---|
| 9-day | raw 52.73 per cent, %K 34.55, %D 38.57, strength 50.24 |
| 14-day | raw 53.65 per cent, %K 43.08, %D 46.41, strength 47.30 |
| 20-day | raw 53.65 per cent, %K 39.48, %D 39.76, strength 45.27 |
| 50-day | raw 17.21 per cent, %K 13.92, %D 14.96, strength 44.65 |
| 100-day | raw 8.74 per cent, %K 6.95, %D 7.38, strength 47.51 |
| 14-day strength change | improved 3.74 points on the session |
| Reference | Value |
|---|---|
| 9-day index | 16.37, positive 15.48, negative 15.43 |
| 14-day index | 26.56, positive 15.16, negative 19.00 |
| 20-day index | 29.72, wider negative bias |
| Historic volatility 14-day | 19.21 per cent |
| Historic volatility 50-day | 24.45 per cent |
| Composite today | 24 per cent bearish, soft strength, weakening direction |
| Composite yesterday | 56 per cent bearish |
| Composite a week ago | 56 per cent bearish |
| Composite a month ago | 72 per cent bearish |
| Short-term group | 20 per cent bullish |
| Medium-term group | 25 per cent bearish |
| Long-term group | 67 per cent bearish |
| Trading guide | buy, weak strength |
| Reference | Value |
|---|---|
| 9-day true range | 87.7, 2.10 per cent; daily range 82.2, 1.99 per cent |
| 14-day true range | 93.0, 2.30 per cent; daily range 81.7, 1.98 per cent |
| 20-day true range | 98.1, 2.40 per cent; daily range 85.3, 2.06 per cent |
| 50-day true range | 112.7, 2.70 per cent; daily range 102.1, 2.47 per cent |
| 100-day true range | 110.7, 2.70 per cent; daily range 115.9, 2.80 per cent |
| One-ATR band on the settle | 4,059.6 to 4,245.6 |
| Daily-range band | 4,070.9 to 4,234.3 |
| Centred expectation | 4,071 to 4,234 by daily range, 4,060 to 4,246 by true range |
| Practical planning range | 4,098 to 4,204 |
| Reference | Value |
|---|---|
| Silver | 60.245, up 2.389, roughly 4.1 per cent |
| Platinum | 1,756.0, up 129.7, roughly 8.0 per cent |
| Palladium | 1,360.80, up 104.20, roughly 8.3 per cent |
| High-grade copper | 6.6435, up 0.1030 |
| September crude | 75.77, down 4.57 or 5.69 per cent |
| Broad equity index | 7,747.40, up 1.91 per cent |
| Nasdaq-100 | 29,700.53, up 3.21 per cent |
| Gold-tracking fund | 374.00 against a prior close of 371.69, volume 4.75 million shares |
| Spot gold | 4,077.65 |
| December forward premium | roughly 75 points |
| Job openings | 7.359 million against 7.4535 million forecast, 7.594 million prior |
| Factory orders | minus 0.3 per cent against plus 0.2 per cent expected |
| Reference | Value |
|---|---|
| Call-side gamma | negative 161.99 million |
| Put-side gamma | positive 100.94 million |
| Upper volatility inflection | 402 on the proxy, roughly 4,383 spot, 4,458 futures |
| Lower volatility inflection | 335 on the proxy, roughly 3,653 spot, 3,728 futures |
| Call volume | 82,080 |
| Put volume | 56,550 |
| Put to call open interest | 0.51 |
| Gamma and delta concentration | 17 September expiry |
| One-month implied volatility | 21.41 per cent |
| One-month realised volatility | 20.93 per cent |
| Implied volatility rank | 26.29 per cent |
| Skew rank | 32.67 per cent |
| Implied single-session move | 5.02 on the proxy, roughly 55 points on December |
| Proxy to spot ratio | roughly 10.9 to 1 |
| Reference | Value |
|---|---|
| Managed money long | 135,093 |
| Managed money short | 15,298 |
| Managed money net long | 119,795, shrank 5,036 on the week |
| Managed money longs cut | 6,394 |
| Managed money shorts covered | 1,358 |
| Non-commercial long | 219,622 |
| Non-commercial short | 37,552 |
| Commercial long | 75,460 |
| Commercial short | 287,769 |
| Commercial net short | 212,309 |
| Swap dealer long | 23,661 |
| Swap dealer short | 215,421 |
| Reference | Value |
|---|---|
| Low band | 4,061 to 4,098, requires a hot services print |
| Most likely | 4,114 to 4,175, roughly 61 points |
| High band | 4,182 to 4,235, requires a soft data pair |
| Overnight expectation | hold 4,132 to 4,140 and probe toward 4,163.8 |
| Overnight damage level | a drop below 4,114 |
| Path | Probability and description |
|---|---|
| Path A, continuation higher | 45 per cent. Shelf holds, clears 4,167, works into 4,174.8 to 4,182, extension to 4,204 |
| Path B, range and retest | 35 per cent. Oscillates between the shelf and 4,163.8 without resolving |
| Path C, reversal lower | 20 per cent. Hot prices paid, shelf breaks, back to 4,103 then 4,090.5, with 4,061 and the base beyond |
| Reference | Value |
|---|---|
| Entry zone | 4,120 to 4,135, preferably 4,125 to 4,132 in the 09:45 to 10:00 window |
| Secondary entry | a decisive break and hold above 4,167 |
| Do not chase | above 4,160 before the 10:00 data |
| Stop | below 4,094 |
| Risk from a 4,128 entry | 34 points |
| Target 1 | 4,163.8, plus 36 points, roughly 1:1.1 |
| Target 2 | 4,178, plus 50 points, roughly 1:1.5 |
| Target 3 | 4,204, plus 76 points, roughly 1:2.2 |
| Blended across a scaled exit | approximately 1:1.6 |
| Invalidation | two consecutive 15-minute closes beneath 4,114; a close below 4,090.5 ends the bounce thesis |
| Reference | Value |
|---|---|
| Condition | advance into 4,174 to 4,182 with a 12-point upper wick and a close back beneath 4,172, on a hot prices-paid print |
| Entry | 4,172 to 4,178 on the rejection close |
| Stop | above 4,190 |
| Risk from 4,175 | approximately 15 points |
| Targets | 4,152.6, then 4,132.7, then 4,121 |
| Reward | 1:1.5, 1:2.8, 1:3.6 |
| Size | half |
| Time | Event |
|---|---|
| 02:45 | French industrial production, plus 0.3 per cent against minus 0.1 |
| 03:50 to 04:30 | French, eurozone and UK final composite and services surveys |
| 05:00 | Eurozone producer prices, 4.6 per cent annual against 5.9, minus 0.3 monthly against plus 0.2 |
| 08:15 | Private payroll change, 65,000 against 98,000 |
| 08:30 | Treasury refunding announcement |
| 09:45 | Services survey final 53.6, composite final against 53.6 prior |
| 10:00 | Services headline 54.5 against 54.0; prices paid 65 against 67.7; employment 51 against 51.2 |
| 10:30 | Energy inventories, minus 1.5 million against minus 7.167 million |
| 16:05 | Federal Reserve governor speaks |
| Reference | Value |
|---|---|
| 18:45 | New Zealand employment |
| 19:00 | Australian services surveys |
| 19:50 | Japanese central bank meeting minutes |
| 21:45 | Chinese services, 53.7 against 54.1 |
| Thursday 08:30 | Jobless claims and unit labour costs |
| Friday 08:30 | Employment report, payrolls 80,000 against 57,000, unemployment 4.2 per cent |
| Reference | Value |
|---|---|
| 29 July decision | unchanged on a 9 to 3 vote, all dissents for a 25 basis point increase |
| Swiss policy guidance | holding at zero through the end of 2027 |
| Yen intervention | 30 and 31 July, cumulative well above the prior year's total |
| Vessels assisted through the Strait | more than 1,000 over three months |
| Counter-trend rallies since January | 60 to 120 points, repeatedly failing near declining averages |
| Distance from the settle to the one-month high | roughly 124 points, beyond a normal daily range |
| A successful continuation close | between 4,165 and 4,185, without resolving the medium-term decline |
| Fade objectives in points | 22, 42 and 54 from a 4,175 entry |
| Below the 200-day | 465 points |



