
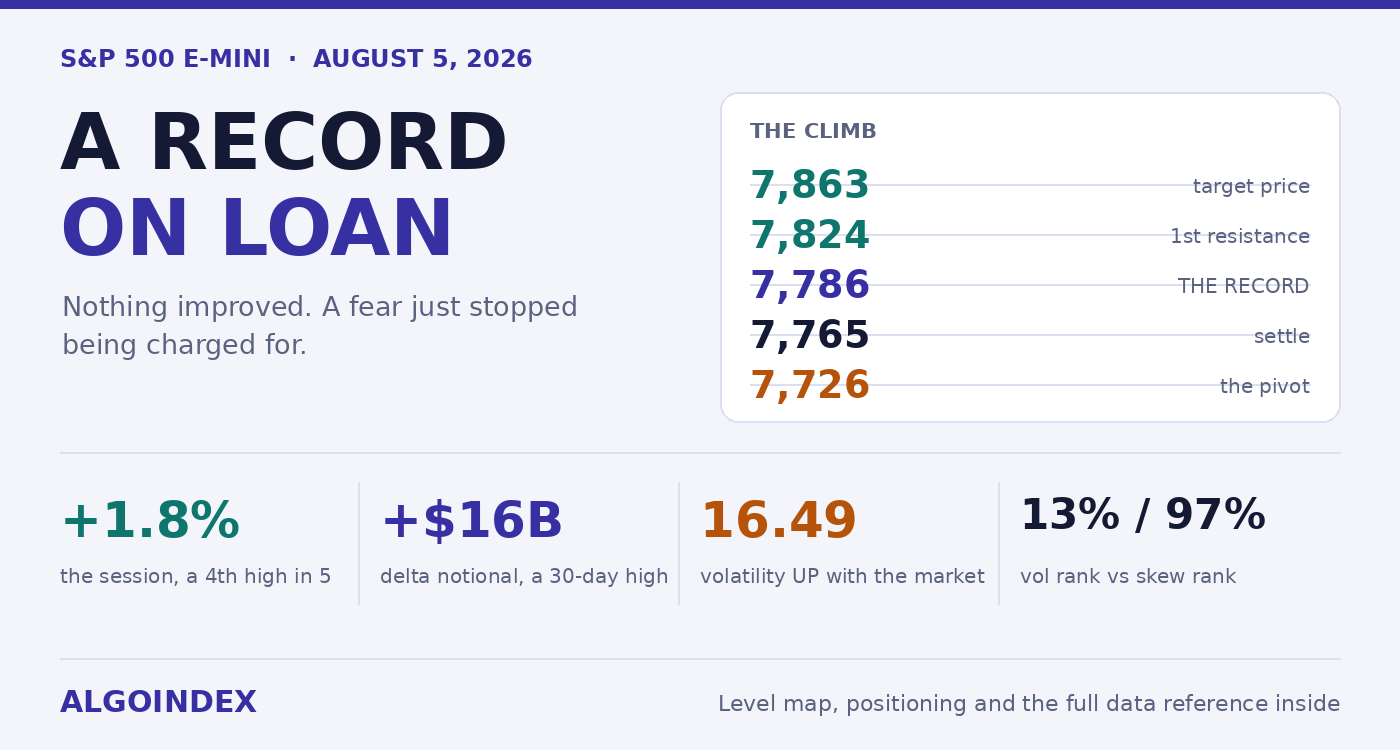
A record close of 7,765.50 on the E-mini, after a print at 7,786.00. Nothing about the economy improved on Tuesday. A fear simply stopped being charged for, and whoever controls that fear can start charging again overnight.
Which is the whole problem with Wednesday. Gains earned by companies belong to the companies. Gains handed over when a worry lifts are borrowed, and the lender can call them.
What moved it
Shipping through Hormuz. At 06:44 Eastern came word that Qatar had drafted terms for a US and Iran understanding; an hour later the Treasury Secretary told a television audience something might be signed by Wednesday. Crude dropped. Treasuries caught a firm, immediate bid from buyers who had spent weeks on the sidelines. Weeks of accumulated insurance cost came out of equity prices at once.
Chips carried it. Their sector gauge put on 7 per cent, the best four-session run it has managed in six years, hauling the Nasdaq 3 per cent higher. A data-analytics large cap tacked on 30 per cent by itself after reporting.
The American numbers that day were weak. Openings landed at 7.359 million; forecasters wanted 7.4535 million and the month before had shown 7.594 million. Factory orders shrank 0.3 per cent where growth of 0.2 was penciled in.
Cooling jobs plus cheaper energy is the one mix that lets traders discount inflation worry and rate worry together. They did. And bonds climbing beside stocks confirms the diagnosis: insurance came off, optimism did not go on.
The awkward part
Rallies normally drain option prices. Hedges get unwound, implied sinks, everyone relaxes. Tuesday did the reverse.
The volatility gauge finished at 16.49, richer by 4 per cent, on a day the index added 1.8. Its second-order cousin ended at 92.57, up 2. Right across the strike surface, fixed-strike readings picked up somewhere between 2 and 10 points. Second day running of that pattern.
When implied climbs while spot climbs, the buying is arriving in the options pits, not the cash market, and it is heavy enough to lift the whole surface as it goes. Somebody is reaching for the upside using direction and volatility simultaneously. Markets built that way run a long way, then snap.
Sixteen billion, and why the calendar matters more than the total
Directional exposure on the S&P swung by plus 16 billion dollars, the fattest positive figure in a month. The Nasdaq showed plus 8.5 billion, likewise a monthly best. Contract tallies were near enough even, 1.123 million calls versus 1.142 million puts, so counting tickets won't tell you anything.
Expiry does. What got bought sat well out in time, not on the same-day board, and that decides whether any of this survives to Wednesday. Same-day paper evaporates by morning. Dated calls leave the other side of the trade owing a hedge they must keep adjusting, session after session, right through to the 20 August concentration.
Worth pulling out one detail. Fifteen thousand customer calls struck at cash 7,700 were unwound while the market ran. Dealer books around that strike are what put a foot on the accelerator once the level gave way. Spent now. Repeating the trick would require fresh open interest to be built somewhere higher up the board first.
The published map is out of date
Cash settled 7,737. Down at 7,650 sits the heaviest call-side dealer strike, with the gamma flip a good deal further below that again, at 7,443. That leaves price 87 points clear of one and 294 clear of the other.
Resistance markers quoted at 7,650 and, below that, 7,620, with step-down supports of 7,600, then 7,550, then 7,500, then 7,480, were all worked out on 3 August. Price has walked through every one since. Quoting any of them on Wednesday morning would be a real mistake, because they describe a market that has stopped existing.
The live implication is mechanical. Trade far enough above the biggest call-side pile and the people short those calls need more length as price rises and less as it falls. Their hedging pushes rather than cushions. It's why cash 7,700 gave way so quickly on Tuesday, and why a clean move through 7,786.00 ought to keep going instead of stalling at the number.
The machinery is symmetric, which is the uncomfortable half. Below 7,726.83 it works against you just as efficiently. Treat that pivot as a real line.
Extended, but young
Spot runs 245 points clear of the 20-day at 7,534.76. Given a 20-day true range near 104 points, the contract floats roughly two and a half normal days above its own recent centre. Snapping back is cheap from up here: one ordinary down day lands you at 7,660, and even that leaves 125 points of daylight.
Momentum is stretched everywhere, warning nowhere at all, which is the point. Raw stochastics sit at 95.56 on the 9, 14 and 20-day windows, 95.85 at fifty days, 98.52 at a hundred. Strength readings are high and climbing rather than rolling. Thirteen separate systems come out 88 per cent long, with the medium and long-horizon groups unanimous.
The directional numbers are more revealing. Nine days out, the index has climbed to 31.97, plus-direction 30.42 against minus-direction 14.06, comfortably better than two to one. Stretch that window and it fades: 23.47 at fourteen days, 17.54 at twenty. Strong up close and soft further back is the fingerprint of a trend that only just got going. Those rarely die just because an oscillator's full.
Cheap volatility, dear insurance
One reading refuses to sit with the others. Implied volatility sits at 13.46 per cent of its yearly span. Bottom of the barrel. Skew, meanwhile, ranks 97.21, which is very nearly the ceiling of its own annual range.
Translated: nobody expects much to happen, and nobody's selling the downside anyway. One-month implied at 12.43 is beneath one-month realized at 13.27, so protection costs less than the index has actually been moving. Analysts flagged one-month implied correlation dropping to a zone that historically makes hedging worthwhile, and suggested owning put spreads out a month or more while keeping equity length on above the risk pivot.
That combination doesn't argue for being short. It argues for owning the upside through defined risk instead of through size.
What decides it
Ten o'clock. The services survey, and inside it the prices-paid line, forecast at 65 after 67.7.
That number tests Tuesday directly. Come in at 65 or under and the cheaper-energy story holds together, with dealer hedging shoving price through the record. Print above 67 and the justification for the whole advance evaporates; expect 7,726.83 to get tested in a hurry.
Everything else feeds the same question. Payrolls from the private survey at 08:15 carry a 65,000 forecast after 98,000. Disinflation without recession requires soft, not broken. Under roughly 40,000 and the story turns from comfortable slowdown into demand worry, which gets sold no matter what it does to rate expectations. Inventories at 10:30 matter through the identical channel, and Tuesday evening's industry figures already had crude stocks building by 2.7 million barrels where forecasters wanted a draw of 2 million.
Trading it
Wait for a dip; don't pay up. Long between 7,740 and 7,760, aiming to fill near 7,750. The reason to expect that chance is after-hours: a big chip designer beat the quarter, guided the next one light, and lost about 7 per cent; a large space and connectivity business beat on revenue and still shed roughly 5. Both moves fell inside their priced ranges, so this drags the open without breaking anything.
The zone is where three unrelated studies land inside a two-point window: an extension anchor at 7,762.90, a liquidity marker down at 7,761.25, and between them the 9 against 18-day crossover on 7,762.00 exactly. Stop 7,715, deliberately 11.83 under the pivot so a spike through doesn't remove you. Thirty-five points of risk on the position. Objectives 7,786.00, then 7,824.67, then 7,863.17, worth about 1.0, 2.1 and 3.2 times the risk.
Skip it if the bell rings above the record and price never returns to the shelf; buying a gap into hedging that amplifies turns a one-to-one first objective into a third of one. Skip it if 09:45 arrives with price marooned between settle and record and nothing decided, because there is no risk line to work against. And leave the ten minutes on either side of the survey alone entirely.
A short only exists if the pivot fails twice on 15-minute closes, preferably on an ugly prices-paid figure. Fade a retest from underneath around 7,715 to 7,725, stop 7,752, objectives 7,693.60, 7,667.67, then the 7,608 area. Half size at most. Selling a market that just closed at a record with 88 per cent of systems long demands proof, not anticipation.
The line that matters
Should the Hormuz talks visibly fall apart, get out at market. Forget the stop.
Tuesday added no value. It removed a charge. One headline can reinstate it at any hour, including while you sleep. The structure points up. Just size it like money you are holding for someone else.
Yesterday the same index was sitting above every line on the map with the needle refusing to move. That piece is here: ES / S&P 500: above every line on the map.The complete data picture
Every number behind Friday’s plan, charted first; the full numeric reference follows underneath.
Full numeric reference , every remaining figure from the review
Full data reference
Every figure behind the analysis above. ES front month, session of Tuesday 4 August 2026, prepared for Wednesday 5 August. Futures points unless marked otherwise.
| Reference | Value |
|---|---|
| Contract | September 2026 S&P 500 E-mini, ESU26 |
| Settlement | 7,765.50 |
| Session high, a record | 7,786.00 |
| Approximate session range | 7,658 to 7,786.00 |
| Cash index close | 7,737 |
| Cash gain | 1.8 per cent |
| Prior cash close | 7,600.50 |
| Futures basis | roughly 28 to 29 points |
| Cash range traded | 164 basis points, about 127 index points |
| Close below the high | about 20 points |
| New high count | 4th in 5 sessions, 28th of the year |
| Five-session gain | 300.25 points, 4.02 per cent |
| Open interest | 2,069,055 |
| Reference | Value |
|---|---|
| Trading | 7,779.50 to 7,782.25 |
| Gain on settle | 14.00 to 16.75 points |
| Overnight range | 7,771.00 to 7,783.25 |
| Volume | roughly 5,600 contracts |
| Distance below the record | 0.26 per cent |
| Reference | Value |
|---|---|
| Pivot | 7,726.83 |
| 1st resistance | 7,824.67 |
| 2nd resistance | 7,883.83 |
| 3rd resistance | 7,981.67 |
| Derived target price | 7,863.17 |
| 1st support | 7,667.67 |
| 2nd support | 7,569.83 |
| 3rd support | 7,510.67 |
| 1 deviation of resistance | 7,922.81 |
| 1 deviation of support | 7,608.19 |
| 2 deviations of support | 7,543.03 |
| 3-day and 10-day crossover stalls | 7,901.79 |
| Where 14-day strength reaches 70 | 7,884.07 |
| Where 14-3 day stochastic falls to 80 | 7,693.60 |
| Reference | Value |
|---|---|
| Primary call-side level | cash 7,650, futures 7,677.15 |
| Primary put-side level | cash 7,400, futures 7,427.15 |
| Dealer gamma flip | cash 7,443, futures 7,470.15 |
| Volatility inflection | cash 7,495, futures 7,522.15 |
| Primary gamma concentration strike | cash 8,000, futures 8,027.15 |
| Stated risk pivot | cash 7,480, futures approximately 7,508 |
| Above the call-side level | 87 points |
| Above the gamma flip | 294 points |
| Stale summary resistance | 7,620 and 7,650, last recalculated 3 August |
| Stale support ladder | 7,600, 7,550, 7,500, 7,480 |
| Volatility-amplification reference | cash 7,735, futures 7,763.50 |
| Low-amplification reference | 9,075, treated as low confidence |
| Reference | Value |
|---|---|
| Chart extension anchor | 7,762.90 |
| 9-day and 18-day crossover | 7,762.00 |
| Intraday liquidity marker | 7,761.25 |
| Lower extension anchors | 7,566.55, 7,543.45, 7,347.10 |
| Latest 1-hour bar | open 7,772.00, high 7,783.25, low 7,771.00, close 7,782.25 |
| Latest 15-minute bar | open 7,780.25, high 7,783.25, low 7,779.25, close 7,781.50 |
| Reference | Value |
|---|---|
| 5-day | 7,547.35, spot 232 above |
| 20-day | 7,534.76, spot 245 above |
| 50-day | 7,537.34, spot 242 above |
| 100-day | 7,298.92, spot 481 above |
| 200-day | 7,146.80, spot 633 above |
| Above the 20-day | 3.2 per cent, about 2.4 average daily ranges |
| Reference | Value |
|---|---|
| 52-week high | 7,786.00 |
| 13-week high | 7,786.00 |
| One-month high | 7,786.00 |
| One-month low | 7,324.00 |
| 13-week low | 7,279.75 |
| Position in the one-month range | roughly 99 per cent |
| Reference | Value |
|---|---|
| 5-day | plus 4.02 per cent |
| 20-day | plus 2.84 per cent |
| 50-day | plus 3.20 per cent |
| 100-day | plus 14.55 per cent |
| 200-day | plus 13.81 per cent |
| Year to date | plus 11.05 per cent |
| Weighted alpha | plus 18.58 |
| Reference | Value |
|---|---|
| Raw stochastic 9, 14 and 20-day | 95.56 per cent each |
| Raw stochastic 50-day | 95.85 per cent |
| Raw stochastic 100-day | 98.52 per cent |
| 9-day %K and %D | 91.35 and 74.33 |
| 14-day %K and %D | 85.31 and 65.00 |
| Relative strength 9-day | 71.51 |
| Relative strength 14-day | 65.41, a three-day gain of 6.82 |
| Relative strength 20-day | 62.02 |
| Relative strength 50-day | 58.01 |
| Reference | Value |
|---|---|
| 9-day index | 31.97 |
| 9-day positive direction | 30.42 |
| 9-day negative direction | 14.06 |
| 14-day index | 23.47 |
| 20-day index | 17.54 |
| Multi-indicator composite | 88 per cent buy across 13 systems |
| Medium and long-term groupings | 100 per cent buy |
| Short-term grouping | 60 per cent buy |
| Sole dissent | the 20-day against 50-day crossover |
| Trend signal | buy |
| Reference | Value |
|---|---|
| 9-day average true range | 112.67 points, 1.45 per cent |
| 14-day average true range | 106.84 points, 1.38 per cent |
| 20-day average true range | 103.92 points, 1.34 per cent |
| 9-day average daily range | 121.06 points |
| 14-day average daily range | 106.50 points |
| 20-day average daily range | 97.25 points |
| Historic volatility 9-day | 17.66 per cent |
| Historic volatility 14-day | 15.93 per cent |
| Historic volatility 20-day | 14.06 per cent |
| One-month implied volatility | 12.43 per cent |
| One-month realized volatility | 13.27 per cent |
| Implied volatility rank | 13.46 per cent |
| Implied one-day move | 0.69 per cent, about 59.64 index points |
| Implied five-day move | 1.56 per cent |
| True-range band on 7,779.50 | 7,673 to 7,886 |
| Daily-range band | 7,731 to 7,828 |
| Reference | Value |
|---|---|
| Volatility index | 16.49, up 4 per cent |
| Second-order volatility measure | 92.57, up 2 per cent |
| Fixed-strike volatility | up 2 to 10 points across the surface |
| S&P delta notional | plus 16 billion dollars, largest of 30 days |
| Nasdaq delta notional | plus 8.5 billion dollars, largest of 30 days |
| Small-cap gamma notional | negative |
| Cash index call volume | 1,123,000 contracts |
| Cash index put volume | 1,142,000 contracts |
| Put to call open interest ratio | 1.27 |
| Call gamma | 6.57 billion |
| Put gamma | negative 7.44 billion |
| Gamma tilt | 1.527 |
| Total gamma notional | 1.456 billion dollars |
| Top gamma expiration | 20 August, ahead of the 21 August monthly |
| Closed customer position | 15,000 long calls at cash 7,700 |
| Skew rank | 97.21 per cent |
| 25-delta risk reversal | negative 0.036 |
| Reference | Value |
|---|---|
| Low band | 7,700 to 7,731 |
| Most likely | 7,755 to 7,810, roughly 60 per cent |
| High band | 7,828 to 7,886 |
| Overnight expectation | 7,745 to 7,795 |
| Path | Probability and description |
|---|---|
| Path A, bullish continuation | 55 per cent. Holds above 7,745, clears 7,786.00, closes 7,810 to 7,850 |
| Path B, range and chop | 27 per cent. Between 7,730 and 7,786, closes 7,745 to 7,785 |
| Path C, corrective reversal | 18 per cent. Pivot fails, works to 7,693 and the 7,667.67 projection, closes 7,660 to 7,700 |
| Reference | Value |
|---|---|
| Entry zone | 7,740 to 7,760 |
| Preferred fill | 7,750 |
| Stop | 7,715, placed 11.83 below the pivot |
| Risk | 35 points |
| Target 1 | 7,786.00, plus 36 points, 1.0 to 1 |
| Target 2 | 7,824.67, plus 74.67 points, 2.1 to 1 |
| Target 3 | 7,863.17, plus 113.17 points, 3.2 to 1 |
| Reference | Value |
|---|---|
| Trigger | two consecutive 15-minute closes below 7,726.83 after 10:00 |
| Entry zone | 7,715 to 7,725 on a retest from below |
| Stop | 7,752 |
| Risk | approximately 32 points |
| Target 1 | 7,693.60, plus 26 points |
| Target 2 | 7,667.67, plus 52 points, 1.6 to 1 |
| Target 3 | 7,609.52 to 7,608.19, plus 111 points, 3.5 to 1 |
| Invalidation | a 15-minute close back above 7,762 |
| Time | Event |
|---|---|
| 08:15 | Private employment change, 65,000 expected, 98,000 prior |
| 08:30 | Quarterly refunding announcement, no consensus |
| 09:45 | Final services and composite surveys, both 53.6 |
| 10:00 | Services survey: headline 54.5 against 54.0, prices paid 65 against 67.7, employment 51 against 51.2 |
| 10:30 | Official crude inventories, 1.5 million draw expected, 7.167 million prior draw |
| 16:05 | A Federal Reserve governor speaks |
| 02:45 to 05:00 | European finals: French industrial production, French services, euro area composite, UK composite and services, euro area producer prices 4.6 per cent against 5.9 |
| Reference | Value |
|---|---|
| Thursday 08:30 | Initial claims 205,000 expected against 197,000; unit labour costs 2.1 per cent against 1.8 |
| Friday 08:30 | Payrolls 80,000 expected, unemployment 4.2 per cent, hourly earnings 0.3 per cent |
| 12 August | Consumer price report, four sessions before the 21 August expiration |
| Reference | Value |
|---|---|
| Chip designer, adjusted earnings | 1.66 dollars against 1.62 expected |
| Chip designer, revenue | 11.54 billion against 11.31 billion expected |
| Chip designer, adjusted operating income | 3.09 billion dollars |
| Chip designer, share reaction | down roughly 7 per cent, trading near 480, approaching a 460 dealer level |
| Space and connectivity, loss per share | 0.09 dollars against an expected 0.24 loss |
| Space and connectivity, revenue | 7.8 billion against 6.81 billion expected |
| Space and connectivity, adjusted EBITDA | 3.5 billion against 2.0 billion expected |
| Space and connectivity, share reaction | down roughly 5 per cent against a 14 per cent implied move |
| Space and connectivity, positioning | approaching a 100 put-side level, about 27,000 customer short puts at 95, lockup expiry 6 August |
| Reference | Value |
|---|---|
| Semiconductor sector | up 7 per cent, largest four-day advance since 2020 |
| Nasdaq | up 3 per cent |
| Data analytics large cap | up 30 per cent on earnings |
| Job openings | 7.359 million against 7.4535 million expected, 7.594 million prior |
| Factory orders | down 0.3 per cent against an expected 0.2 per cent gain |
| Most recent policy vote | 9 to 3, three dissenters favouring a 25 basis point increase |
| Industry crude estimate | crude build 2.7 million against an expected 2 million draw |
| Cushing | build 2.4 million |
| Gasoline | build 0.2 million |
| Distillates | draw 1.2 million |
| Yen intervention | suspected 30 and 31 July |
| Vessels assisted through the Strait | more than 1,000 over three months |
| Futures level | Cash equivalent |
|---|---|
| Futures 8,027.15 | cash 8,000 |
| Futures 7,981.67 | cash 7,953 |
| Futures 7,922.81 | cash 7,894 |
| Futures 7,901.79 | cash 7,873 |
| Futures 7,883.83 | cash 7,855 |
| Futures 7,863.17 | cash 7,834.5 |
| Futures 7,824.67 | cash 7,796 |
| Futures 7,786.00 | cash 7,757.5 |
| Futures 7,783.25 | cash 7,755 |
| Futures 7,765.50 | cash 7,737 |
| Futures 7,762.90 to 7,761.25 | cash 7,734 to 7,733 |
| Futures 7,726.83 | cash 7,698 |
| Futures 7,693.60 | cash 7,665 |
| Futures 7,677.15 | cash 7,650 |
| Futures 7,667.67 | cash 7,639 |
| Futures 7,609.52 to 7,608.19 | cash 7,581 to 7,580 |
| Futures 7,569.83 | cash 7,541 |
| Futures 7,555.00 | cash 7,526.5 |
| Futures 7,543.03 | cash 7,514.5 |
| Futures 7,522.15 | cash 7,495 |
| Futures 7,510.67 | cash 7,482 |
| Futures 7,470.15 | cash 7,443 |
| Futures 7,427.15 | cash 7,400 |
| Reference | Value |
|---|---|
| Dense support base | the 7,530 to 7,540 zone, roughly 240 points away |
| Stated risk pivot below spot | 255 points |
| Gamma concentration strike above spot | 260 points |
| Qatar drafting report crossed | 06:44 ET |
| Treasury Secretary comment | 07:43 ET |
| Dealer reference structure published | 16:51 ET Tuesday |
| Friday payroll prior | 57,000 |
| A single one-range down day | returns price to 7,660, still 125 points above the 20-day |
| Cash open reference | 7,765 is the settle rounded, first support in cash terms 7,737 |
| Expected window for the entry test | between 09:45 and 11:00 if the open is soft |



