
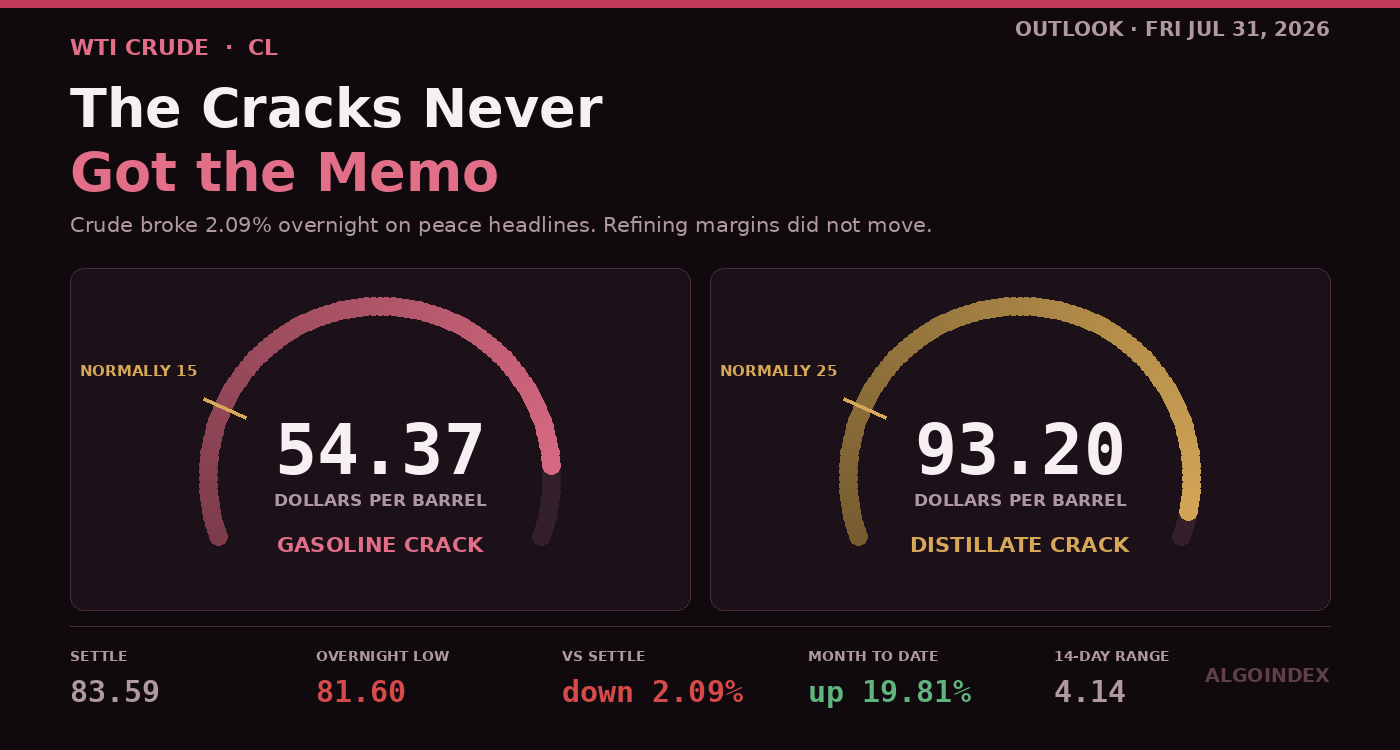
Do the arithmetic on Thursday's settlements and you get two numbers that should stop anyone thinking about shorting this market. A gallon of gasoline at 3.2847 is 137.96 a barrel. Measured against crude at 83.59, that leaves a gasoline crack near 54.37. Diesel at 4.2094 works out to 176.79 a barrel, so its crack sits around 93.20.
Ordinarily gasoline runs in the teens and distillate in the twenties.
Both figures are computed rather than quoted, and both are extraordinary by any historical standard. What they say is that the shortage downstream has not eased by even a little. Peace headlines are selling crude. They are not selling what gets refined out of it, which means anyone short the one is up against a complex still pricing genuine shortage.
What actually happened
Thursday looked quiet and was not. The contract opened 84.65, reached 85.94 early, then ground lower all day to bottom at 82.97 before closing 83.59, which is the lower third of the range. That is two sessions running where sellers owned the afternoon. Total travel measured 2.97. True range on the 14-day setting is 4.14. So Thursday contracted, compressing instead of resolving.
Resolution arrived after the bell. The reopen came at 83.92, poked 84.32, then broke hard, reaching 81.60 and trading near 81.84. That is 2.09 percent under the settlement, and it puts price under Thursday's low and under pivot support at 82.39 as well. What the day session would not do, the overnight did.
The half-hour structure through Thursday afternoon shows exactly what was building. Once 82.97 printed, the market chopped a corridor of roughly 83.30 to 84.90. Highs came in lower each time: 84.86, then 84.52, then 84.39, then 84.28, over a base sitting flat around 83.45. Compression under resistance, in a contract whose fundamental support was draining away. Near 20:00 a single half-hour bar ran from 83.54 all the way down to 82.09, clearing the prior low in one motion.
Five months of premium, coming out
None of this is mysterious. For something like five months the Strait has been mostly shut, and that one fact carried this contract out of the fifties and into the mid-nineties across this year. July 23 saw 93.50 print. May produced a 95.30 high. What is unwinding now is that premium.
Thursday brought a steady drumbeat. Talks with Muscat over the Strait were described as continuing rather than stalled. More consequentially, reporting suggested a Strait agreement might open the door to removing the blockade and lifting sanctions on oil. Traffic through the passage picked up. Egypt denied in public that it held Iran responsible for a drone strike on two ships at Damietta, while Iran's foreign minister called Egypt an important partner whose security matters. A flashpoint that might have widened the conflict got defused in public.
That sanctions line is the one carrying price implications. Barrels are being held off the water by the blockade and by sanctions, and a believable route to ending either is worth several dollars on its own.
One nuance deserves attention though. Transit through the Strait has picked up while Gulf exports have not recovered in proportion. That gap suggests the bottleneck is as much logistical and contractual as military, which means a resolution puts barrels back more slowly than the headlines imply. Saudi Arabia illustrates the incentive: output down, revenue up, and a quarterly budget deficit that shrank by nearly three quarters. Producers able to load have been winning from scarcity, which does not make them eager to see it end. Thursday sat one session on from the inventory build that ran nine million barrels past consensus, covered in our July 30 crude review, and the market has spent the two sessions since deciding which story it believes.
The contradiction that defines Friday
Here is what makes this difficult. Price is in a violent impulse lower, and it is falling into its own moving averages rather than away from them.
Three averages sit stacked underneath: 79.96 on the 20-day, 80.05 on the 50-day, 81.56 on the 100-day. A band 1.60 points wide, with the overnight print resting right on it. Overhead there is only a 5-day of 82.58. Beneath the band the next references sit remote: 78.18 on the 40-day, then 70.87 far below on the 200-day, which means failing there opens a genuinely large gap.
The direction measures lean the same way. Take the 14-day window: its positive line prints 28.81, its negative line 20.21, strength 28.23. The 9-day reads 37.36 and climbing, which signals trending rather than ranging, and there too the positive line sits over the negative. Every window measured still favours buyers.
Momentum agrees. Relative strength prints 52.99, 53.66 and 53.07 across the 9, 14 and 20-day lookbacks, which after a seven percent week is a genuinely odd reading and a measure of how stretched this market was before the correction started. Nothing here is oversold. Stochastics on the short windows, down in the low thirties, are heading toward washed out without arriving.
So on tonight's evidence the honest label is a correction within a bigger advance, not a reversal anyone has confirmed. The higher-low sequence built up from 67.12 has been bent by the overnight break but not broken: The 81.60 print holds over July 29's 79.92 low, and sits comfortably clear of the 77.78 washout from July 28. Closing beneath those, in that order, is what it would take to call the July advance finished.
Where Friday gets decided
Two support zones matter, and they are close together.
The first runs 81.00 to 81.21, where the 18-day average, second pivot support and the 13-week midpoint all land. Three independent methods on the same handle makes that the first quality support of the session, and it should be tested before New York even opens.
The second is the real one. Between 79.96 and 80.15 sit the 20-day average, the 50-day, third deviation support and a 61.8 percent retracement from the annual low. Nowhere on this chart is support denser, which makes it the natural spot for the decline to pause, especially with a weekend of unresolved geopolitical risk ahead. Immediately under it, a third pivot support of 79.42 marks the line whose failure would say this has turned into something bigger.
Overhead, the map is equally specific. That broken pivot at 82.39 converts to first resistance. Reclaiming 82.97, Thursday's low, matters most near term, with 83.01 reinforcing it where momentum returns to its midpoint. Then 83.59, the settlement, which divides an ordinary pullback from a breakdown that failed, with the daily pivot at 84.17 and the overnight high at 84.32 capping any recovery.
The trade
Sell a retest, do not chase the break. Entry sits between 82.40 and 82.90, taken when price comes back up into it from underneath, midpoint 82.65. Nothing gets sold below 81.60. Stop 83.70, above both the settlement and the crossover stall at 83.27, because reclaiming the prior settle says the break was not genuine. Targets are 81.20, then 80.15, then 79.42. Risk of 1.05 from the midpoint pays roughly 1.38, 2.38 and 3.08 to one.
Acceptance over 83.59 on a thirty-minute basis invalidates it. Clear 84.32 and the idea is dead outright, since at that point the overnight was a flush of liquidity and not a repricing.
If instead the market reaches that dense band and rejects it, the long is available. Buy the 80.00 to 80.30 pocket, but only against evidence: a thirty-minute bar that completes and closes back over 80.30 having traded under it first. Stop 79.30, below that third pivot, working 81.20, then 82.40, then 83.30. Risk of 0.85 for roughly 1.24, 2.65 and 3.71 to one. The case for it is the one this article opened with: neutral momentum, direction measures still favouring buyers, and cracks pricing a physical market that has not loosened.
Weighting the outcomes: lower and orderly, testing 81.00 to 81.21, bouncing into the supply zone, failing there and working down toward the average band by the afternoon, takes 50 percent. Rejection and recovery, where the overnight turns out to be a flush of exhaustion and price reclaims 82.97 then 83.59, takes 30, and and it becomes the dominant path the instant any headline reports negotiations breaking down or a fresh strike landing. A disorderly break through both bands in one session takes 20, and it would need a concrete de-escalation announcement.
One window, and a month ending
Friday carries no inventory report and no producer meeting, which throws disproportionate weight onto headline flow. A cabinet meeting is tentatively set for 10:00, and that is the first-order event for this contract. Not that it is an energy release. It is that every crude headline of consequence over the past ten days has come from that direction. A word on the Strait, on the blockade, on sanctions relief, and this market travels several dollars inside seconds. Be flat across it, or close to it.
An integrated major reports at 06:15, before the open, with consensus near 5.65 a share on 65.31 billion of revenue. One company will not shift the curve, though what it says about output, about refining margins and about regional operations can colour sentiment right across the complex.
Month end matters too. July closed with crude up nearly 20 percent, and rebalancing tends to sell whatever won, leaving a mild extra headwind into the bell. Set against that, holding a short over a weekend when a Strait agreement could land is poor risk. Cut short exposure substantially into the bell whether or not it is working.
Three provenance notes. The crack figures are arithmetic computed from captured settlements, not vendor-published quotes. That customary Friday rig count was absent from the calendar as captured, so treat it as unconfirmed instead of scheduled. And collection happened around 22:05 to 22:10 Eastern, roughly five hours after the intended window following a browser outage, with the overnight actively falling throughout, so the live price will have moved by the time anyone reads this.
The setup reduces to a single tension. Flat price says the premium is coming out and the easiest direction is down until something dense halts it. The product complex says the physical shortage that created the premium is entirely intact. Either the cracks compress hard in the coming sessions, which confirms the bearish case and probably accelerates it, or crude stabilises and converges back up toward the products. Trade the retest, respect the band, and watch which of those two resolves first.
The complete data picture
Every number behind Friday’s plan, charted first; the full numeric reference follows underneath.
Full numeric reference , every remaining figure from the review
| September settlement | 83.59, down 87 cents or 1.03 percent |
| Session shape | opened 84.65, high 85.94, low 82.97, range 2.97 |
| Globex reopen | opened 83.92, probed 84.32, broke to 81.60, near 81.84 at roughly 22:10 ET |
| Change against settle | down 1.75, or 2.09 percent |
| Resolution bar | approximately 20:00 ET, 83.54 down to 82.09 |
| Afternoon corridor | 83.30 to 84.90, base near 83.45 |
| Lower highs | 84.86, then 84.52, then 84.39, then 84.28 |
| Wednesday's advance | 5.20 |
| Month open / low | 69.27 on the open, 67.12 on July 2 |
| July 23 high | 93.50, better than 39 percent off the low in three weeks |
| Contract high | 95.30 in May |
| Post-high sequence | 92.19 close, 89.31, 82.61, 77.78 washout July 28, 84.46 recovery July 29 |
| Month to date | up 13.72 points, or 19.81 percent |
| Five days | down 6.32, or 7.08 percent |
| Fifty days | down 11.43, or 12.11 percent |
| Distance below recent high | 11.24 percent |
| New highs and lows | ten new highs on the month; one new high and two new lows over five days |
| Swing highs since July 23 | 93.50, 92.83, 86.20, 85.57, 85.94 |
| Swing lows | 87.32, 81.63, 77.78, 79.92, 82.97 |
| 5-day | 82.58, with price at 81.84 beneath it |
| 18-day | 81.02 |
| 20-day | 79.96 |
| 40-day | 78.18 |
| 50-day | 80.05 |
| 100-day | 81.56 |
| 200-day | 70.87 |
| Year-to-date average | 75.58 |
| Compressed band | 79.96 to 81.56, a span of 1.60 points |
| Relative strength | 9-day 52.99, 14-day 53.66, 20-day 53.07, 50-day 52.41, 100-day 52.83 |
| Raw stochastic | 9-day 33.14 percent, 14-day 34.76 percent, 20-day 59.07 percent |
| Stochastic %K | 9-day 37.53, 14-day 49.31, 20-day 62.41 |
| Stochastic %D | 9-day 31.57, 14-day 49.89, 20-day 59.10 |
| Directional index, 9-day | 37.36, positive line 28.67, negative line 21.43 |
| Directional index, 14-day | 28.23, positive line 28.81, negative line 20.21 |
| Directional index, 20-day | 20.40 |
| Multi-indicator composite | 16 percent buy; short term 40 percent buy, medium term 25 percent sell, long term hold |
| Average true range | 9-day 4.28 (5.16 percent), 14-day 4.14 (4.99 percent), 20-day 4.05 (4.88 percent), 50-day 3.73 |
| Average daily range | 9-day 4.36 (5.25 percent), 14-day 4.01 (4.83 percent), 20-day 3.84 |
| Historic volatility | 9-day 70.85 percent, 14-day 59.74 percent, 20-day 60.16 percent, 50-day 50.82 percent |
| One range day from 81.84 | 77.70 to 85.98 |
| One range day from the 84.17 pivot | 80.03 to 88.31 |
| 82.39 | first pivot support, now broken, first resistance on any recovery |
| 82.97 | Thursday's session low, the key near-term reclaim |
| 83.01 | where the 14-3 day raw stochastic returns to 50 percent |
| 83.27 | where the 3-10 day moving average crossover stalls |
| 83.42 | 38.2 percent retracement of the four-week high |
| 83.59 | Thursday's settlement |
| 83.82 | computed target price |
| 84.17 | daily pivot |
| 84.32 | overnight high |
| 84.54 / 84.58 | 38.2 percent retracement from the thirteen-week high; where the 14-day %k stalls |
| 85.32 / 85.36 | where price crosses the 9-day average; first pivot resistance |
| 85.57 / 85.94 | one standard deviation resistance; Thursday's high |
| 86.40 / 87.03 | two and three standard deviations |
| 87.14 / 88.33 | further pivot resistance |
| 81.60 / 81.61 | overnight low; one standard deviation support |
| 81.02 / 81.20 / 81.21 | 18-day average; second pivot support; 50 percent retracement of the thirteen-week range |
| 80.50 / 80.31 | where the 14-day relative strength returns to 50; 50 percent retracement of the four-week range |
| 80.09 / 80.15 | 61.8 percent retracement from the 52-week low; three standard deviations support |
| 79.96 / 80.05 | 20-day and 50-day averages, the densest band on the chart |
| 79.42 | third pivot support |
| 79.92 / 77.78 | July 29 swing low; July 28 washout low |
| 78.18 / 67.12 | 40-day average; the monthly low, with very little between |
| Brent | 89.03, down 1.71 or 1.88 percent; October quoted near 86.06 |
| NYMEX diesel, August | 4.2094 per gallon |
| NYMEX gasoline, August | 3.2847 per gallon |
| NYMEX natural gas, September | 2.7580 per million British thermal units, essentially unchanged at 2.760 |
| Gasoline | 3.2847 times 42 gallons gives 137.96 per barrel, less 83.59, a crack near 54.37 |
| Distillate | 4.2094 times 42 gallons gives 176.79 per barrel, less 83.59, a crack near 93.20 |
| Normal conditions | gasoline cracks in the teens, distillate cracks in the twenties |
| Upstream windfall estimate | 495 billion dollars for the global sector |
| September open interest | 265,946 by one measure, 327,681 on the continuous series |
| Twenty-day average volume | 276,704 |
| Fifty-day average volume | 180,660 |
| Committee decision, July 29 | held, on a 9-3 vote, with all three dissents favouring a 25 basis point increase |
| Core inflation measure | forecast 3.3 percent year over year against a prior 3.4 percent |
| Headline measure | forecast 3.7 percent against a prior 4.1 percent, released 08:30 ET Thursday |
| Saudi position | output lower, revenue higher, quarterly budget deficit down by nearly three quarters in the second quarter |
| Absent upside scenario | five months of closure produced no 150 or 200 dollar print |
| Strait closure | approximately five months |
| Houthi navigation ban | declared on Saudi Arabia July 20 |
| Mediator proposal | a ten-day cessation of strikes |
| Strikes | announced July 29 in response to attacks on American targets in Jordan; joint action without prior notice to Baghdad |
| Chinese official manufacturing | 21:30 ET Thursday, forecast 50.1 against a prior 50.3 |
| Bank of Japan | 23:30 ET Thursday, policy rate expected unchanged at 1 percent |
| Japanese housing starts | 01:00 ET, forecast 12.7 percent year over year against a prior 33.9 percent |
| German import prices | 02:00 ET, forecast 6 percent against a prior 6.8 percent |
| Swiss retail sales | 02:30 ET |
| French preliminary inflation | 02:45 ET, harmonised forecast 2 percent, domestic 1.8 percent year over year |
| Integrated major earnings | 06:15 ET, consensus near 5.65 per share on revenue of 65.31 billion |
| Pharmaceutical major | 07:45 ET |
| Cabinet meeting | tentatively 10:00 ET, the single first-order event |
| Treasury refunding estimates | Monday, August 3 at 15:00 ET |
| Entry | 82.40 to 82.90 on a retest from beneath, midpoint 82.65; no chase beneath 81.60 |
| Stop | 83.70, above the 83.59 settlement and the 83.27 crossover stall |
| Target 1 | 81.20, offering 1.45 for roughly 1.38 to 1 |
| Target 2 | 80.15, offering 2.50 for roughly 2.38 to 1 |
| Target 3 | 79.42, offering 3.23 for roughly 3.08 to 1 |
| Risk | 1.05 from the 82.65 midpoint |
| Invalidation | thirty-minute acceptance above 83.59; dead above 84.32 |
| Entry | 80.00 to 80.30, only on a completed thirty-minute close back above 80.30 |
| Stop | 79.30, beneath third pivot support at 79.42 |
| Target 1 | 81.20, offering 1.05 for roughly 1.24 to 1 |
| Target 2 | 82.40, offering 2.25 for roughly 2.65 to 1 |
| Target 3 | 83.30, offering 3.15 for roughly 3.71 to 1 |
| Risk | 0.85 from the 80.15 midpoint |
| Downside if it fails | 78.18 |
| Path A, 50 percent | tests 81.00 to 81.21, bounces into 82.40 to 82.90, fails, works toward 79.96 to 80.15; settles 80.20 to 81.30 |
| Path B, 30 percent | reclaims 82.97 then 83.59, squeezes toward 84.32 |
| Path C, 20 percent | 81.00 fails without a bounce, the 79.96 to 80.15 band gives way, toward 79.92 and 78.18 |
| Low scenario | 79.40 to 80.15 |
| Most likely | 80.80 to 83.20 |
| High scenario | 83.60 to 84.60 |
| Session rules | no entries before 09:45 ET or after 16:00 ET; stand aside within ten minutes either side of 10:00 ET |



