
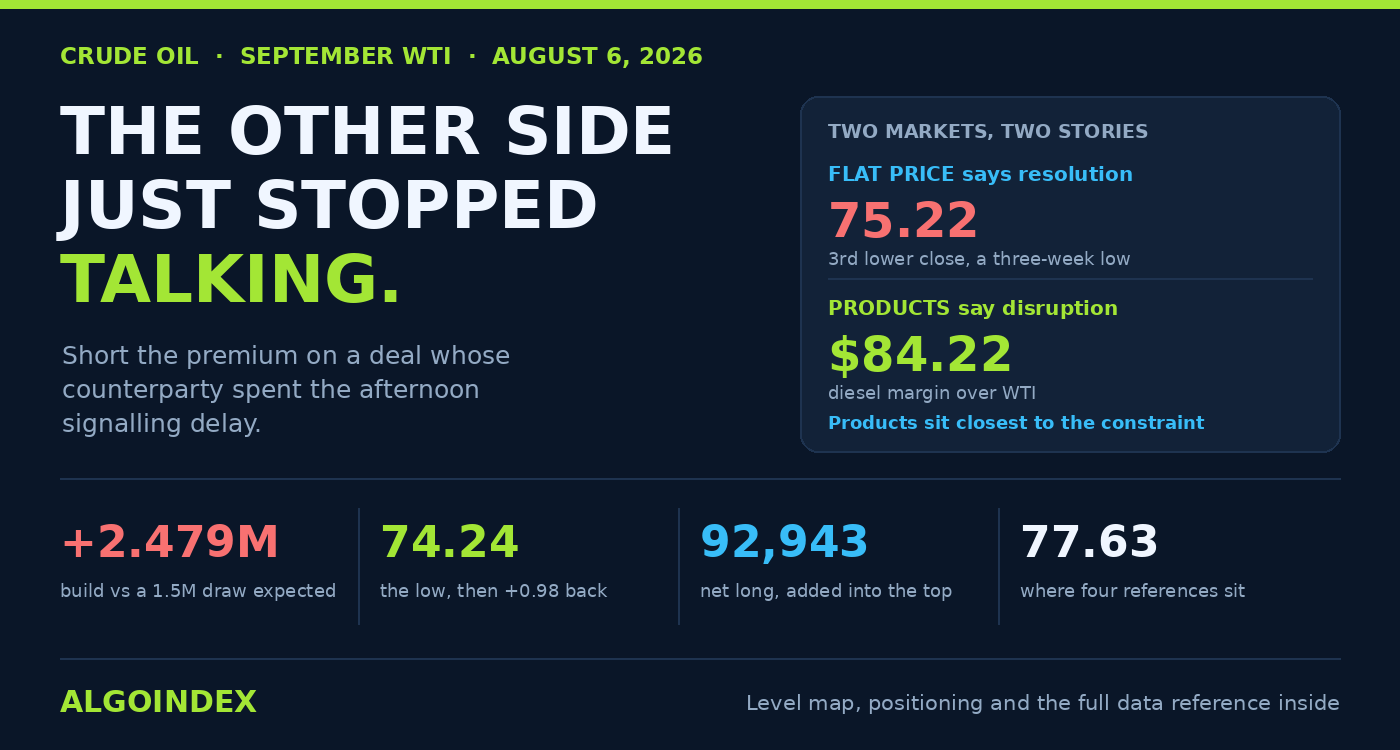
September WTI settled 75.22 on Wednesday, a third straight lower close and the lowest in three weeks. The market is now short a risk premium on the strength of an agreement whose counterparty spent the afternoon publicly signalling delay.
Yesterday the problem was that nobody had signed it. Today? The other side stopped talking.
What the session actually did
The first two days of this decline were one-way liquidation. Wednesday was a fight.
Crude opened 75.17 and worked up to 76.70 through the European morning, trying to steady itself following four sessions that had taken 9.39 points out of it. Then inventories landed at 10:30 and it broke hard, printing a fresh three-week low at 74.24. And then it came back 0.98 into the settle, finishing at 39.8 per cent of the daily range.
Note that. The recovery off the low, coming as it did after a bearish inventory surprise had just taken the contract to a new three-week low, is the most informative single thing that happened all day.
The inventory miss
Stocks built by 2.479 million barrels on the week. Forecasters had wanted a draw of 1.5 million. Miss the forecast by 3.98 million barrels, swing 9.65 million from the prior week's 7.167 million draw, and that is your afternoon.
That was the day's decisive bearish surprise, arriving at a market which had already absorbed two heavy sessions of losses. And price absorbed it and still closed nearly a dollar off the low. Worth holding onto that.
The counterparty is signalling delay
Here is what changed while the flat price kept falling.
Earlier in the week, wires had Omani and Iranian negotiators settling a draft that would reopen the waterway, subject to the Iranian supreme leader signing off. A separate report described an interim 60-day arrangement, no tolls or fees, with separated inbound and outbound lanes. That is what the flat price has spent the week discounting.
Then came the afternoon. Iran's president, speaking on state television, described interaction with that same leader as very difficult right now. A deputy foreign minister added that no talks with Washington had taken place in recent days, which is the flattest possible way of saying the process has gone quiet. On whether a second round of discussions would follow, Tehran said nothing had been decided.
Meanwhile Houthi forces said they had put a ballistic missile into a Saudi tanker in the Gulf of Aden, adding that every Saudi tanker movement is now being watched.
So the flat price is positioned for completion. The physical product complex still prices active disruption. Meanwhile the diplomatic track stalled visibly during the session that took crude to a three-week low.
The structure is intact anyway
None of that rescues the chart, and it shouldn't be read as a reason to be long.
Price trades beneath a 5-day of 79.89, a 20-day of 81.00, a 50-day of 79.33 and a 100-day of 81.58. One average alone sits underneath it: the 200-day, 71.17. Settlement landed 0.40 beneath the average price for the year so far, 75.62, and a full 5.78 beneath that 20-day.
The composite prints 56 per cent sell, strengthening, medium-term studies on 75 per cent sell, the long-term group 67. Every measured period has negative direction on top.
One recovery close doesn't challenge any of that.
Oversold, and turning
The stochastic complex is where this gets interesting. Nine-day raw reads 4.46 per cent, fourteen-day 4.31. Both sit within five per cent of the bottom of their measurement range.
Direction of travel matters more here than the level itself. In the prior session that fourteen-day figure read 1.36 per cent. It has since lifted to 4.31, a first upturn, and did it while price was busy printing a new low. Momentum divergence, and it agrees with how the session closed.
The slow lines agree: %K of 8.08 against %D of 22.63 at fourteen days, and 29.56 against 44.32 at twenty.
Relative strength is soft rather than extreme. Nine-day at 37.93 is the only reading approaching genuinely stretched. At 42.63, the fourteen-day sits well clear of that sub-30 zone where capitulation lives, having fallen just 0.84 across the session. The fifty and hundred-day readings sit at or near 50, which says a sharp correction is under way in a market that has not broken on the multi-month view.
Trend strength is fading, not building. Nine-day directional strength has rolled from 31.67 down to 30.74. Negative direction still dominates at every window, 28.63 against 17.89 at nine days, but by twenty days the gap has narrowed to 24.21 against 22.06. That is intensity draining out of a trend, not building.
Where the levels sit
First ceiling is 75.40, halfway across the whole 52-week range. Two consecutive sessions have failed there now, which turns a retracement marker into live supply.
Just above, 75.62 and 75.77 form a pocket 37 cents wide. Thin. It should resolve fast one way or the other rather than hold.
Above sits 76.70, Wednesday's high, which capped the day's distribution. Should any Thursday recovery stall under it, the descending run of lower highs is confirmed. Above it lies a genuine void running all the way to 77.63. That gap is precisely why selling a recovery beats chasing weakness here.
Dense architecture then occupies 77.63 up to 77.88, packing four independent references into 25 cents: a 40-day of 77.70, the four-week-low retracement at 38.2 per cent, 77.74 for the session pivot, plus 38.2 per cent taken off the 13-week low instead. Two sessions without reaching that band makes clearing it at the first attempt unlikely.
Beneath, 74.24 has been tested once already and rejected on a 0.98 recovery, which gives it a defensive record rather than being untested. Below it, 73.63 and 73.14 sit 49 cents apart as the first real objective band.
The zone that actually matters runs from 71.38 down to 70.52, where a 200-day of 71.17, an 18-day crossover stall on 71.34 and one-deviation support of 71.38 all fit within 21 cents. That is where a multi-month decision gets made. It sits roughly one average true range beneath the settle, so one extreme session could reach it, though nobody should treat it as a same-day objective.
How to trade it
Sell strength. Don't chase weakness.
Entry between 76.60 and 77.30, filling ideally at 76.95, sitting above Wednesday's high and under that four-reference confluence, inside that void, where a rally finds nothing to slow it and plenty above to halt it.
Stop 77.95, clearing all four of those references, because trading through all four means the character has changed and the position is simply wrong. Risk works out at a dollar from the preferred fill. Targets 75.40, then 74.24, then 73.63, and 73.14 as an extension should the market accept beneath 74.24. Roughly 1.6, 2.7 and 3.3 to one.
Hold a 30-minute close over 77.88, or accept above 79.89 where the 5-day sits, and it ends. Both say the same thing: this recovery became a change of trend rather than a retracement.
A conditional long exists only on a confirmed hold. Buy 75.85 to 76.10, stop 74.90 which sits under both the pocket and a 74.87 post-settlement consolidation low, then aim 76.70, 77.63, 78.79.
Why conviction stays low
Nothing energy-specific is on Thursday's calendar, which leaves the headline as the dominant variable for a second consecutive session.
That cuts both ways, and it is deliberate that this review carries a bearish bias at low conviction rather than a confident one. Oversold readings at their deepest in months, participation off 21 per cent, and a diplomatic track that just stalled in public all make a violent counter-move plausible inside a structure that remains firmly bearish.
Being right about direction and wrong about timing costs the same as being wrong.
Yesterday this contract was priced for an agreement nobody had signed. Today the counterparty went quiet: Crude Oil (CL): priced for a deal nobody has signed.The complete data picture
Every number behind Friday’s plan, charted first; the full numeric reference follows underneath.
Full numeric reference , every remaining figure from the review
Full data reference
Every figure behind the analysis above. September WTI, session of Wednesday 5 August 2026, prepared for Thursday 6 August. Dollars per barrel.
| Reference | Value |
|---|---|
| Settlement | 75.22, down 0.55 or 0.73 per cent |
| Sequence | the third consecutive lower settlement, lowest close in three weeks |
| Open | 75.17 |
| Session high | 76.70 |
| Session low | 74.24, a fresh three-week low |
| Recovery off the low | 0.98 |
| Close position in range | 39.8 per cent |
| Prior four-session collapse | 9.39 points |
| Post-settlement consolidation low | 74.87 |
| Participation | down 21 per cent |
| Reference | Value |
|---|---|
| Actual | a build of 2.479 million barrels |
| Forecast | a draw of 1.5 million barrels |
| Miss against forecast | 3.98 million barrels |
| Prior week | a draw of 7.167 million barrels |
| Week-over-week swing | 9.65 million barrels |
| Release time | 10:30 ET |
| Reference | Value |
|---|---|
| 50 per cent of the 52-week range | 75.40, failed on two consecutive sessions |
| Year-to-date average price | 75.62 |
| Prior settlement | 75.77 |
| Session high | 76.70 |
| 38.2 per cent off the 4-week low | 77.63 |
| 40-day average | 77.70 |
| Session pivot | 77.74 |
| 38.2 per cent off the 13-week low | 77.88 |
| 14 to 3 day stochastic at 20 per cent | 78.79 |
| 50-day average | 79.33 |
| 5-day average | 79.89 |
| 61.8 per cent off the 52-week low | 80.09 |
| 1 deviation of resistance | 80.16 |
| 1st pivot resistance | 80.36 |
| Where 14-day strength reaches 50 | 80.41 |
| 14 to 3 day stochastic at 30 per cent | 80.63 |
| 50 per cent of the 4-week range | 80.66 |
| 20-day average | 81.00 |
| 50 per cent of the 13-week range | 81.21 |
| 100-day average | 81.58 |
| 2nd pivot resistance | 84.96 |
| 3rd pivot resistance | 87.58 |
| One-month high | 93.50 |
| 52-week high | 95.30 |
| Reference | Value |
|---|---|
| Session low | 74.24, tested once and rejected |
| Calculated downside target | 73.63 |
| 1st pivot support | 73.14 |
| 1 deviation of support | 71.38 |
| 18-day crossover stall | 71.34 |
| 200-day average | 71.17 |
| 38.2 per cent off the 52-week low | 70.70 |
| 2nd pivot support | 70.52 |
| 3 to 10 day crossover stall | 69.97 |
| 2 deviations of support | 69.57 |
| 3 deviations of support | 68.17 |
| One-month low | 67.82 |
| 13-week low | 67.12 |
| Reference | Value |
|---|---|
| Below the 5-day | 79.89 |
| Below the 20-day | 81.00, some 5.78 above |
| Below the 50-day | 79.33 |
| Below the 100-day | 81.58 |
| Above the 200-day | 71.17 |
| Against the year-to-date average | 0.40 below 75.62 |
| Reference | Value |
|---|---|
| Relative strength 9-day | 37.93 |
| Relative strength 14-day | 42.63, down 0.84 |
| Relative strength 20-day | 44.77 |
| Relative strength 50-day | 48.37 |
| Relative strength 100-day | 50.28 |
| Raw stochastic 9-day | 4.46 per cent |
| Raw stochastic 14-day | 4.31 per cent, up from 1.36 the prior session |
| 14-day %K and %D | 8.08 against 22.63 |
| 20-day %K and %D | 29.56 against 44.32 |
| Reference | Value |
|---|---|
| 9-day | index 30.74, down from 31.67; positive 17.89, negative 28.63 |
| 14-day | index 23.81, positive 20.95, negative 25.74 |
| 20-day | index 17.98, positive 22.06, negative 24.21 |
| Multi-indicator composite | 56 per cent sell, direction strengthening |
| Short-term studies | 40 per cent sell |
| Medium-term studies | 75 per cent sell |
| Long-term studies | 67 per cent sell |
| Of thirteen studies | trend signal neutral, the 20 to 50 day crossover the sole buy, three neutral, eight sell |
| Reference | Value |
|---|---|
| Earlier in the week | Iranian and Omani negotiators finalised a draft to reopen the waterway, awaiting the supreme leader's approval |
| Reported arrangement | an interim 60-day accord, no tolls or fees, separated inbound and outbound lanes |
| Wednesday afternoon | Iran's president said interaction with the supreme leader is currently very difficult |
| Wednesday afternoon | the deputy foreign minister stated no talks with the United States in recent days |
| Wednesday afternoon | Iran said no decision taken on a second stage of discussions |
| Wednesday afternoon | Houthi forces claimed a ballistic missile strike on a Saudi tanker in the Gulf of Aden |
| Stated posture | monitoring all Saudi tanker movements |
| Reference | Value |
|---|---|
| Entry zone | 76.60 to 77.30 |
| Preferred fill | 76.95 |
| Stop | 77.95, above the entire 77.63 to 77.88 confluence |
| Risk | 1.00 from the preferred fill |
| Target 1 | 75.40, roughly 1:1.6 |
| Target 2 | 74.24, roughly 1:2.7 |
| Target 3 | 73.63, roughly 1:3.3, with 73.14 as an extension |
| Invalidation | a sustained 30-minute close above 77.88, or acceptance above 79.89 |
| Reference | Value |
|---|---|
| Entry | 75.85 to 76.10 on the confirmed hold |
| Stop | 74.90 |
| Targets | 76.70, then 77.63, then 78.79 |
| Time | Event |
|---|---|
| 02:00 | German industrial orders |
| 04:30 | UK construction survey |
| 05:00 | Eurozone retail sales |
| 08:30 | Initial claims, 205,000 against 197,000 |
| 08:30 | Unit labour costs preliminary, 2.1 per cent against 1.8 |
| 17:30 | A Federal Reserve speaker, after the close |
| Energy-specific | nothing scheduled |
| Reference | Value |
|---|---|
| 9-day true range | 4.82, 6.42 per cent; daily range 4.59, 6.12 per cent |
| 14-day true range | 4.56, 6.07 per cent; daily range 4.61, 6.14 per cent |
| 20-day true range | 4.37, 5.82 per cent; daily range 4.19, 5.59 per cent |
| 50-day true range | 3.89, 5.18 per cent; daily range 3.70, 4.92 per cent |
| 100-day true range | 3.20, 4.27 per cent; daily range 3.89, 5.18 per cent |
| Historic volatility 9-day | 61.37 per cent |
| Historic volatility 14-day | 68.62 per cent |
| Historic volatility 20-day | 66.17 per cent |
| Historic volatility 50-day | 52.64 per cent |
| Historic volatility 100-day | 50.02 per cent |
| One-range band on the settle | 70.66 to 79.78 |
| Anchored on the pivot of 77.74 | 73.18 to 82.30 |
| Wednesday's realised range | 2.46, only 53.4 per cent of the 14-day average |
| Practical working expectation | a 2.50 to 3.50 point range, roughly 73.80 to 77.30 |
| Reference | Value |
|---|---|
| Brent | 79.45, up 9 cents or 0.11 per cent |
| Brent to WTI spread | 4.23, widened |
| WTI decline in cents | 55 cents on the session |
| Services headline prior and forecast | 54.0 prior against a 54.5 forecast |
| Round-number references | the 80.00 area as full repricing of the reopening scenario |
| Gasoline | 2.8388 per gallon, down 1.34 cents or 0.47 per cent, a multi-month low |
| Gasoline barrel equivalent | 119.23, an implied margin over WTI of 44.01 |
| Diesel | 3.7962 per gallon |
| Diesel barrel equivalent | 159.44, an implied margin of 84.22 |
| Natural gas | 2.6880 per million British thermal units |
| Equity futures | marginally lower post-settlement, no risk-off impulse on crude |
| Reference | Value |
|---|---|
| Managed money long | 193,959 |
| Managed money short | 101,016 |
| Managed money net long | 92,943 |
| Managed money longs added | 6,490 |
| Managed money shorts covered | 22,474 |
| Non-commercial long | 314,992 |
| Non-commercial short | 194,884 |
| Non-commercial net long | 120,108 |
| Non-commercial longs added | 4,810 |
| Non-commercial shorts covered | 33,609 |
| Commercial long | 871,589, reduced by 24,705 |
| Commercial short | 1,030,411, increased by 25,516 |
| Commercial net short | 158,822 |
| Swap dealer shorts added | 24,317, taking the book to 611,072 |
| Timing | three days before the 31 July high of 86.87 and immediately before an 11.12 per cent five-day collapse |
| Volume on the session | 328,624 contracts |
| Trapped length | 6 to 11 points higher than current price |
| Reference | Value |
|---|---|
| Private payrolls | 44,000 against 65,000 forecast and 98,000 prior |
| Services headline | 54.1 against 54.5 expected |
| Services employment | 47.4 against 51.2 |
| Services prices paid | 70.3 against 65.0 forecast and 67.7 prior |
| Composite and services purchasing surveys | 54.5 and 54.6 |
| Services final | 53.6 |
| Friday payrolls forecast | 80,000 against 57,000 prior; private 80,000 against 49,000 |
| Claims forecast | 210,000 area against 197,000 prior |
| Prior settlement references | 80.34 on Monday, the 82.33 high, 55.49 as the 52-week low |
| Additional session markers | 75.8, 75.9, 76.0, 82.3, 28.7, 28.8, 38.4, 45.0, 58.7, 7.1, 11.0, 12.0, 19.0, 23.0, 28.0, 31.0, 38.0 |
| Related readings | 234,391, 242,164, 295,430 as complex volumes |



