
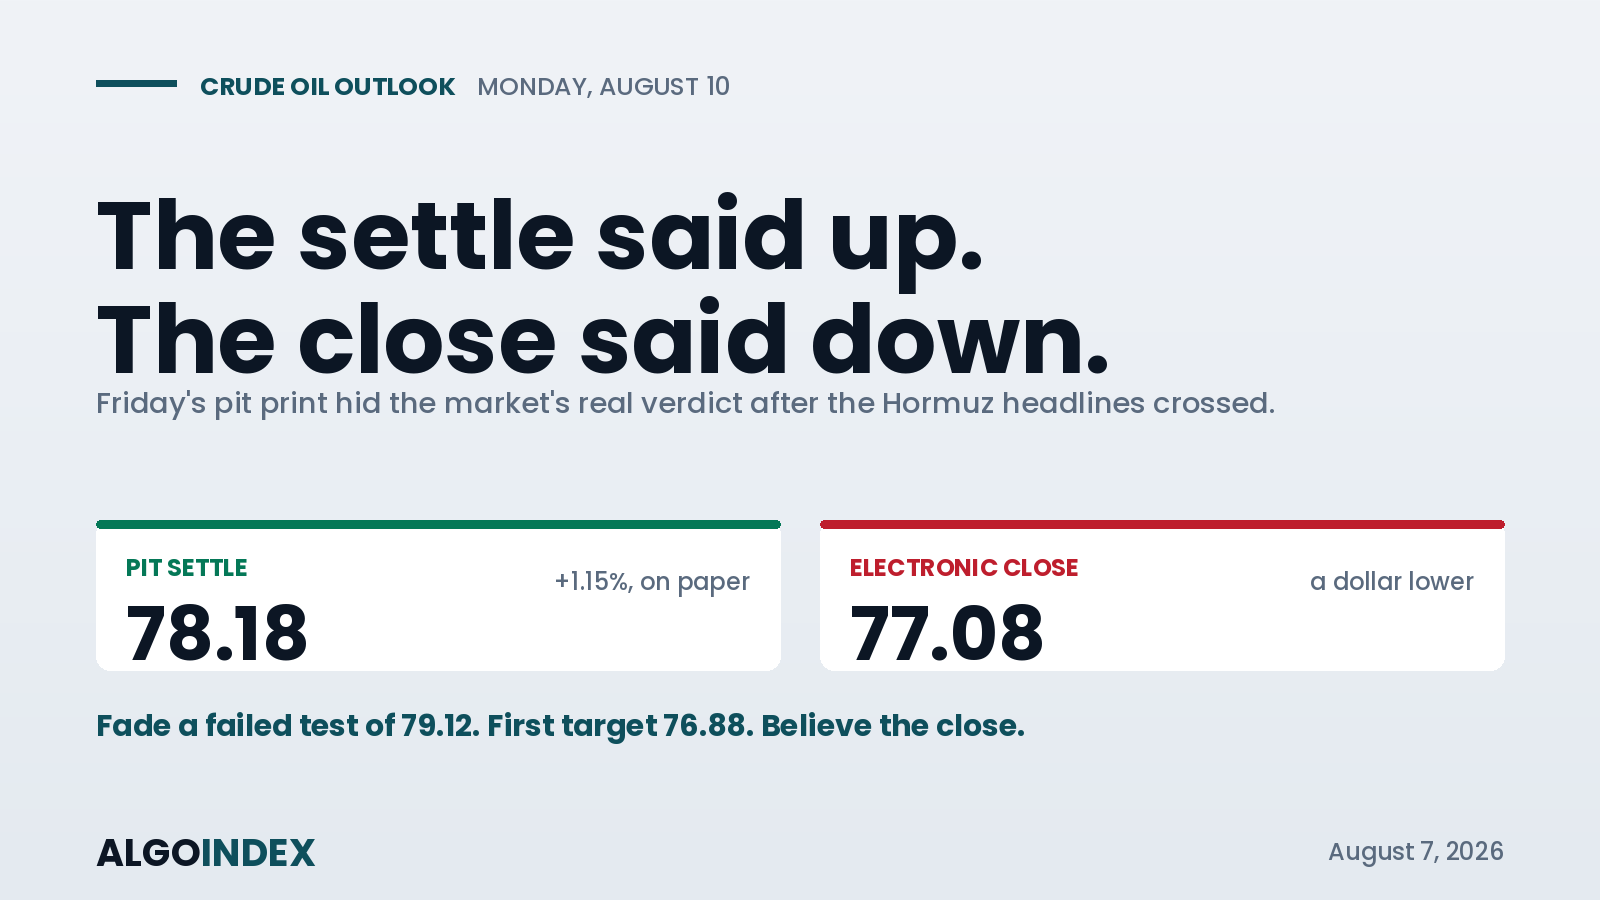
On paper Friday was a good day for crude. Look past the settlement and it wasn't.
September WTI settled at 78.18, up 1.15 percent, a second straight higher close. But the settlement was struck before the day's real news. At 14:52 ET Iran's president said that if pressure and threats stopped there'd be no reason for continued tension, and at 15:00 ET a United States official said there's progress between Oman and Iran on the Strait of Hormuz with a deal expected soon. Those crossed after the pit closed, and the electronic market gave its verdict below the settle, drifting to 77.08, a full dollar lower and 1.69 off the session high. The war premium that Thursday partly restored started leaking out again inside ninety minutes.
Two closes, one verdict
The split between the pit settle and the electronic close is the single most important read in this session. Thursday's electronic close finished 94 cents above its own settlement and within 28 cents of the high, the shape of a market being bought. Friday flipped it, finishing more than a dollar under the settle and well off the high, the shape of a market being sold. And the afternoon break began before the Iranian and United States statements crossed, then completed with them. Someone was cutting exposure ahead of the headline, and the headline just confirmed it.
The stack is not close
Underneath, the structure is plainly heavy. Price sits below the 20-day at 81.62, the 50-day at 79.03, and the 100-day at 81.52, above only the shortest and the longest averages. The multi-indicator composite reads 32 percent bearish. Friday's advance came on 206,437 contracts against a five-day average near 274,000, so the rally wasn't paid for. And the equity market took the other side of the story: energy sector shares fell 1.13 percent on a day the underlying commodity rose more than 1 percent, and they did it while the broad market was strongly higher. Equity investors were telling you they don't believe the bounce.
The premium that is leaking out
Follow the spread to see it clearly. Brent settled at 83.55, holding a 5.37 premium over WTI, and that gap is the market's read on waterborne Gulf risk. Its persistence through a week WTI fell 7.67 percent says the decline was a specific unwind of the domestic risk premium, not a broad liquids repricing. If Monday brings a Hormuz announcement, watch that spread compress from the Brent side faster than WTI falls; it becomes the leading indicator of the move. Price is sitting almost exactly on the prior week's low, and prior-week lows that get tested from above rather than defended from below usually get retested.
The physical disruption is getting worse while the price of that disruption is falling, and the price is the tell.
Oversold enough to make it grind
The one thing that keeps this from being a straight sell is the oscillator complex. The 14-day stochastic is down at 20.5 percent with its percent K at 13.84, deeply washed out, and 14-day relative strength holds a neutral 47.55 despite a 17.96 percent fall from the high, a mild positive divergence. Readings that compressed don't time entries, but they raise the cost of chasing shorts at the lows. So the plan sells strength, not weakness: fade a test of the 78.50 to 79.10 shelf that fails to hold above 79.12, with a stop at 80.15 and targets at 76.88, then 75.59, then 74.64. Any confirmed strike on Iranian energy infrastructure cancels it outright. How we grade a fade like this after the fact is in our performance methodology.
When the settle and the close disagree this loudly, believe the close.
This is the read our members get every session, before the bell, with the levels drawn and the setup defined. See how the same dealer-positioning work turns into systematic signals.
View pricingThe complete data picture
Every number behind Friday’s plan, charted first; the full numeric reference follows underneath.
Full numeric reference , every remaining figure from the review
| Average | Value | Position vs 78.18 |
|---|---|---|
| 5-day | 77.36 | above by 0.82 |
| 20-day | 81.62 | below by 3.44 |
| 50-day | 79.03 | below by 0.85 (first test) |
| 100-day | 81.52 | below by 3.34 |
| 200-day | 71.36 | above by 6.82 |
| Zone | Detail |
|---|---|
| 76.80-77.05 | 43% of intraday activity, heaviest node |
| about 76.00 | 24% intraday node |
| 75.00-76.20 | heavy 4-hour acceptance shelf (149k) |
| about 78.30 | thin shelf, travels fast if reclaimed |
| about 82.00 | broken shelf (133k) |
| 92-93 | old distribution, 62% (not in play) |
| Window | ATR | ATR % | ADR % |
|---|---|---|---|
| 9-day | 4.45 | 5.69% | 5.38% |
| 14-day | 4.35 | 5.57% | 5.62% |
| 20-day | 4.24 | 5.43% | 5.39% |
| 50-day | 3.86 | 4.93% | 4.68% |
| 100-day | 3.20 | 4.09% | 4.96% |
| Input | |
|---|---|
| Hormuz headlines | 14:52 Iran, 15:00 US progress, deal soon |
| US sanctions | +13 entities at 14:35 |
| Nonfarm payrolls | -23,000 vs +80,000 |
| Dollar index | 99.604, -0.36% |
| Energy sector proxy | 57.50, -1.13% (sold into rally) |
| Natural gas | 2.662, +0.83% |
| When | Event |
|---|---|
| Mon 04:30 | Eurozone Sentix -0.5 |
| Tue 12:00 | Short-term energy outlook (tentative) |
| Wed 04:00 / 08:00 | IEA + producer-group monthly reports |
| Wed 08:30 | US CPI 0.1% m/m |
| Wed 10:30 | US crude inventories (prior +2.479M), first-order event |
| Thu 08:30 | US PPI |
Curious how the open interest behind these dealer-positioning levels actually updates? We published a full guide: Options Open Interest vs. Volume: What Each Number Really Tells You.



