On Sunday, August 9, we pulled the clearinghouse's public volume file for SPY options traded the previous Friday. The download ran to 110 data rows. Near the top, one exchange reported 404,451 customer-side call contracts, 2,594 firm-side call contracts, and 378,763 market-maker-side call contracts. Similar rows followed for puts, other exchanges, and adjusted option symbols. The page looked exact down to the last contract. It was also easy to misuse.
The volume file described Friday's transactions. Open interest on an option chain came from a different clock, the prior settlement after opening and closing trades had been paired by the clearinghouse. Put the two columns beside each other and they look like comparable measurements. They aren't. One counts what traded during a period. The other counts what remained open after an earlier clearing cycle. The clearinghouse publishes the timing distinction directly.
That difference matters whenever a trader reads a busy strike, chooses an option for execution, or uses open interest to estimate dealer gamma. A volume spike can't tell you how many new positions were created. Large call open interest can't tell you whether the market is bullish. Neither number, by itself, identifies what market makers own. This guide explains the accounting beneath both fields, then shows what each can support without forcing it to answer a question it was never built to answer.
Two numbers, two clocks
Options volume is transaction activity. If 50 contracts trade, volume increases by 50, whether those contracts opened positions, closed positions, or transferred an existing position from one trader to another. The count starts fresh for the selected reporting period, usually the trading day on a retail chain.
Open interest reports contracts that remain outstanding in a specific option series after positions, exercises, assignments, and expirations have been processed. A series means one underlying, option type, strike, and expiration. The $500 call expiring Friday and the $500 call expiring next month are different series, so each has its own open-interest count. The Options Industry Council's October 2025 explanation describes volume as session activity and open interest as contracts that remain open.
There is one contract for each matched long and short pair. Open interest doesn't count the buyer and seller as two contracts. If one trader owns 10 calls and another trader has written those same 10 calls, the series has open interest of 10.
Simple enough. Then the clock intervenes.
The open-interest number shown during Tuesday's session generally reflects positions after Monday's clearing process. The exchange can broadcast trades as they occur, so Tuesday's volume rises throughout Tuesday. Final open interest needs the opening and closing designations from both sides, plus exercises and assignments. That reconciliation occurs after trading. The Cboe market-data FAQ states that prior-night clearinghouse open interest remains static during the day and refreshes the following morning.
That means a trader looking at a chain at 2:00 p.m. sees today's volume beside yesterday's open positions. The display is useful. The labels are accurate. The mistake begins when the reader assumes a shared timestamp.
How one trade changes open interest
Every option order carries an opening or closing designation. A buy to open creates or adds to a long position. A sell to open creates or adds to a short position. A sell to close reduces a long position, while a buy to close reduces a short position. The June 2024 options disclosure document explains how an investor can exit through an offsetting transaction in the same series.
Open interest changes only after the two sides are paired:
- Buyer opens, seller opens: open interest increases by the traded quantity.
- Buyer opens, seller closes: open interest does not change.
- Buyer closes, seller opens: open interest does not change.
- Buyer closes, seller closes: open interest decreases by the traded quantity.
The logic is mechanical. When both sides open, a new long and a new short create new contracts. When one side closes and the other opens, ownership transfers while the number of outstanding contracts stays fixed. When both close, existing long and short positions meet and disappear.
Here is a full clearing-day example. Suppose a call series begins with open interest of 1,000 contracts.
- Two opening participants trade 200 contracts. Daily volume reaches 200 and open interest rises to 1,200.
- An opening buyer takes 150 contracts from a closing seller. Volume reaches 350 and open interest stays at 1,200.
- A closing buyer trades 80 contracts with an opening seller. Volume reaches 430 and open interest still stands at 1,200.
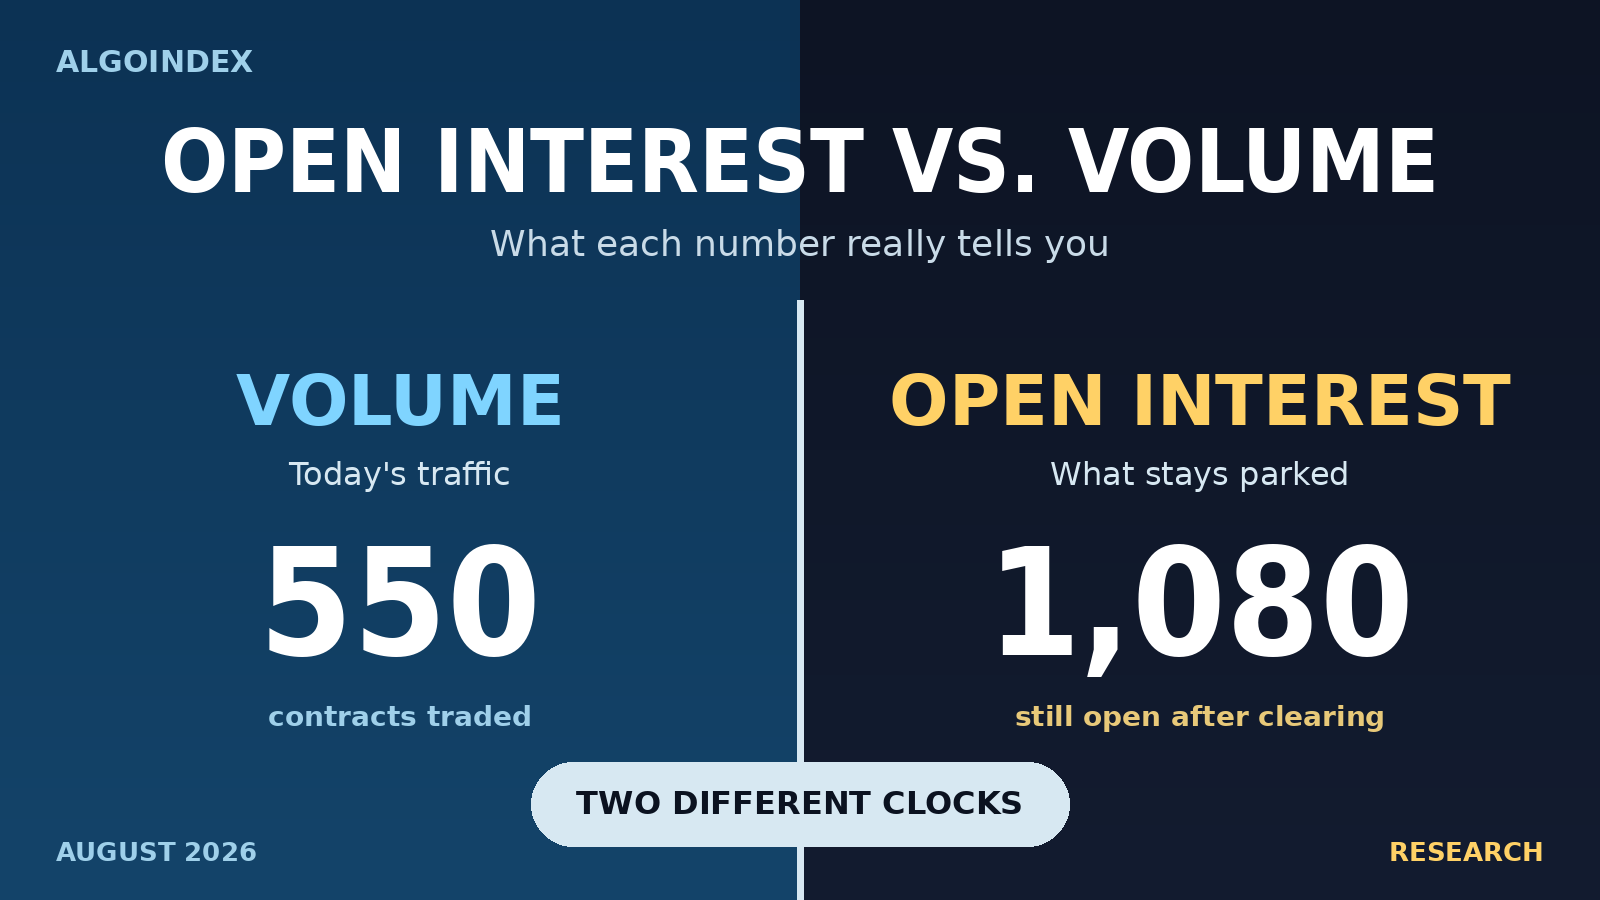
- A closing buyer and closing seller remove 120 contracts. Volume finishes at 550 and open interest falls to 1,080.
The arithmetic checks two separate ledgers:
Daily volume = 200 + 150 + 80 + 120 = 550 contracts
Ending open interest = 1,000 + 200 - 120 = 1,080 contracts
Five hundred fifty contracts traded, yet the outstanding count increased by only 80. That is normal. The clearinghouse's own FAQ gives a real-world version: one series traded about 3,000 contracts, while open interest increased by roughly 1,800 the next day. The difference came from the mix of opening and closing activity, not a faulty data feed. The FAQ lays out all four pairings.
This is where the usual shortcut fails. Subtracting displayed open interest from current volume doesn't reveal new positioning. If a strike shows 12,000 contracts of volume against 3,000 of prior open interest, the volume-to-open-interest ratio is 4.0. That tells you activity is large relative to the position carried into the session. It doesn't prove that 9,000 new contracts exist. The next clearing update might show a large increase, a small increase, no change, or even a decrease.
The ratio is an alert, not a verdict.
The call column has two owners
Large call open interest attracts a bullish story because calls rise when the underlying rises. The story omits the writer. Every outstanding call has a holder with long exposure and a writer with short exposure. The chain's open-interest field records their shared contract, not which participant is better informed, better hedged, or using the option as one leg of a larger position.
The industry FAQ answers the bullishness question directly: the number, standing alone, carries no direction. A call buyer may be expressing upside. A call writer may be collecting premium, hedging stock, or completing a spread. The same contract supports all of those interpretations.
Put open interest has the same problem. A long put may protect a portfolio or express a bearish view. A short put may represent a willingness to buy the underlying lower, a volatility sale, or one side of a spread. The public count doesn't carry motive.
Volume cannot settle the argument. A trade printed near the ask may suggest an aggressive buyer, but a multi-leg order can make one leg look directional when the package is built to isolate volatility, time decay, or relative value. A closing trade can look like fresh conviction. A roll can create heavy volume in two expirations while leaving the trader's broad exposure almost unchanged.
I used to think the larger number deserved the stronger story. Pulling the August 7 file cured that reflex. The rows separated calls from puts and customers from firms and market makers, yet even that richer file required care because participant-side records are not the same thing as a net position. Adding every row would count economic counterparties, not produce the single volume figure a retail screen displays. More columns didn't remove the need to understand the accounting. They raised the price of pretending.
Volume is not liquidity, and open interest is not depth
High volume and high open interest often appear in actively traded series, so traders use both as rough screening inputs. The connection is useful but incomplete.
Execution depends on the market available now: the bid, the offer, displayed size, hidden interest, and the ability of participants to update quotes when the underlying moves. Open interest is a settled position count. It doesn't say how many contracts someone will buy from you at the current bid. Yesterday's active strike can show large open interest and still carry a poor market today after price moves far away.
The reverse can also occur. A newly listed or same-day series may begin with little open interest and still trade with a tight spread because market makers are quoting it and current demand is strong. The trade-entry guidance from the Options Industry Council says execution is affected more directly by the bid and offer than by open interest.
This distinction becomes sharp when an order is larger than the displayed size. Suppose the market is quoted at $2.00 bid for 20 contracts and $2.05 offered for 40. A trader who sells 60 contracts at market cannot infer the fill from open interest. The first 20 may execute at $2.00. The rest can reach lower bids unless new buyers appear. A five-cent spread with limited size and a one-cent spread with deep size are different execution problems even if their open interest matches.
Use volume and open interest to ask whether a series deserves a closer look. Use the quote to decide whether the trade can be executed on acceptable terms.
The dealer-gamma question requires a sign
Open interest enters many public gamma calculations because it supplies the number of outstanding contracts at each strike. That makes it valuable. It doesn't make it a direct report of dealer inventory. AlgoIndex's gamma exposure guide covers the resulting strike levels and hedge mechanics.
Consider an ETF call with open interest of 10,000 contracts and option gamma of 0.0025 per dollar. Using the standard 100-share contract multiplier, the position gamma magnitude is:
10,000 contracts x 100 shares x 0.0025 gamma = 2,500 delta units per $1 move
If market makers are short those 10,000 calls, a $1 rise increases the amount of underlying they need to buy by roughly 2,500 shares in this simplified example. If market makers are long those calls, the hedge adjustment runs the other way. They sell roughly 2,500 shares as the underlying rises. Same open interest. Same option gamma. Opposite hedge direction.
The missing input is the market makers' signed net position.
10,000 contracts × 100 shares × 0.0025 gamma = 2,500 delta units per $1Ordinary open interest cannot provide it because the count includes a long and short for every contract without identifying who owns either side. Ordinary volume cannot provide it because traded quantity lacks the history needed to know whether each participant opened, closed, or transferred a position. A model that assigns a dealer sign from aggregate open interest is making an inference. Some models may be useful, but the assumption must be stated.
A January 2025 study by Diego Amaya, Pedro Garcia-Ares, Neil Pearson, and Aurelio Vasquez shows what it takes to estimate dealer gamma with much richer evidence. The researchers used records for every SPX and SPXW trade in their sample. Each record included the series, time, price, quantity, buyer or seller status, and participant capacity. For non-market-maker participants, the records also identified opening and closing activity. The researchers accumulated signed market-maker trades by series to construct minute-by-minute net positions, then applied option gamma. Their sample contained 442,589,991 trade records. Read the Cboe-hosted paper.
Pause on the difference. A retail chain gives open interest, current volume, quotes, and Greeks. The researchers needed participant capacity, trade direction, opening and closing markers, and position history from each series' inception. That work didn't merely multiply open interest by gamma. It reconstructed who held what.
The study creates the article's turn. Open interest is indispensable for a standing options map, yet it can't carry the directional claim often placed on top of it. The count can locate concentration. The sign requires evidence from somewhere else.
In our morning work, we freeze prior-settlement open interest as the standing map and label it accordingly. We treat current volume as a separate session layer, then grade the published levels after the close through the accuracy tracker. The separation keeps a measured input from masquerading as a live dealer-position report.
Why same-day options need a second lens
Same-day options expose the clock mismatch more forcefully. A contract can begin the morning with open interest set by the prior clearing cycle, trade heavily during the session, and expire that afternoon. Near expiration, at-the-money gamma can change fast as the underlying crosses a strike. Intraday transactions can therefore alter market-maker positions while the public open-interest field stays fixed.
This does not make the morning open-interest map useless. It makes the map a starting inventory. Standing positions can still identify strikes where exposure was carried into the day. Current volume identifies where attention and risk transfer are occurring now. Neither should impersonate the other.
For a same-day expiration, use two layers:
- Standing layer: prior-settlement open interest by strike, combined with current spot, implied volatility, time remaining, and the model's stated dealer-sign assumption.
- Session layer: current volume, trade location relative to quotes, changes in option prices and Greeks, plus any participant-side information legitimately available.
The first layer answers, "Where was inventory concentrated when the day began?" The second asks, "Where is today's activity changing the problem?"
The 2025 SPX study reached market-maker positions by cumulating signed trades at one-minute intervals, not by replacing open interest with raw volume. That distinction matters. A so-called volume gamma calculation that treats every traded call as a new customer purchase can misclassify closing sales, rolls, spreads, and trades between two customers. Fresh data can still produce a stale conclusion when the sign rule is wrong.
For a separate treatment of trade direction and strike-based pivots, see AlgoIndex's options-flow guide.
A practical reading sequence
The useful approach begins with the decision, then selects the field that can answer it.
If the question is activity
Use volume. Compare it with the same series across nearby strikes and expirations, and with its own usual activity if history is available. A sudden concentration tells you where trading is occurring. It doesn't tell you the final position change until clearing.
If the question is outstanding concentration
Use open interest. Compare strikes within the same expiration and expirations within the same underlying; the count shows where contracts survived the prior clearing process. Track day-to-day changes to learn whether unusual activity persisted.
If the question is execution
Start with the bid, offer, spread, and displayed size; volume and open interest provide context, but the current quote sets the immediate transaction cost. Check whether the option is standard or adjusted, since deliverables can differ after corporate actions.
If the question is sentiment
Neither field supplies a clean answer alone. Add price response, trade direction, opening and closing information, participant type, and the possibility of multi-leg structures. Even then, call the conclusion an inference.
If the question is dealer gamma
Use open interest as the standing quantity input only after documenting the sign convention; separate the estimated magnitude from the assumed direction. Then watch current volume as evidence of where the morning estimate may be aging fastest. Recheck the next clearing update to see how much activity became lasting open interest.
This sequence prevents one number from doing five jobs.
The caveats belong in one drawer
Several limits apply across the analysis.
Open interest can change through exercises, assignments, expirations, and position adjustments, not only through offsetting trades. Adjusted option series may represent deliverables other than the usual 100 shares. Complex orders can scatter one economic position across several strikes and expirations. Public chains may aggregate activity across exchanges while specialized reports split it by venue or participant category. Reporting conventions and correction cycles can differ across files.
There is also a measurement boundary. Market-maker positions can be reconstructed from detailed participant-side records, as the SPX researchers did, but public open interest doesn't disclose those records. Any retail dealer-positioning estimate carries assumptions about customer behavior, dealer counterparties, and the sign assigned to calls and puts. The safest practice is to publish those assumptions and test the resulting levels forward, rather than present the estimate as observed inventory.
Finally, high activity does not remove option risk. The Financial Industry Regulatory Authority's options material defines open interest as outstanding contracts and distinguishes opening purchases from opening sales. The clearinghouse's disclosure document remains the primary risk reference for standardized options.
Those caveats do not weaken the two fields. They keep the fields attached to what was actually measured.
What survives the next morning
Friday's volume file was busy enough to invite a dozen stories. Calls traded. Puts traded. Customers, firms, and market makers appeared across exchange rows. Yet the useful question was narrower: after clearing paired the opening and closing activity, how many contracts remained?
That answer arrived on the next clock.
A trader who understands the separation can use both numbers without worshipping either one. Volume shows the day's traffic. Open interest shows what stayed parked after the gates closed. Dealer direction still needs a signed position, and liquidity still lives in the quote waiting on the screen.
The useful signal begins where the easy story ends.
We publish the standing gamma map every morning and grade every published level after the close. The methodology and the running results are open: see the level accuracy tracker and the call wall and put wall guide.
Want the levels and the trade record in your inbox before the open? See membership plans