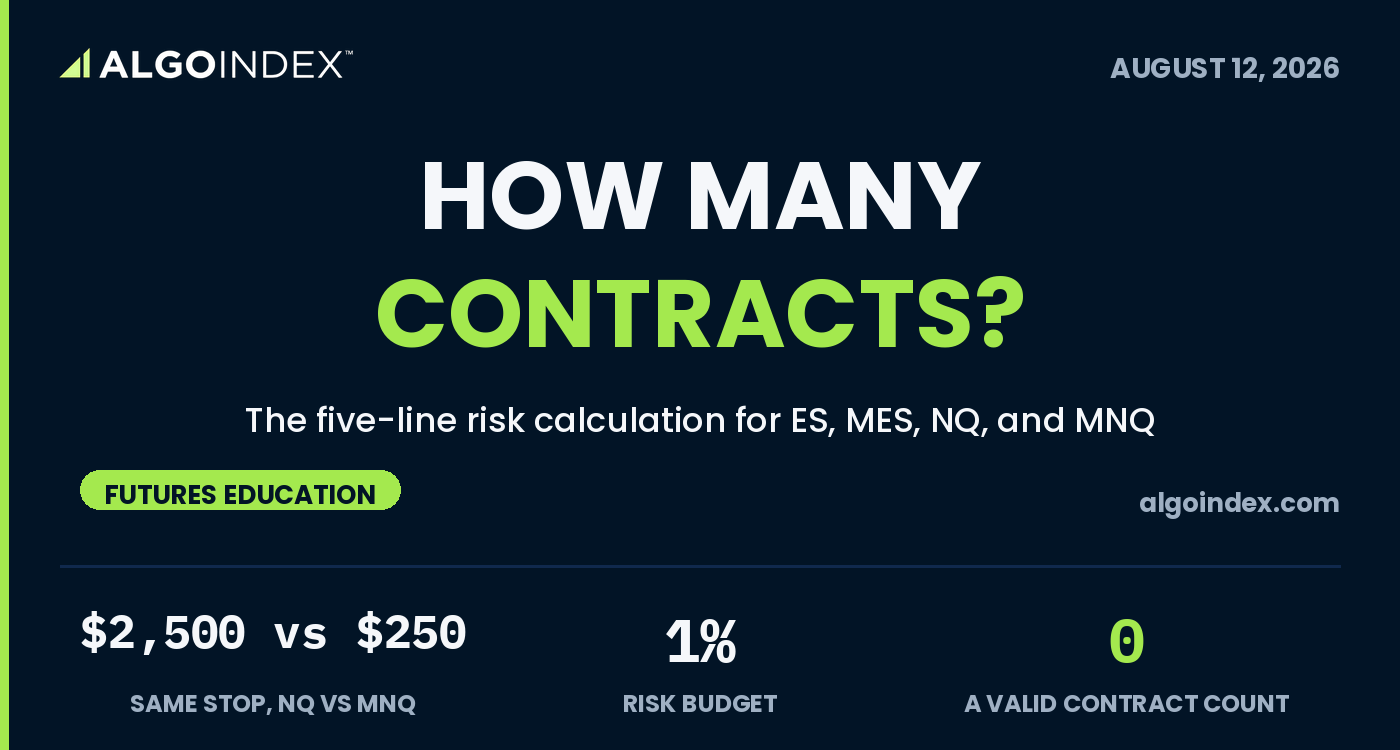
On Monday evening, July 20, an AlgoIndex Nasdaq-100 review laid out a short entry from 28,880 to 28,930 with a stop at 29,030. The midpoint entry was 28,905. That put 125 points between the trade and its exit. On the chart, it looked like one setup. In an account, it became two very different numbers: $2,500 of stop risk for one NQ contract and $250 for one MNQ contract, before costs.
A trader with a $25,000 account and a 1% risk limit had a $250 budget. The full-size contract did not fit. The Micro contract reached the limit before allowing anything for fees or a worse stop fill. The arithmetic did not produce a smaller version of the desired trade. It produced zero contracts.
That is the point of futures position sizing. Start with current account equity and a chosen risk fraction, convert the entry-to-stop distance into dollars per contract, add a cost allowance, then round down. This guide develops that calculation for ES, MES, NQ, and MNQ. It does not repeat contract definitions, trading hours, or margin tables. Those belong in the existing contract-specifications guide. Readers who need the foundations first can use the separate ES guide and NQ guide.
The contract count comes last. Sometimes it is five. Sometimes one. Often, for a full-size contract, it is zero.
The five-line futures position-size calculation
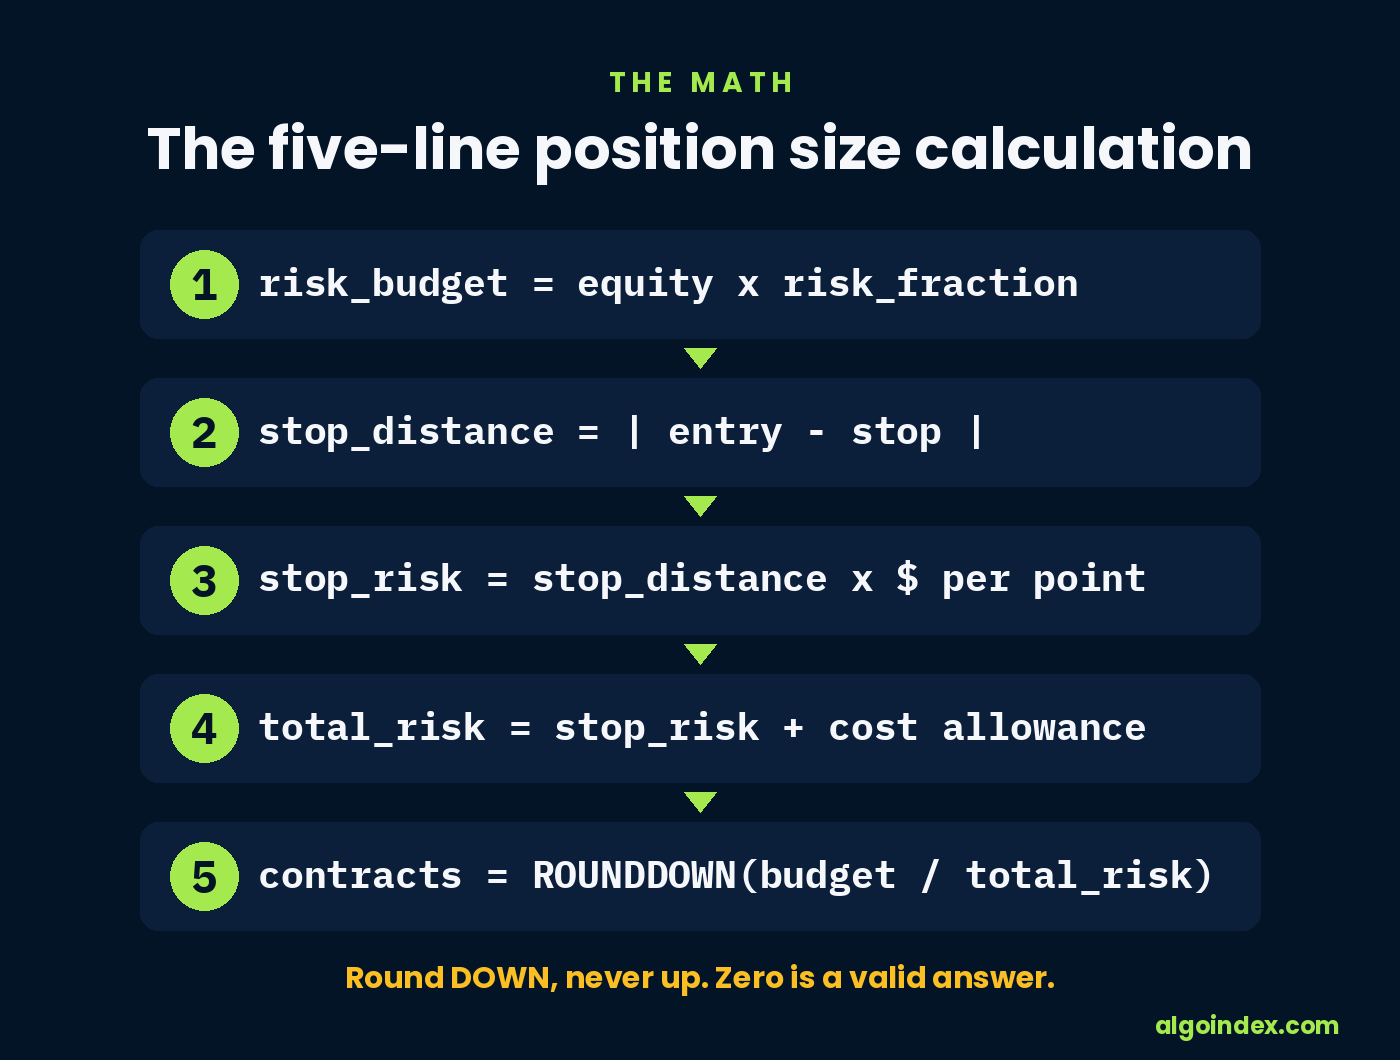
The full calculation needs five lines:
risk_budget = current_account_equity x risk_fraction
stop_distance = absolute_value(entry_price - stop_price)
stop_risk_per_contract = stop_distance x dollar_value_per_point
total_risk_per_contract = stop_risk_per_contract + cost_allowance
contract_count = ROUNDDOWN(risk_budget / total_risk_per_contract, 0)
The same calculation works in ticks:
stop_risk_per_contract = stop_distance_in_ticks x dollar_value_per_tick
Use the account's current net equity, not its opening balance from months ago. Write the risk fraction as a decimal. One percent is 0.01. Half of one percent is 0.005. The percentage is a policy input, not a market fact. An exchange education page that illustrates a 2% limit also says the threshold is arbitrary. A trader has to select a limit that fits the account and then apply it consistently.
The stop comes from the trade idea. It belongs at the price that invalidates the setup, not at the price needed to make a preferred contract count fit. The exchange's position-size lesson makes the same ordering explicit: determine the stop and the account risk first, then calculate the number of contracts.
The cost allowance covers the items the clean chart leaves out. Commissions and exchange fees reduce the account. A stop can fill beyond its trigger. The allowance should reflect the trader's own records by contract, session, order type, and size. Until those records exist, a conservative planning estimate is better than a zero.
There is one more limit. A stop order defines an intended exit, not a fixed maximum loss. Once triggered, a stop generally becomes a market order and can fill at the next available price. A gap, thin market, or fast event can therefore create a larger loss than the formula planned. The count is an estimate built around an exit process. It is not a promise from the market.
Convert the stop to dollars before comparing contracts
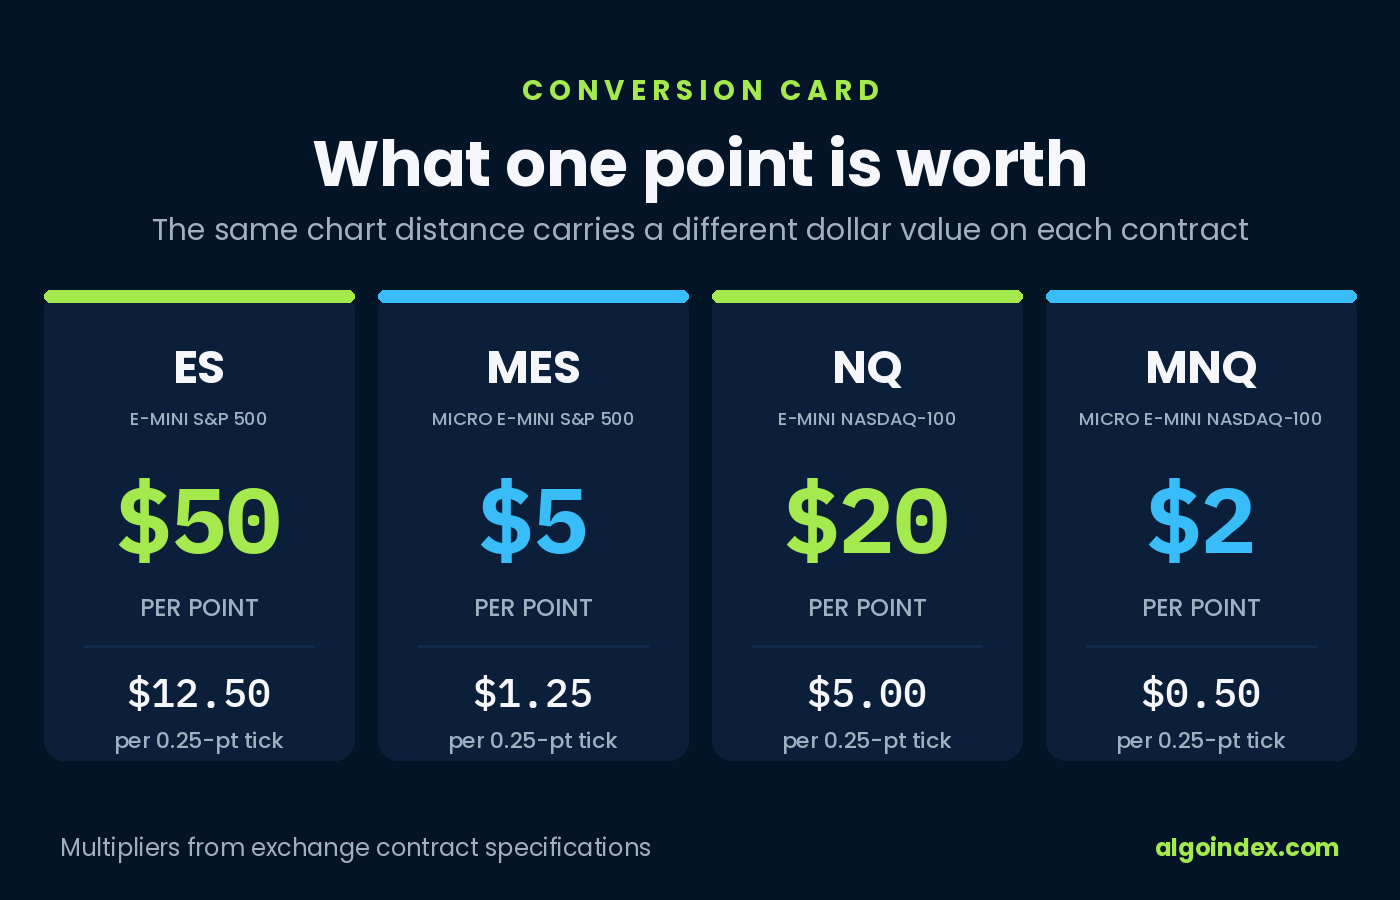
ES, MES, NQ, and MNQ all quote in index points, but the dollars attached to a point differ. Only four conversion values are needed here:
| Contract | Dollars per point | Dollars per 0.25-point tick |
|---|---|---|
| ES | $50 | $12.50 |
| MES | $5 | $1.25 |
| NQ | $20 | $5.00 |
| MNQ | $2 | $0.50 |
The exchange publishes the $50 ES and $20 NQ multipliers and the corresponding Micro multipliers of $5 and $2. It also lists 0.25 points as the outright tick for all four. The table is only a conversion card. For product mechanics and the wider comparison, use the contract-specifications guide.
Suppose an ES trade has an entry at 7,500 and a stop at 7,492. The stop distance is eight points.
ES stop risk = 8 points x $50 = $400 per contract
MES stop risk = 8 points x $5 = $40 per contract
The same price idea costs one tenth as much per MES contract. That does not mean ten MES contracts always equal the better choice. Each Micro contract carries its own transaction costs, and the formula has to count those costs per contract. Eight MES contracts might fit a risk budget that cannot take one ES, while ten MES might exceed it after allowances are added.
Now use NQ. An entry at 30,000 with a stop at 29,970 creates a 30-point distance.
NQ stop risk = 30 points x $20 = $600 per contract
MNQ stop risk = 30 points x $2 = $60 per contract
The chart distance stayed at 30 points. Only the multiplier changed. This is why choosing the contract comes after locating the stop but before counting the position.
Ticks produce the same answer. An eight-point ES stop contains 32 ticks. Multiply 32 by $12.50 and the result is $400. A 30-point MNQ stop contains 120 ticks. Multiply 120 by $0.50 and the result is $60. If the point and tick methods disagree, the input is wrong.
Four worked examples, including the zero
The next examples use hypothetical accounts and trade inputs. To keep costs visible, they assume a $12 total allowance per E-mini contract and $4 per Micro contract. Those figures are teaching inputs, not current quotes. Replace them with actual commission, fee, and slippage records.
Example 1: A $2,000 account and an MES setup
Assume:
- Current account equity: $2,000
- Risk fraction: 1%
- ES entry: 7,500
- Stop: 7,497
- Stop distance: 3 points
- E-mini cost allowance: $12 per contract
- Micro cost allowance: $4 per contract
First find the budget:
risk_budget = $2,000 x 0.01 = $20
Then calculate one ES:
ES total risk = (3 x $50) + $12 = $162
ES contracts = ROUNDDOWN($20 / $162, 0) = 0
The answer is zero full-size contracts. Margin availability cannot repair that mismatch. Rounding $20 divided by $162 up to one would turn a 1% plan into at least 8.1% of the account before any stop slippage.
Now calculate MES:
MES total risk = (3 x $5) + $4 = $19
MES contracts = ROUNDDOWN($20 / $19, 0) = 1
One MES fits by a single dollar. That is thin. If the trader's records support a cost allowance above $5, the correct answer returns to zero. Use the Micro only when the full calculation fits. Otherwise, stand aside.
Example 2: An $80,000 account and an ES setup
Assume:
- Current account equity: $80,000
- Risk fraction: 0.75%
- Stop distance: 9 points
- E-mini cost allowance: $12
- Micro cost allowance: $4
The budget is:
risk_budget = $80,000 x 0.0075 = $600
For ES:
ES total risk = (9 x $50) + $12 = $462
ES contracts = ROUNDDOWN($600 / $462, 0) = 1
Planned risk for one ES is $462, or 0.5775% of the account. Two contracts would require $924 and break the chosen limit.
For MES:
MES total risk = (9 x $5) + $4 = $49
MES contracts = ROUNDDOWN($600 / $49, 0) = 12
Twelve MES contracts carry planned risk of $588. That uses the budget more closely, but it also creates 12 sets of per-contract costs and 12 contracts to manage. The risk formula tells us both counts fit. It does not decide which execution profile the trader should prefer.
Example 3: A $60,000 account and an NQ setup
Assume:
- Current account equity: $60,000
- Risk fraction: 1%
- Stop distance: 20 points
- E-mini cost allowance: $12
- Micro cost allowance: $4
The budget is $600.
For NQ:
NQ total risk = (20 x $20) + $12 = $412
NQ contracts = ROUNDDOWN($600 / $412, 0) = 1
For MNQ:
MNQ total risk = (20 x $2) + $4 = $44
MNQ contracts = ROUNDDOWN($600 / $44, 0) = 13
One NQ risks $412 under the planning assumptions. Thirteen MNQ risk $572. The Micro count offers finer sizing, but it is not a free substitute. Fourteen MNQ would risk $616 and fail the limit.
Example 4: A real ES stop meets an assumed account
On June 26, an AlgoIndex ES review described a fade entry from 7,448 to 7,468 with a stop at 7,478. From the entry-zone midpoint of 7,458, the stop was 20 points away.
One ES attached $1,000 to that stop before costs:
20 points x $50 = $1,000
One MES attached $100:
20 points x $5 = $100
Now place an assumed $50,000 account and a 1% limit over the published setup. The risk budget is $500. With the example cost allowances, one ES requires $1,012 and does not fit. Each MES requires $104, so four contracts risk $416 and five risk $520.
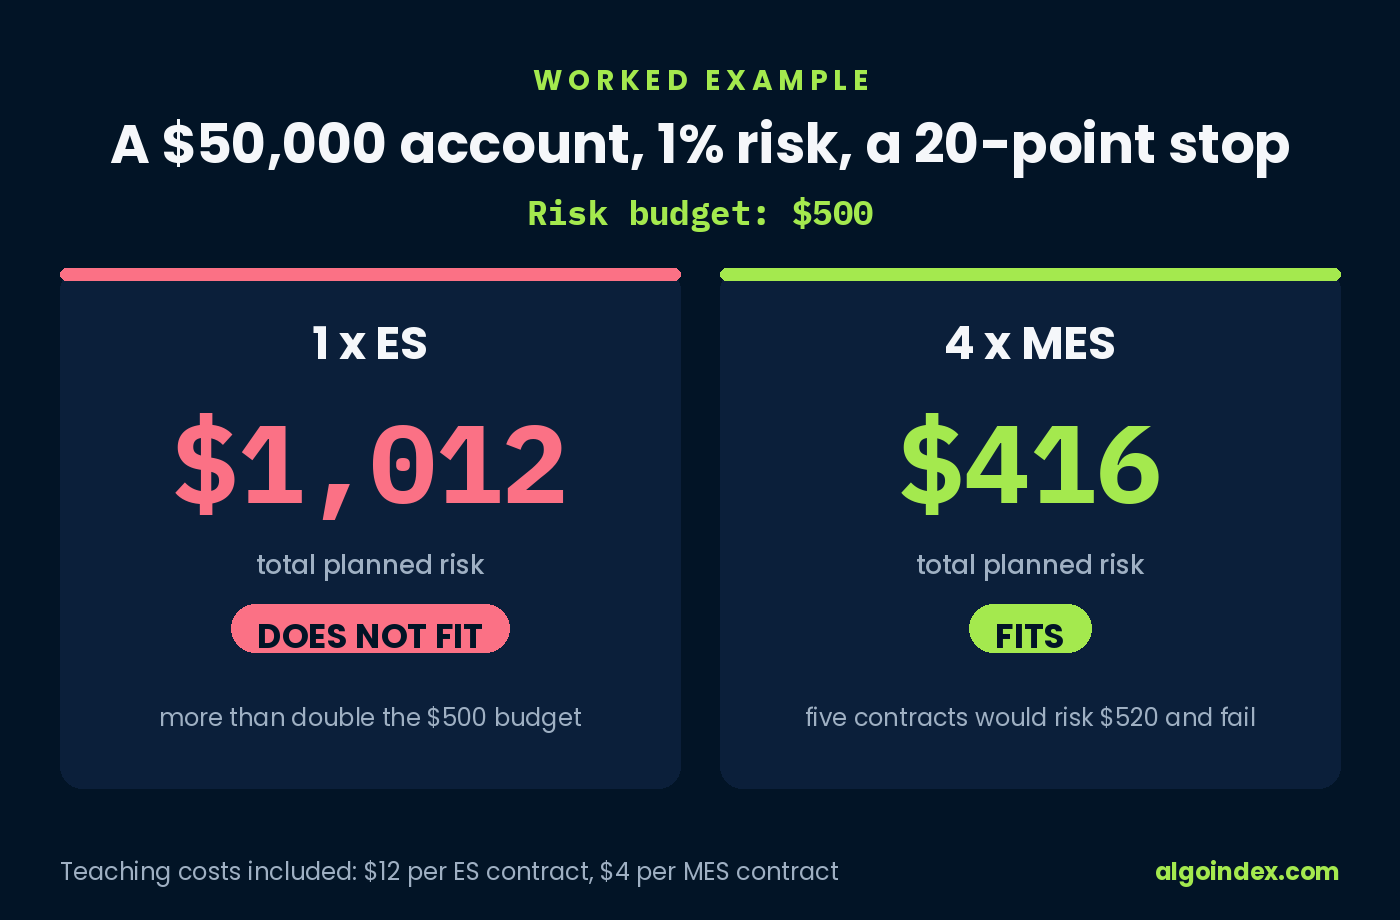
The calculated position is four MES. It is not one ES because the account can post enough day-trade margin. It is not five MES because five feels close. Whole contracts make the boundary blunt. The answer stays on the safe side of it.
Margin answers a different question
Margin is the deposit required to open and maintain a futures position. It is not the amount a trader will lose at the stop. The federal commodities regulator describes futures margin as a performance bond rather than a down payment. The exchange separately defines initial margin as the amount required when a position begins and maintenance margin as the minimum account level that must be maintained.
Those rules protect the broker, clearing firm, and exchange from an account that cannot meet its obligations. They do not choose a suitable loss for the trader.
Consider a deliberately stark example. Suppose a firm requires $500 of intraday margin for one ES contract. A $5,000 account appears to have room for ten contracts. Now suppose the trade needs an eight-point stop.
stop risk per ES = 8 x $50 = $400
stop risk for 10 ES = 10 x $400 = $4,000 before costs
The margin screen says the order may be accepted. The risk calculation says the planned stop equals 80% of the account. Both statements can be true because they answer different questions.
This mistake usually begins with the order ticket. The trader sees available buying power, divides it by the firm's intraday requirement, and treats the result as a position-size recommendation. It is only an operational ceiling. Exchange guidance tells individual traders to base contract count on risk scenarios, not simply on the maximum allowed by initial margin.
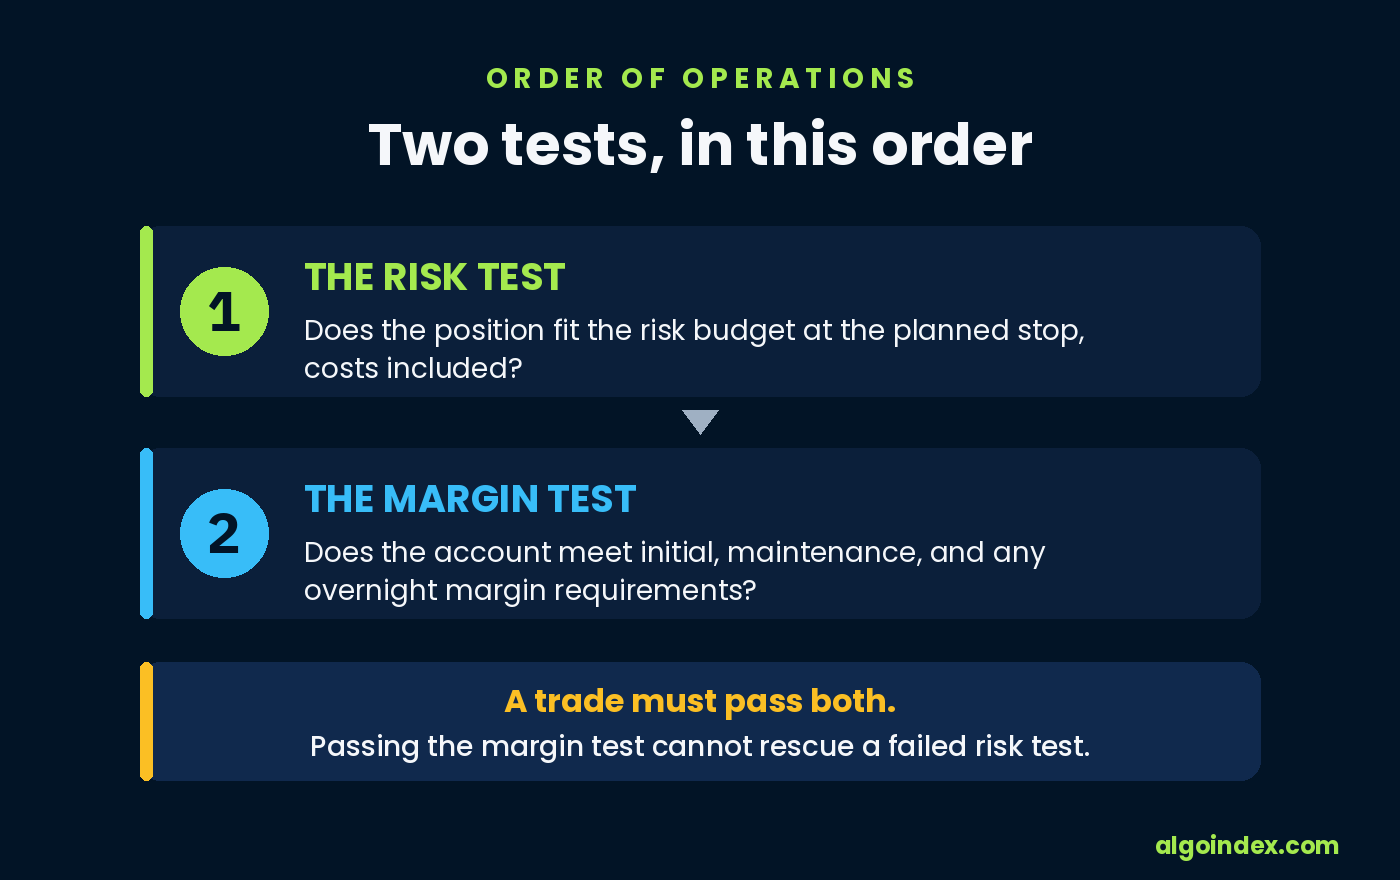
Use both tests, in this order:
- Does the position fit the trader's risk budget at the planned stop, including costs?
- Does the account meet the firm's initial, maintenance, and any overnight margin requirements?
A trade must pass both. Passing the second cannot rescue failure on the first.
The distinction also explains why a margin call is not a stop-loss method. Account equity can fall as the position loses value. If it drops below maintenance requirements, the trader may have to add funds or the firm may close positions. The National Futures Association warns that futures losses can create deficiencies beyond the amount a customer expected to commit. Waiting for the margin system to make the exit decision gives the account's risk control to someone protecting a different balance sheet.
Drawdown changes the next contract count
Fixed-percent sizing changes the dollar budget as account equity changes. If an account begins at E0, risks fraction r, and loses the full planned fraction on n consecutive trades, its hypothetical equity is:
equity_after_n_losses = E0 x (1 - r)^n
This is arithmetic, not a forecast. It assumes each loss equals the selected fraction and excludes added slippage, fees beyond the plan, deposits, withdrawals, and open-position effects.
Start with $25,000. At 1% risk, the first budget is $250. After five full 1% losses, equity is about $23,774.75 and the next 1% budget is about $237.75. After ten, equity is about $22,609.55 and the next budget is about $226.10. The ten-loss drawdown is about 9.56%, not 10%, because each loss is taken from a smaller base.
At 2%, the same ten-loss sequence leaves about $20,426.82. The drawdown is about 18.29%, and the next 2% budget is about $408.54. A larger risk fraction does more than increase the first loss. It steepens the whole path.
Contract counts do not decline as smoothly as account equity. They move in steps. Suppose one MES contract carries $54 of planned risk after the stop and allowance are combined. A $108.50 budget fits two contracts. A $107.50 budget fits only one. A one-dollar reduction in budget cuts the tradable count in half because futures cannot be sized in fractions of a contract.
That step is easy to resist after a losing run. The setup looks unchanged. The trader wants the next winner to repair the prior losses. Rounding up feels temporary.
It is also how a fixed-percent policy quietly becomes a fixed-contract policy. The account shrinks, the number of contracts stays put, and the actual percentage at risk rises. Recalculate from current equity before each trade or at a fixed daily checkpoint. Never carry yesterday's contract count into today without rerunning the inputs.
A drawdown-aware policy can also reduce the selected risk fraction at predeclared equity thresholds. Here is one purely illustrative structure:
- Use 0.75% while equity is within 8% of its high-water mark.
- Use 0.50% after an 8% drawdown.
- Use 0.25% after a 12% drawdown.
- Pause new risk after a 15% drawdown until the process and records are reviewed.
Those numbers are assumptions, not recommendations. The useful part is the sequence: decide the thresholds before the losing run, recalculate the dollar budget from current equity, and let the resulting contract count fall. Risk should not increase because the account is under pressure.
The zero-contract decision
Zero is not an error message. It is a valid output.
The formula returns zero when one contract's total planned risk exceeds the budget. There are only four clean responses:
- Use the corresponding Micro contract and run the calculation again.
- Find a different setup with a closer invalidation point, without moving a stop merely to force a trade.
- Reduce other portfolio risk if the new trade is competing with open positions under a shared account limit.
- Stand aside.
Rounding up is not a fifth response. If one ES requires $412 of planned risk and the budget is $300, buying one ES does not mean the formula was conservative. It means the trader chose $412 of risk.
Moving the stop closer can be just as misleading. Suppose the chart invalidates an NQ idea 30 points from entry, but the account only fits one contract with a 15-point stop. A 15-point stop changes the trade. It may sit inside ordinary price movement and exit before the original idea is disproved. The correct sequence is setup, stop, budget, contract. Reversing it lets the desired position rewrite the evidence.
Micros solve many granularity problems, but not all of them. The $2,000 MES example fit by one dollar under assumed costs. A slightly wider expected fill erased that room. Very small accounts can reach a point where even one Micro contract takes too much risk. Standing aside is then the only output that preserves the selected limit.
There is a dry joke in every trading interface: the buy and sell buttons always work, even when the arithmetic doesn't. Software checks whether an order is valid. It does not check whether the decision is coherent.
A calculator-ready pre-trade card
The math can be lifted directly into a spreadsheet, script, or future calculator. Keep the inputs separate so each assumption remains visible.
Inputs
current_account_equityrisk_fractionentry_pricestop_pricedollar_value_per_pointround_trip_fees_per_contractexpected_slippage_points
Derived values
risk_budget = current_account_equity x risk_fraction
stop_distance_points = absolute_value(entry_price - stop_price)
slippage_allowance = expected_slippage_points x dollar_value_per_point
total_risk_per_contract = (stop_distance_points x dollar_value_per_point) + round_trip_fees_per_contract + slippage_allowance
contract_count = ROUNDDOWN(risk_budget / total_risk_per_contract, 0)
planned_trade_risk = contract_count x total_risk_per_contract
planned_risk_fraction = planned_trade_risk / current_account_equity
Validation checks
contract_countmust be a whole number at or above zero.planned_trade_riskmust not exceedrisk_budget.- The stop must remain at the setup's invalidation point.
- The account must separately satisfy current margin requirements.
- Open-position risk must be included if the account uses a total-risk limit.
- If
contract_count = 0, the order stays off.
For traders who journal their decisions, save the inputs as well as the result. Entry, stop, account equity, selected risk fraction, cost allowance, calculated count, actual fill, and actual exit create the record needed to improve future slippage assumptions. AlgoIndex's trading journal can hold the execution record; the sizing card explains what should be recorded before the order.
The National Futures Association says futures should be traded only with capital a person can afford to lose and warns that the financial swings can exceed what the trader expected to commit. That risk statement is broader than any one formula. Position sizing cannot remove market risk, gap risk, execution risk, or the chance of losses beyond the planned stop.
What it can remove is ambiguity about the intended position.
On July 20, the NQ chart offered a 125-point stop. The contract menu offered NQ and MNQ. Only the account could decide which one belonged in the order, and sometimes the account's answer was neither.
The empty order ticket was the calculation working.
Before sizing the next trade, keep the two reference pieces close: the contract-specifications guide for the multipliers and the trading journal for the cost records the formula depends on.
Want graded levels and a live trade record with the sizing already thought through? See membership plans