
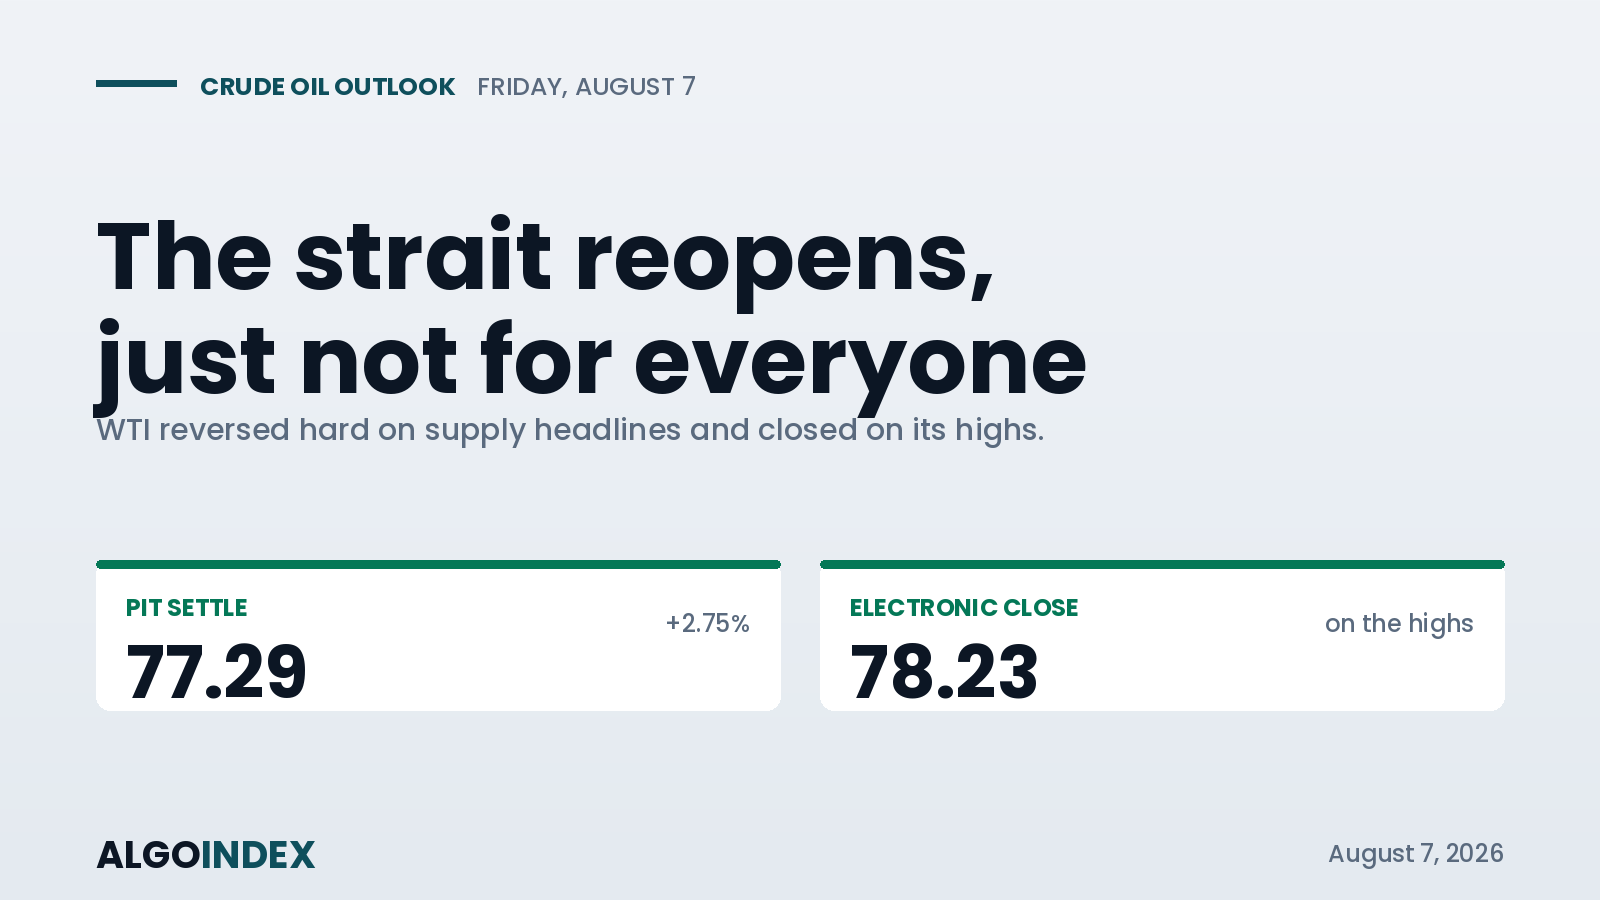
September WTI settled 77.29 on Thursday, up 2.07, and then bought another 0.94 after the settlement bell to finish the electronic day at 78.23. The reversal came from one detail: the waterway is going to reopen for some ships and stay shut for others.
A conditional reopening isn't a reopening. That is the whole trade.
What actually moved it
For a week the arrangement with Oman had been read as a clean restoration of passage through the Strait of Hormuz. Trading that expectation cost crude 5.88 dollars across five sessions, 7.03 per cent, carrying it down from 93.50 on 23 July to a low of 74.57 printed in Thursday's European morning.
One detail leaked mid-morning and undid all of it. Ships flying American or Israeli colours, plus those of any country judged to have inflicted damage on Iran, would not be permitted through under the proposed terms.
Read that again. A reopening with a guest list is not a reopening; it is a filter. Plenty of Gulf barrels move on hulls that would fail such a test. What had been priced as supply returning turns out to be supply still penned in, wearing different paperwork. The discount had to be paid back and it was, fast.
Brent settled 82.49, a 3.83 per cent gain where crude managed 2.75, stretching the gap between them to 5.20 dollars. Brent is the seaborne benchmark. Its outperformance on a headline says the risk being repriced travels by tanker and sits in the Gulf. That spread confirmed the story before anyone had to argue it.
Then the shooting started
Diplomacy was only half of Thursday.
Iranian sources described strikes on hostile positions near the waterway's mouth through the afternoon. Explosions were heard on Qeshm Island, which sits at the entrance itself. Separately, Houthi forces claimed a ballistic missile hit on a Saudi tanker off Aden, which puts the southern approach in play too.
The heaviest item landed at 4:44 in the afternoon, sixteen minutes before the electronic close. A Saudi official said the kingdom had watched drones and missiles move in a pattern suggesting strikes coming from two directions at once, and named what they would likely be aimed at: energy infrastructure, ports, airports.
Sixteen minutes isn't enough time for a market to price that. Which is why the overnight session matters more than usual here.
Set against all of it, the American president described the waterway as sort of open, doubted Iran could hold out much longer, and predicted the fighting would wrap up soon. Tehran's parliament speaker publicly threw that back at him, saying he should face the facts and honour what he had already agreed to. Both accounts cannot be true of the same week, and a trader has to hold a price that reflects each of them.
The close was the tell
Settlement went up at 2:30 sharp, 77.29. Buyers kept working for another two and a half hours after that.
Thursday was the mirror image of Wednesday, when the market was short the premium and the other side had gone silent: Crude Oil (CL): the other side just stopped talking.
It printed 78.51 before the screens shut and closed 78.23, marked 78.20 bid, 78.32 offered. Tally that: 3.66 clear of the low, 28 cents shy of the high, 0.94 north of its own settle. No failed push at the top, no rejection wick worth pointing at, nothing that looks like distribution.
End-of-day auction behaviour that aggressive isn't position squaring. Somebody wanted length going into a weekend.
Why the chart still argues the other way
Now the uncomfortable half.
Four averages sit overhead: 78.74 at five days, 81.30 at twenty, 79.14 at fifty, 81.54 at a hundred. Underneath there is one, the 200-day, and at 71.26 it is 6.03 away, too distant to matter this week. Composite studies read 56 per cent bearish. On the nine-day directional set the negative line still leads, 26.11 to 20.11, with the index at 28.77.
Then participation. Only 215,177 contracts changed hands behind a 2.75 per cent gain, against averages of 277,079 over five days and 297,177 over twenty. Buying into overhead supply on volume roughly a quarter light, driven wholly by news the White House is openly trying to make go away, does not have much underneath it.
Momentum reads better. Fast stochastics are about as depressed as they get, 8.93 on the 14-day %K and 12.15 on the nine, while 14-day strength climbed 3.96 points to 46.76. That pairing, single digits on the fast clock against the mid forties on the slow one, more often produces several days of counter-trend buying than it does an immediate leg down. The 14-day directional gap has meanwhile narrowed inside two points, and stretch the window to fifty and the positive line is in front.
Where the product complex sits
This is the part that persists after the headlines stop.
September gasoline settled 2.9385, a 3.51 per cent gain that beat crude by 76 basis points. Run it through 42 gallons and the barrel equivalent is 123.42 against 77.29 for the crude itself, which puts the product roughly 46.13 dollars ahead. That figure comes out of arithmetic, not a screen, so treat it loosely. A gap that wide does line up with what physical desks have been describing, though: American distillate exports set a record last week as supply tightened worldwide and outages in several regions pulled barrels toward the export bid.
Europe adds a second pull. Power prices on the continent spiked toward 500 euros a megawatt hour when drought throttled generation during a severe heat wave. That combination has a long history of dragging extra oil and gas into the generation mix.
Natural gas is the control experiment. It settled 2.640, off 1.79 per cent, the weakest nearest-futures print in roughly three and a half months after storage built more than forecast. One leg of the complex fell while the other two rose. That rules out a general energy bid, rules out the currency, rules out a commodity-wide flow. What remains is crude and its refined product, which is precisely where a blocked Gulf transit shows up.
Who is holding what
Positioning data carries a 28 July stamp. That puts it five sessions past the 93.50 peak and ahead of most of what this week took out of the price, which is what makes it worth reading rather than discarding.
Inside one week, managed money put on 6,490 longs and bought back 22,474 shorts. That is 28,964 contracts of directional swing, leaving the category 92,943 net long. Across non-commercials as a whole, 33,609 shorts came off. Somebody took the opposite side of all of it: commercial accounts sold 25,516 fresh shorts and trimmed 24,705 longs, while swap dealers piled on another 24,317 short.
Producers were selling into strength. Speculative money was buying it.
Because the report predates the fall, the next part is inference and should be read that way: a serious quantity of speculative length got built up near the peak and is now sitting on a 7.03 per cent five-day loss. Two consequences follow. Longs stuck offside supply every rally as they hunt for an exit closer to cost, which points to sellers waiting around 80 and 81. But the short book carried by commercials and swap dealers is substantial, and that is what a squeeze runs on if the premium widens instead. Friday can produce either.
The macro backdrop was a headwind
Crude put on 2.75 per cent while the dollar strengthened and yields climbed. The dollar index closed 99.955, better by 0.27 per cent; the ten-year added 1.06 per cent to 4.675.
That is the cleanest available evidence that Thursday was a supply event. Both the currency channel and the discount-rate channel were working against the move and it happened anyway.
Policy piles on. July's vote split nine to three, three regional presidents pressing for a quarter-point rise, and futures now carry a full hike by December. Thursday's numbers leaned the same way. Claims came in at 199,000 when 205,000 was expected, unit labour costs at 1.3 per cent versus a 2.1 forecast, productivity at 1.4 against 0.6. Firm output per hour alongside easy labour costs takes a little pressure off inflation, but a claims print that low keeps the jobs market tight.
There is a wrinkle worth naming. Because crude is rising on disruption rather than on demand, higher oil now feeds headline inflation without signalling any economic strength. That leans the central bank hawkish and weighs on shares, which is what Thursday delivered: indices modestly lower, the Dow down 481 points, volatility off 4.18 per cent at 15.14. Stocks softer with implied volatility softer too says equity traders read oil as an irritant to margins rather than a threat to the system. Push through 80 dollars and that assumption goes first.
What Friday hinges on
The ceiling directly overhead is crowded. Six separate markers fill the 66 cents that run 77.46 up to 78.12: the 40-day sits at the bottom, second pivot resistance at 77.85, a 38.2 per cent retracement one tick further at 77.88, an 18-day stall marker at 77.94, a stochastic threshold at 78.08, a second retracement closing it out at 78.12. Thursday's electronic close came at 78.23, a fraction above every one.
Holding above that band into the open is the condition everything else depends on.
Beyond it, 78.51 draws price first and is where anyone who bought late books something. The genuine test comes next, and it is three markers packed inside 13 cents: third pivot resistance at 79.01, one deviation out at 79.09, the 50-day right behind at 79.14. Getting through repairs the average structure, and that is why the level counts for more than its arithmetic.
On the downside 76.54 has to hold through any dip. Under that is the tidiest base anywhere on this chart, three markers within 18 cents of each other: 75.40 as the midpoint of the yearly range, 75.38 as the pivot, 75.22 as Wednesday's close. Break it and every dollar Thursday made goes back.
The trade
Buy the band, not the highs. Work an entry between 77.50 and 77.90 on a dip that respects the 40-day at 77.46 and second pivot resistance at 77.85. Park the stop at 76.40, below what the idea rests on rather than inside the chop. Take profit at 79.01, 80.04 and 81.06, which pays roughly 1.0, then 1.8, then 2.6 to one measured from a 77.70 fill.
Anything above 78.51 gets left alone. Half size at most: a 14-day true range of 4.50 dollars and realised volatility at 67.35 per cent against 50.22 over a hundred days does not leave room for a normal clip.
The other path is a conditional short. Should a fifteen-minute bar close under 76.54, then price return to 75.38 by 75.50 and get rejected from beneath, sell 75.30 to 75.55, risk to 76.65, aim at 74.57, then 74.07, then 72.91.
One rule overrides both. The moment a believable de-escalation story lands, get out, wherever price happens to be. Word that the deal goes ahead with the shipping clause dropped, a ceasefire, a line from Washington or from the Qatari or Omani mediators saying it is signed, any of those qualifies. Every dollar of premium here rests on politics, and politics can remove it quicker than a resting stop can fill.
The weekend problem
Crude stops trading at 5:00 Friday afternoon and doesn't reopen until 6:00 Sunday evening. Twenty-five hours with no price.
Into that window go a live conflict, a direct Saudi warning about paired strikes on energy sites, and an earlier report that Washington and Israel had readied a weekend strike on energy assets inside Iran. Expect some premium to be paid into Friday's close by participants who won't be short across the break. Expect any position carried through it to face a Sunday opening several dollars away in either direction.
Flat by Friday's close is the default, and it is the default for a reason.
What we are watching
Base case: Friday opens firm, spends the morning grinding at the ceiling that runs 78.51 up to 79.14, and cannot take it out first go, both because three markers sit stacked in there and because July's stranded buyers feed stock into every push. After that, a range roughly 77.46 by 79.09 for the rest of the day, with the week finishing on a small bid as traders buy weekend cover.
Put continuation near 45 per cent, a two-sided grind near 35, a de-escalation reversal near 20. Treat the 8:30 employment report as a volatility event here, not a directional one: a hot number pushes the dollar up into a path already priced hawkish, a cold one eases the dollar but starts a demand argument. Wait out the opening quarter hour.
Three things argue up: momentum, chart structure, the refined product bid. Four argue down: the average stack, the composite, thin volume, and a diplomatic effort actively working against the premium. Nobody gets certainty out of that, and size should reflect it.The complete data picture
Every number behind Friday’s plan, charted first; the full numeric reference follows underneath.
Full numeric reference , every remaining figure from the review
Full data reference
Every figure behind the analysis above. September WTI, contract CLU26, session of Thursday 6 August 2026, prepared for Friday 7 August. Dollars per barrel unless marked otherwise.
| Reference | Value |
|---|---|
| Settlement | 77.29, up 2.07 or 2.75 per cent |
| Open | 75.14, eight cents under the prior settlement of 75.22 |
| Session high | 78.51, printed after the settlement window |
| Session low | 74.57, a fifth consecutive session of decline |
| Realised range | 3.94 |
| Electronic close | 78.23, quoted 78.20 bid against 78.32 offered |
| Distance above the low at the close | 3.66 |
| Distance below the high at the close | 0.28 |
| Advance after the settlement | 0.94 |
| Settlement time | 2:30 pm Eastern; electronic close 5:00 pm Eastern |
| Reference | Value |
|---|---|
| Five-session decline into Thursday | 5.88 or 7.03 per cent |
| One-month high | 93.50, set 23 July |
| One-month low | 68.61, set 7 July |
| 13-week low | 67.12, set 2 July |
| 52-week high | 95.30, set 18 May |
| 52-week low | 55.49, set 16 December |
| Distance below the 52-week high | 18.46 per cent |
| Distance above the 52-week low | 40.04 per cent |
| 52-week change | up 16.35 or 26.65 per cent |
| Three-month change | down 6.45 or 7.66 per cent |
| One-month change | up 9.15 or 13.35 per cent |
| Prior week high | approximately 87.50 |
| Prior week low | approximately 76.50, violated then reclaimed |
| Prior month high | approximately 92.40 |
| Reference | Value |
|---|---|
| 5-day | 78.74, settlement below by 1.45, electronic close below by 0.51 |
| 20-day | 81.30, settlement below by 4.01, electronic close below by 3.07 |
| 50-day | 79.14, settlement below by 1.85, electronic close below by 0.91 |
| 100-day | 81.54, settlement below by 4.25, electronic close below by 3.31 |
| 200-day | 71.26, settlement above by 6.03, electronic close above by 6.97 |
| Year-to-date | 75.64, settlement above by 1.65, electronic close above by 2.59 |
| Reference | Value |
|---|---|
| 9-day | raw 27.53 per cent, %K 12.15, %D 13.93, strength 44.44 |
| 14-day | raw 18.06 per cent, %K 8.93, %D 13.00, strength 46.76 |
| 20-day | raw 30.81 per cent, %K 24.34, %D 33.04, strength 47.73 |
| 50-day | raw 40.14 per cent, %K 34.55, %D 40.20, strength 49.70 |
| 100-day | raw 37.58 per cent, %K 32.34, %D 38.14, strength 51.07 |
| Change in 14-day strength | up 3.96 points on the session |
| Reference | Value |
|---|---|
| 9-day | index 28.77, positive 20.11, negative 26.11, historic volatility 68.34 per cent |
| 14-day | index 22.42, positive 22.26, negative 24.22, historic volatility 67.35 per cent |
| 20-day | index 17.11, positive 22.96, negative 23.17, historic volatility 66.52 per cent |
| 50-day | index 13.09, positive 23.06, negative 21.25, historic volatility 52.94 per cent |
| 100-day | index 11.36, positive 23.10, negative 20.43, historic volatility 50.22 per cent |
| Reference | Value |
|---|---|
| 9-day | true range 4.70 or 6.05 per cent, daily range 4.44 or 5.71 per cent |
| 14-day | true range 4.50 or 5.79 per cent, daily range 4.58 or 5.89 per cent |
| 20-day | true range 4.34 or 5.58 per cent, daily range 4.21 or 5.41 per cent |
| 50-day | true range 3.89 or 5.00 per cent, daily range 3.69 or 4.75 per cent |
| 100-day | true range 3.21 or 4.13 per cent, daily range 3.89 or 5.01 per cent |
| One true range around the 75.38 pivot | 70.88 to 79.88 |
| One true range around the 77.29 settlement | 72.79 to 81.79 |
| One true range around the 78.23 close | 73.73 to 82.73 |
| One daily range around the settlement | approximately 75.00 to 79.60 |
| Reference | Value |
|---|---|
| Overall | 56 per cent bearish, strength soft, direction weakest |
| Short-term group | 40 per cent bearish |
| Medium-term group | 75 per cent bearish |
| Long-term group | 67 per cent bearish |
| Trend signal | neutral |
| Reference | Value |
|---|---|
| 77.46 | 40-day average |
| 77.85 | 2nd pivot resistance |
| 77.88 | 38.2 per cent retracement from the 13-week low |
| 77.94 | 18-day stall reference |
| 78.08 | 14 by 3 raw stochastic 20 per cent threshold |
| 78.12 | 38.2 per cent retracement from the four-week low |
| 78.51 | the session high |
| 79.01 | 3rd pivot resistance |
| 79.09 | one deviation of resistance |
| 79.14 | 50-day average |
| 80.01 | raw stochastic 30 per cent threshold |
| 80.04 | 14-day strength midpoint |
| 80.09 | 61.8 per cent retracement from the 52-week low |
| 80.70 | two deviations of resistance |
| 80.74 | 9-day average |
| 81.06 | 50 per cent of the four-week range |
| 81.21 | 50 per cent of the 13-week range |
| 81.30 | 20-day average |
| 81.93 | three deviations of resistance |
| 82.29 | 18-day crossover |
| 83.87 | raw stochastic 50 per cent level |
| 83.99 | 38.2 per cent retracement from the four-week high |
| 84.50 | daily equilibrium band and the last four-hour lower high |
| 84.54 | 38.2 per cent retracement from the 13-week high |
| 84.74 | 40-day stall reference |
| 93.50 | the one-month high |
| 95.30 | the 52-week high |
| Reference | Value |
|---|---|
| 76.54 | 1st pivot resistance, now the reference that must hold |
| 75.64 | year-to-date average |
| 75.40 | 50 per cent of the 52-week range |
| 75.38 | the session pivot |
| 75.22 | the previous close |
| 75.14 | Thursday's open |
| 74.57 | the session low |
| 74.07 | 1st pivot support |
| 72.91 | 2nd pivot support |
| 72.28 | calculated downside target |
| 72.05 | 3 to 10 day crossover stall |
| 71.60 | 3rd pivot support |
| 71.35 | one deviation of support |
| 71.26 | 200-day average |
| 70.70 | 38.2 per cent retracement from the 52-week low |
| 69.74 | two deviations of support |
| 68.61 | the one-month low |
| 68.51 | three deviations of support |
| 67.12 | the 13-week low |
| 60.92 | 14-day strength 30 per cent projection, a tail reference only |
| 55.49 | the 52-week low |
| Reference | Value |
|---|---|
| Sequence since 23 July | higher high near 93.00, lower high near 87.50, bullish change of character, lower high near 84.50, lower low, higher low, second change of character, lower low at 74.57 |
| Swing low | 74.57 |
| Swing high | 78.51 |
| Last meaningful lower high | 84.50 |
| Oscillator readings at the low | 12 to 22, turned up through the final two bars and crossed the signal |
| Confirmation level | a four-hour close above 79.09 |
| Negation level | a four-hour close below 76.54 |
| Reference | Value |
|---|---|
| September WTI | 77.29, up 2.07 or 2.75 per cent |
| Brent settlement | 82.49, up 3.04 or 3.83 per cent |
| Brent to WTI differential | 5.20 |
| Gasoline settlement | 2.9385, up 0.0997 or 3.51 per cent |
| Natural gas | 2.640, down 0.048 or 1.79 per cent |
| Energy equities | 58.16, up 0.85 or 1.48 per cent |
| E-mini S&P | 7,734.75, down 14.75 or 0.19 per cent |
| E-mini Nasdaq | 29,488.25, down 126.75 or 0.43 per cent |
| Cash index | 7,709.96, down 13.59 or 0.18 per cent |
| E-mini Dow | 54,013, down 481 or 0.88 per cent |
| Gold | 4,299.6, down 5.6 or 0.13 per cent |
| Dollar index | 99.955, up 0.266 or 0.27 per cent |
| Ten-year yield | 4.675, up 0.049 or 1.06 per cent |
| Volatility index | 15.14, down 0.66 or 4.18 per cent |
| Bitcoin | 64,408.90, down 194.13 or 0.30 per cent |
| Reference | Value |
|---|---|
| Gasoline per barrel equivalent | 123.42, being 2.9385 multiplied by 42 gallons |
| Implied product premium over crude | approximately 46.13, derived arithmetic rather than a quoted market |
| Distillate exports | a record high last week as global supplies tightened |
| European power prices | spiked toward 500 euros per megawatt hour on drought and heat |
| Reference | Value |
|---|---|
| Commercials | long 871,589 down 24,705, short 1,030,411 up 25,516, net minus 158,822 |
| Non-commercials | long 314,992 up 4,810, short 194,884 down 33,609, net plus 120,108 |
| Producers | long 648,607 down 25,095, short 296,817 up 6,465, net plus 351,790 |
| Swap dealers | long 100,460 up 5,656, short 611,072 up 24,317, net minus 510,612 |
| Managed money | long 193,959 up 6,490, short 101,016 down 22,474, net plus 92,943 |
| Other reportables | long 121,033 down 1,680, short 93,868 down 11,135, net plus 27,165 |
| Managed money weekly swing | 28,964 contracts toward the long side |
| Reference | Value |
|---|---|
| Session volume | 215,177 |
| Five-day average volume | 277,079 |
| Twenty-day average volume | 297,177 |
| Open interest | 236,179 |
| Expiry | 20 August, fourteen sessions out |
| First notice | 24 August |
| Trading hours | 6:00 pm Sunday to 5:00 pm Friday Eastern with a daily maintenance break; pit equivalent 9:00 am to 2:30 pm |
| Reference | Value |
|---|---|
| Entry zone | 77.50 to 77.90 on a pullback that holds 77.46 and 77.85 |
| Stop | 76.40 |
| Risk from the 77.70 midpoint | 1.30, approximately 0.29 of one 14-day true range |
| Target 1 | 79.01, a gain of 1.31 |
| Target 2 | 80.04, a gain of 2.34 |
| Target 3 | 81.06, a gain of 3.36 |
| Reward ratios | approximately 1 to 1.0, 1 to 1.8, 1 to 2.6 |
| Invalidation | a sustained fifteen-minute close below 76.54 |
| Sizing | half size or less |
| Reference | Value |
|---|---|
| Trigger | loss of 76.54 on a fifteen-minute close, then a retest and rejection of 75.38 to 75.50 from below |
| Entry zone | 75.30 to 75.55 |
| Stop | 76.65 |
| Target 1 | 74.57 |
| Target 2 | 74.07 |
| Target 3 | 72.91, extension to 72.28 |
| Reward ratios from the 75.42 midpoint | approximately 1 to 0.7, 1 to 1.1, 1 to 2.0 |
| Reference | Value |
|---|---|
| Constructive continuation | 45 per cent, holds 77.46, clears 78.51, works through 79.01 to 79.14, extends toward 80.04 |
| Two-sided consolidation | 35 per cent, a 77.46 to 79.09 range with no directional conclusion |
| De-escalation reversal | 20 per cent, back through 77.46 and 76.54 toward the 75.22 to 75.40 shelf |
| Low scenario band | 74.07 to 75.40, tail extension to 72.91 |
| Most likely band | 76.54 to 79.09 |
| High scenario band | 79.60 to 81.21, tail extension to 81.93 |
| Reference | Value |
|---|---|
| Gap continuation | price opens beyond 79.14 or below 74.57 without a retest |
| Payrolls whipsaw | a range greater than 1.50 in the first fifteen minutes with price unresolved either side of 77.46 by 9:45 am |
| Dead middle | price trapped inside 76.54 to 77.46 at 9:45 am |
| Headline impulse | a significant headline inside fifteen minutes of a planned entry |
| Weekend exposure | any entry requiring a hold through the 5:00 pm Friday close to reach the first target |
| Reference | Value |
|---|---|
| 02:00 | German industrial production month on month, forecast 0.2 per cent against 0.9 prior |
| 02:00 | German industrial production year on year, forecast 0.1 per cent against 0.11 prior |
| 02:00 | German exports month on month, forecast 0.5 per cent against 0.9 prior |
| 02:00 | German imports month on month, forecast 2.0 per cent against minus 2.5 prior |
| 02:00 | German trade balance, forecast 17.2 billion against 19.1 billion prior |
| 08:30 | Payrolls, forecast 80k against a 57k prior, being 80,000 against 57,000 |
| 08:30 | Private payrolls, forecast 80,000 against 49,000 prior |
| 08:30 | Unemployment rate, forecast 4.2 per cent, unchanged |
| 08:30 | Average earnings, forecast 0.3 per cent monthly and 3.5 per cent annual, both unchanged |
| 08:30 | Average workweek, forecast 34.3 hours, unchanged |
| 08:30 | Canadian employment change, forecast 20,000 against 18,200 prior |
| 08:30 | Canadian unemployment rate, forecast 6.5 per cent, unchanged |
| 10:00 | A Federal Reserve speaker |
| 10:00 | Canadian purchasing survey, prior 56.2 |
| 11:00 | One-year inflation expectations, forecast 3.65 per cent against 3.67 prior |
| 15:00 | Consumer credit, forecast 12 billion against minus 0.18 billion prior |
| Reference | Value |
|---|---|
| Initial claims | 199,000 against a 205,000 forecast |
| Preliminary unit labour costs | 1.3 per cent against a 2.1 per cent forecast |
| Preliminary productivity | 1.4 per cent against a 0.6 per cent forecast |
| Eurozone retail sales | 0.7 per cent annual against a 1.0 forecast and 1.6 prior; minus 0.3 per cent monthly against a 0.1 forecast |
| Italian industrial production | minus 1.0 per cent against a 0.3 per cent forecast |
| July policy vote | nine to three, three dissents for a 25 basis point increase |
| Rate expectations | futures fully price an increase by December |
| 11 August | short-term energy outlook at 12:00 |
| 12 August | agency monthly report at 04:00, producer group monthly report at 08:00, consumer price index at 08:30 |
| Reference | Value |
|---|---|
| 22 July | the American president said any Iranian fire on a ship in the Strait would be met with a strike on a bridge or a power plant |
| 23 July | he said Iran would be held responsible for Houthi attacks; WTI printed its one-month high at 93.50 the same day |
| 29 July | he said strikes would follow attacks on American targets in Jordan |
| 31 July | a network reported Washington and Israel were preparing to bombard energy-related targets in Iran that weekend |
| 4 August | the Treasury Secretary suggested an arrangement to open the waterway the following day; Qatar confirmed draft language existed |
| 6 August | the restricted-passage detail emerged mid-morning at roughly 11:49; wire commentary had WTI up 1.83 by 10:32 central time |
| 6 August afternoon | Iranian strikes near the Strait entrance, explosions on Qeshm Island, a Houthi missile claim in the Gulf of Aden |
| 6 August, 16:44 | the Saudi warning on relocated drones and missiles, sixteen minutes before the electronic close |
| Late July, separately | a pipeline consortium discussed an indefinite halt to oil and tanker operations pending safety guarantees |
| Reference | Value |
|---|---|
| Brent outperformance | 108 basis points over WTI on the session |
| Gasoline outperformance | 76 basis points over WTI |
| Distance from the settlement to the session high | 1.22 |
| The 79.01 to 79.09 pairing | 58 cents above the session high |
| Advance after the settlement, restated | 94 cents, buying-driven end of day auction behaviour |
| Close within the high | 28 cents |



