
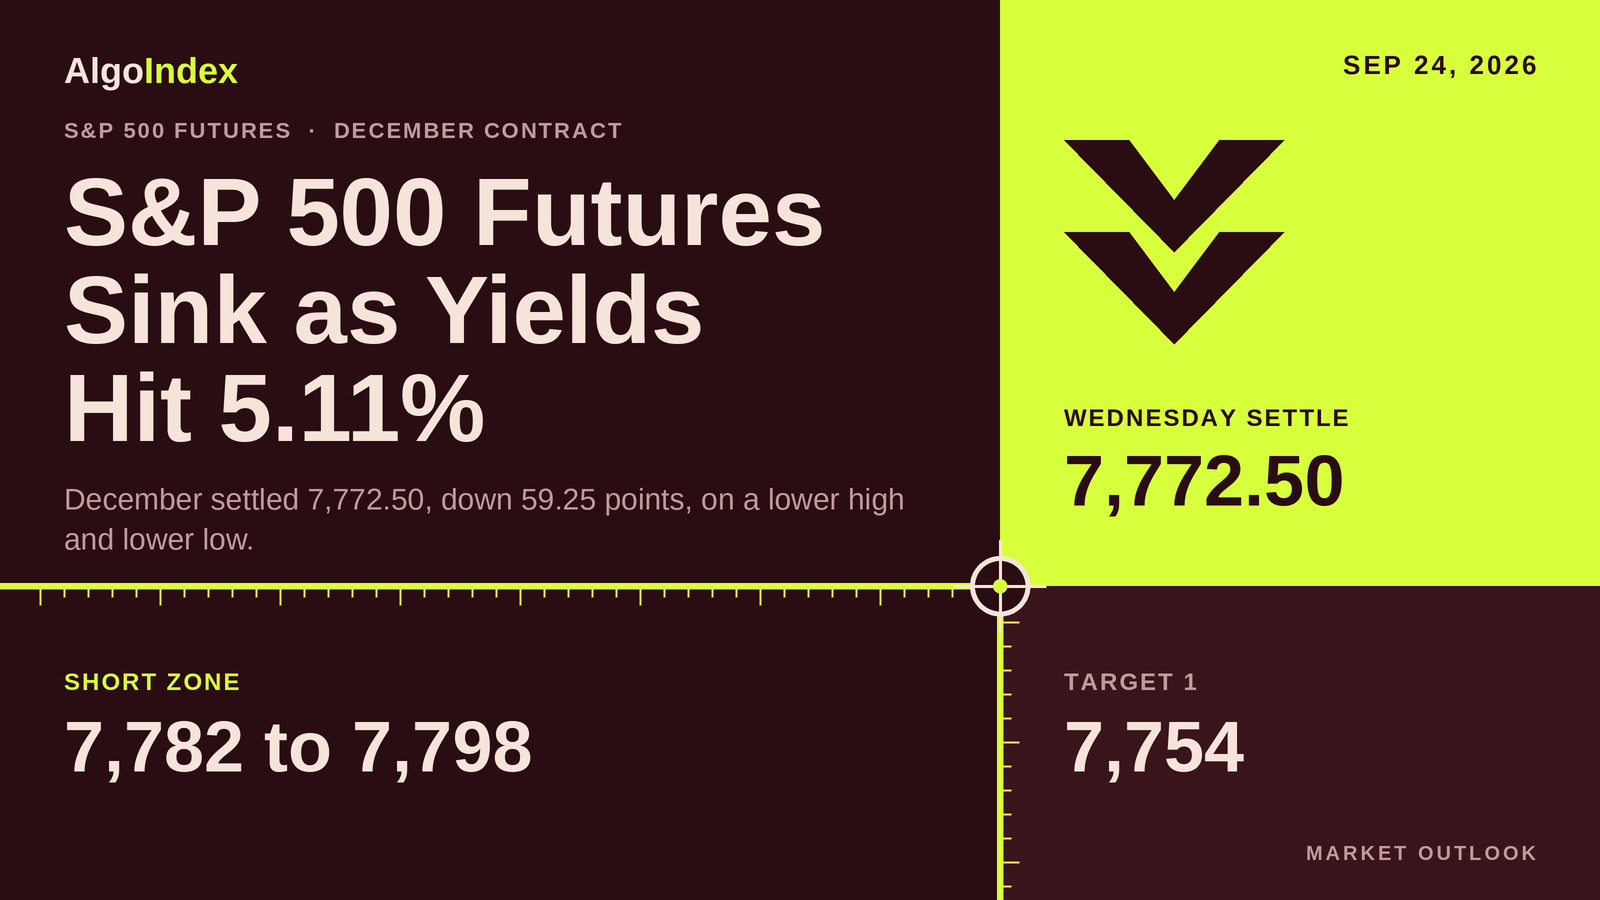
At 5.11 percent, the ten-year Treasury yield closed Wednesday at what press commentary described as a 19-year high. It had touched 5.14 percent. That was 15 basis points in a day. Around the move, the United States flash surveys at 9:45 AM ET beat on every component, per the news-feed record and unconfirmed against an official calendar, and press commentary quoted a Federal Reserve governor as saying further policy adjustments are likely to be needed. The five-year note auction tailed. Equities, bonds and gold fell together while crude and the dollar rose.
December E-mini futures settled at 7,772.50, down 59.25 points or 0.76 percent from Tuesday's 7,831.75, after a completed session from 7,843.25 to 7,758.75. That 84.50 point band was 1.16 times the 14-day average daily range of 73.02, and the settle landed at 16.3 percent of it, 13.75 points above the low, on 1,488,717 contracts. Lower high, lower low. The cash index closed at 7,706.03, down 58.61 points or 0.75 percent, inside a 67.05 point range worth 86.4 basis points, against 25.72 points on Tuesday. The headline times and the price move coincided. No time-stamped intraday price series was captured, so no causal ordering is asserted here.
December S&P 500 futures settled at 7,772.50, one point above the 5-day settlement average and 19.00 points beneath the 7,791.50 pivot. The first ceiling is the 7,781 to 7,792 band. There the pivot meets the futures equivalent of the modeled volatility threshold at 7,781.47 (cash 7,715). Support starts at 7,771.50 and firms at 7,756 to 7,760, the band holding the session low, the 40-day crossing and the positioning note's 7,690 cash pivot; the densest group sits at 7,739.20 to 7,745.41. The primary setup is a short from 7,782 to 7,798, stop 7,826, targets 7,754, 7,718 and 7,682. Positioning leans defensive: the positioning note recorded index hedging delta of minus 20 billion dollars, and the cash index closed 8.97 points beneath the 7,715 threshold.
Wednesday's long card against a 7,758.75 low
Wednesday's outlook set a long from 7,812 to 7,832, stop 7,792, targets 7,852, 7,882 and 7,912. The band traded. Wednesday opened at 7,830.00, inside it and 2.00 points beneath its top edge, and the completed session ran from 7,843.25 down to 7,758.75, through the whole zone. The 7,792 stop level traded as well, with the session low 33.25 points beneath it. No target was touched. The high at 7,843.25 stopped 8.75 points short of the 7,852 first target.
The settle decided the card. At 7,772.50 it finished 19.50 points beneath the stop, 39.50 beneath the bottom of the zone and 19.75 beneath the 7,792.25 second pivot support, the settle line the card named as the one that negates the thesis. That condition was met. No intraday price series was captured, so the order in which the high, the low and the stop level were reached is not established here, and no fill is asserted.
Parts of Tuesday night's map held up better. We flagged the 7,741.38 to 7,750.73 confluence as the densest support on the chart, and Wednesday's low stopped 8.02 points above its upper edge. The one-range envelope we published, 7,754.73 to 7,908.77, contained the low by 4.02 points. The scenario bands did not. Our high-range case bottomed at 7,770, and the session went 11.25 points through it; the settle finished 22.50 points beneath the 7,795 low of the most likely band.
The card's macro override is the other check. It named a hot United States flash composite at 9:45 AM ET that lifts the ten-year yield through 5 percent as a reason the long would fail. Both halves printed. The composite came in at 58.4 against a 55.3 forecast, per the news-feed record and unconfirmed against an official calendar, and the ten-year closed at 5.11 percent. A daily capture cannot show which moved first.
Geometry is what the bar does establish. The settle finished 57.50 points beneath the open, 70.75 beneath the high and 13.75 above the low. Against Tuesday, the high sat 5.25 points lower and the low 51.75 points lower, beneath Tuesday's 7,810.50. Tuesday's 38.00 point span had been a compression and Monday's 133.50 point span an expansion, so Wednesday was the directional session of the three, and the first above-average range since the 09/21 advance. Two sessions have now taken back 61.00 of the 121.00 points Monday added. The prior week, September 14 through September 18, spanned 7,575.00 to 7,739.25, and the settle still sits 33.25 points above the top of it.
A pivot and a threshold stacked at 7,781 to 7,792
Overhead, two methods land on nearly the same price. The Pivot Point at 7,791.50 sits 19.00 points above the settle. Just beneath it is the futures equivalent of the modeled volatility threshold: the cash threshold of 7,715 converts to 7,781.47 at the measured basis of 66.47, while the positioning note's own futures pair quotes 7,781.70 (cash 7,715) at that source's fixed 66.70 offset. The two readings differ by 0.23 points. A settle above the 7,781 to 7,792 band would put the cash index back above the threshold.
Above that band the ladder is crowded. The published target price sits at 7,800.03 and the three-and-ten day crossover stall at 7,806.68. The positioning note's 7,750 cash support level converts to 7,816.47. Then the 7,823.00 to 7,824.25 pair of one standard deviation resistance and Pivot R1, 1.25 points apart. Two standard deviations resistance at 7,843.91 sits 0.66 points above Wednesday's 7,843.25 high, and Tuesday's 7,848.50 high and the 7,850.75 one-month high, set on 08/28/26, close the group. Extended references follow. Pivot R2 at 7,876.00 and the note's 7,800 cash ceiling at 7,866.47 at the measured basis are extended references, with the note's own pair at 7,866.70. The 52-week and 13-week high at 7,905.00, set on 08/13/26, sits 132.50 points above the settle, just beneath Pivot R3 at 7,908.75.
Beneath price the first support is almost touching. The 5-day settlement average at 7,771.50 is one point under the settle. The note's 7,700 cash level converts to 7,766.47, and the stochastic 70 percent threshold at 7,766.45 sits 6.05 points beneath the settle. Next come the 40-day average crossing at 7,759.89 and Wednesday's 7,758.75 low. The note's own 7,690 cash pivot converts to 7,756.47. That makes 7,756 to 7,760 the most important support in the instrument. It holds the session low, a moving-average crossing and the note's pivot.
Below it sits the densest group on the map. The 38.2 percent retracement from the four-week high at 7,745.41, the 20-day settlement average at 7,743.26, Pivot S1 at 7,739.75 and the relative-strength 50 percent line at 7,739.20 fall within 6.21 points, and the prior week's 7,739.25 high lands inside them. The 18-day crossing sits at 7,735.81. The modeled gamma-flip level at 7,661 cash converts to 7,727.47, near the 9-day crossing at 7,728.66 and one standard deviation support at 7,722.00; the note's own pair reads 7,727.70.
Deeper still is a retracement shelf. The 7,706.74 to 7,715.77 band holds the 38.2 percent retracement from the 13-week high, the 50 percent four-week retracement at 7,712.88 and the 50-day settlement average. The stochastic 50 percent threshold at 7,711.75 sits inside it, with Pivot S2 at 7,707.00 and two standard deviations support at 7,701.09 just beneath. Three standard deviations support at 7,685.04 and the 38.2 percent retracement from the four-week low at 7,680.34 come next. Pivot S3 at 7,655.25 is the extended reference.
Every average still sits beneath price. On settlements through Wednesday the contract is 1.00 point above the 5-day at 7,771.50, 29.24 above the 20-day at 7,743.26, 56.73 above the 50-day at 7,715.77, 123.68 above the 100-day at 7,648.83 and 437.14 above the 200-day at 7,335.37. The stack is in order from short to long. With the 5-day effectively at the settle, the shortest average is Thursday's first decision line.
Zoom out and the decline is still shallow. The swing from the 09/16 low at 7,575.00 to Tuesday's 7,848.50 high measures 273.50 points, and the settle sits 76.00 points beneath the top, a 27.8 percent retracement. The 38.2 percent line at 7,745.41 is 27.09 points lower. The 38.2 percent retracement from the 13-week high at 7,706.74 sits 6.14 points beneath the 50 percent line, so 7,706.74 to 7,712.88 is the deepest well-defined shelf of the swing. The 13-week range runs 7,386.00, set on 07/29/26, to 7,905.00, and the one-month range 7,575.00, set on 09/16/26, to 7,850.75.
Yields at 5.11 percent and a minus 20 billion dollar hedging day
The flow carried the heaviest signal. The positioning note recorded index hedging delta of minus 20 billion dollars on the day, described as the largest negative reading in the past year and dominated by same-day expiries. It also logged a 2 billion dollar spread between non-same-day puts and same-day puts. The note read that as hedging demand. Single-stock hedging delta was minus 4.5 billion dollars, of which minus 2.5 billion was longer-dated call selling and minus 2 billion put buying. Customer put-selling positions around 7,700 were trimmed as the market moved lower. By the end of the session the model's gamma reading around that strike had turned negative. These are the note's characterisations; no timestamp-aligned flow series was captured.
The model places the index on a boundary. The cash close at 7,706.03 sits 8.97 points beneath the modeled volatility threshold at 7,715, 45.03 points above the modeled gamma-flip level at 7,661 and 16.03 points above the note's 7,690 pivot. Between those two model lines, dealer hedging dampens movement less than it does above the threshold. That is the model's interpretation of the configuration; nothing captured here measures it as a cause of Thursday's behaviour. The gamma index reads 5.42, gamma tilt 1.498 and gamma notional 1.225 billion dollars, and the 25-delta risk reversal sits at minus 0.027. Puts led. Put volume of 1.065 million contracts ran 1.54 times the 693,214 calls, and put open interest of 12.726 million ran 1.43 times the 8.927 million in calls.
Volatility rose without panic. The volatility index closed at 15.18, up 0.97 points or 6.83 percent, and the note recorded the volatility-of-volatility index up about 7 percent to 89. Index fixed-strike implied volatilities were relatively flat despite the selloff. The note read that as the options market not yet pricing sustained volatility. The note's implied one-day move for the cash index is 0.66 percent, or 50.86 index points on Wednesday's close, framing 7,655.17 to 7,756.89.
Rates did the damage. The ten-year yield traded 4.98 to 5.14 percent and closed at 5.11 percent, up 15 basis points from Tuesday's 4.96 percent; the positioning note described it as the highest level since July 2007. The dollar index closed at 101.10, up 0.50 percent. At 1:00 PM ET the five-year auction stopped at a 5.033 percent high yield, a tail of 3.1 basis points above the 5.002 percent when-issued level, with a 2.21 bid-to-cover against a prior 2.37, per the news-feed record and unconfirmed against an official calendar. Press commentary put the market-implied probability of an October rate increase at 69 percent, up from 53 percent on Tuesday.
Fed speakers added weight. The governor's housing remarks were scheduled at 10:05 AM ET, per the verified forward calendar, and press commentary quoted him as saying further adjustments are likely to be needed to bring inflation to target in a timely fashion. The projections published on September 16 showed 12 of 18 officials expecting one more quarter-point increase this year, per a news-feed item stamped 2:00 PM ET that day. Every flash component beat. Manufacturing printed 57.0 against 53.7, services 58.7 against 55.8 and the composite 58.4 against 55.3, per the news-feed record and unconfirmed against an official calendar. Press commentary called the manufacturing reading the fastest expansion in four and a quarter years. The next policy meeting is scheduled for October 28 at 2:00 PM ET, per the news-feed calendar and unconfirmed.
Oil supplied the inflation leg. Press accounts carried remarks by the United States Secretary of State that Iran fired at commercial vessels in the Strait of Hormuz and that talks were being impeded, and Brent settled at 103.08, up 3.86 percent, per a news-feed item stamped 2:40 PM ET. November crude settled at 92.16, up 1.81 percent, and December gold at 4,318.4, down 1.33 percent. A headline stamped 7:45 PM ET described the Iranian president sending a defiant message to the United States over potential talks. The review reads the combination of falling equities, bonds and gold alongside rising crude and the dollar as the cross-asset signature of an inflation-and-rates shock.
Breadth was broad and hardware-led. The note recorded the software fund up about 1 percent, the semiconductor fund down about 1 percent and memory names down about 3 percent, while press commentary described chipmakers and artificial-intelligence infrastructure stocks as sliding. The Dow closed down 0.68 percent and the Nasdaq-100 cash index down 0.85 percent, per press commentary and the provider's daily record. No advance-decline or up-volume series was captured, so breadth is not measured beyond those index-level figures. A news-feed item stamped 12:45 PM ET reported that the United States was preparing a 90-day diesel export ban; the White House called the report false in items stamped 1:41 PM and 1:59 PM ET. That episode touched energy and refining names.
One catalyst had not resolved at the time of writing. The note flagged a large-cap developer conference at 7:00 PM ET Wednesday as a key catalyst for the data-center and artificial-intelligence trade, per the note and unconfirmed against an official calendar, and no content from it was captured. Its outcome is not asserted. An investment-bank note carried on the news feed, without a captured timestamp, reported the same company's shares up 21 percent since a consumer artificial-intelligence product launched two weeks earlier, against a 1 percent gain for the broad index. On China, a news-feed item stamped 4:10 PM ET reported that China had taken possession of sensitive military aircraft parts diverted to Hong Kong. Then came better news. A report stamped 8:15 PM ET said the United States and China had extended their trade truce through January 10, the most constructive overnight item for the index.
Positioning is lopsided on both sides. In the report as of September 15, 2026, leveraged funds held 161,176 long against 454,319 short, a net short of 293,143 after covering 42,302 shorts on the week. Asset managers held 1,142,075 long against 237,391 short, a net long of 904,684, and dealers held 220,012 long against 922,950 short. Open interest on the December contract stood at 1,884,650. A squeeze remains available on good news, and the asset-manager book has the most to hedge on bad news. Wednesday's minus 20 billion dollar hedging reading is consistent with the second, though the report predates Wednesday by six sessions and cannot confirm it.
The trade map for Thursday
The primary setup is a short from 7,782 to 7,798. The contract made a lower high and a lower low on an expanded range and settled at 16.3 percent of it. The cash index closed beneath the modeled volatility threshold. The hedging reading was the largest negative of the past year, as the note described it, and the ten-year rose 15 basis points to 5.11 percent. With the averages intact underneath, the setup is a retracement short into the pivot and the threshold equivalent rather than a breakdown short. The stop is 7,826, above Pivot R1 at 7,824.25 and one standard deviation resistance at 7,823.00. The targets step down the ladder: 7,754, then 7,718, then 7,682.
From the 7,790 midpoint the risk to the stop is 36 points, 49.4 percent of the 14-day average true range of 72.89. The three targets sit 36, 72 and 108 points beneath that midpoint. Adding and subtracting one average true range from the settle frames Thursday between 7,699.61 and 7,845.39. That envelope holds the zone, the stop and the first two targets. The third target sits 17.61 points beneath its lower edge. The published deviation bands are tighter, 7,722.00 to 7,823.00 at one deviation and 7,701.09 to 7,843.91 at two.
The scenario ranges are analyst judgment and carry no calibration. The low-range case runs 7,745 to 7,800, the most likely 7,725 to 7,815 and the high-range case 7,700 to 7,845. Session by session the review expects roughly 7,745 to 7,800 through Globex, with a neutral bias around the 7,771.50 average and beneath the 7,781 to 7,792 band. London's band is 7,740 to 7,800, neutral with a downward lean beneath 7,781.47. The morning band is 7,720 to 7,810 and the afternoon 7,725 to 7,805.
So far the reopen is quiet. The new session opened at 7,774.75, 2.25 points above the settle, and had traded between 7,767.00 and 7,779.25 at the time of reading, a 12.25 point band. The last read was 7,768.25, down 4.25. Those figures belong to Thursday's session and form no part of Wednesday's completed range.
Politics fills the overnight block. The Chinese leader was scheduled to arrive at the White House at 6:00 PM ET, with the state visit running all day Thursday, per the news-feed calendar and unconfirmed. The developer conference began at 7:00 PM ET, and the truce extension was reported at 8:15 PM ET. Japanese flash purchasing-manager surveys print at 8:30 PM ET with a prior composite of 53.5, and Australian employment data follows at 9:30 PM ET with the unemployment rate forecast at 4.5 percent, both per the news-feed calendar and unconfirmed.
Europe matters through yields. Swiss and Swedish policy decisions land at 3:30 AM ET, the Norwegian decision at 4:00 AM ET with a forecast of 4.5 percent against a current 4.25 percent, and the German business climate survey at 4:00 AM ET. A Federal Reserve speaker appears at 4:10 AM ET. All are per the news-feed calendar and unconfirmed.
Then the United States morning. Weekly jobless claims print at 8:30 AM ET, consensus 200,000 against a prior 196,000, with continuing claims forecast at 1.74 million, per the news-feed calendar and unconfirmed. The second-quarter international transactions release lands at the same time, per the verified forward calendar. Federal Reserve speakers appear at 8:30 AM, 8:50 AM and 10:10 AM ET, per the news-feed calendar and unconfirmed. The cash open at 9:30 AM ET is the first directional test, and the 7,756 to 7,760 band is the level that test is fought over. New home sales print at 10:00 AM ET, per the verified forward calendar, with a consensus of 0.615 million units, per the news-feed calendar and unconfirmed, and a tentative Treasury liquidity buyback is listed for 11:00 AM ET.
The afternoon holds the day's first-order event. The seven-year note auction at 1:00 PM ET, where the prior auction stopped at a 4.512 percent high yield, per the news-feed calendar and unconfirmed, is the most direct read on demand for duration after Wednesday's five-year tail. A dealer financing survey is published at 2:00 PM ET. A large-cap retailer reports after the close with a call at 5:00 PM ET, both per the verified forward calendar.
Further out, the durable goods report at 8:30 AM ET on September 25, 2026 is the next first-order release. Personal income and outlays follow at 8:30 AM ET on September 30 and the employment report at 8:30 AM ET on October 2, all per the verified forward calendar. Quarter end falls on September 30, as the positioning note lists, and a large memory-chip maker reports that day at 4:30 PM ET.
The most probable path is a slow one overnight. It holds the reopened session near the 5-day settlement average through Asia and Europe, with the truce extension offering modest support and global yields the main input. Through the United States morning the contract tests the 7,756 to 7,760 band. As analyst judgment, a test of the 7,739.20 to 7,745.41 group is more likely than a recovery of the 7,781 to 7,792 band before the 1:00 PM ET auction, because the cash index settled beneath the modeled threshold on a yield rise that the overnight news does not reverse. That weighting is judgment, with no measured frequency behind it. A settle above Pivot R1 at 7,824.25 is the alternative that invalidates it.
The index finished the day 8.97 points on the wrong side of a line the model drew at 7,715, with a net-short leveraged-fund book underneath that any turn in yields would send scrambling to cover.
The complete data picture
Every number behind Thursday’s plan, charted first, then the full level lists, then the complete numeric reference underneath.
Full numeric reference, every remaining figure from the session review
1. Executive Summary
The December S&P 500 contract settled at 7,772.50 on Wednesday, down 59.25 points or 0.76 percent from Tuesday's 7,831.75. The completed session traded an 84.50 point band between 7,843.25 and 7,758.75 and settled at 16.3 percent of that range, 13.75 points above the low. The bar made a lower high and a lower low against Tuesday, with the low 51.75 points beneath Tuesday's 7,810.50. The cash index closed at 7,706.03, down 58.61 points or 0.75 percent, inside a 67.05 point cash range equal to 86.4 basis points, against a 25.72 point cash range on Tuesday. The measured basis this session is the 7,772.50 futures settle less the 7,706.03 cash close, which is 66.47 points.
The driver was the rate channel. The ten-year yield closed at 5.11 percent after a 5.14 percent intraday high, up 15 basis points on the session, and press commentary described the move as a 19-year high. The United States flash surveys at 9:45 AM ET beat on every component, the composite at 58.4 against a 55.3 forecast, per the news-feed record and unconfirmed against an official calendar, and press commentary quoted a Federal Reserve governor as saying further policy adjustments are likely to be needed. Press commentary put the market-implied probability of an October rate increase at 69 percent from 53 percent on Tuesday. Crude rose 1.81 percent and Brent 3.86 percent on reports of Iranian fire at commercial vessels in the Strait of Hormuz, and press commentary framed the equity decline as a response to higher inflation expectations and yields. The headline times and the price move coincided; no time-stamped intraday price series was captured for this session, so no causal ordering is asserted.
The positioning picture changed character on Wednesday. The positioning note recorded index hedging delta of minus 20 billion dollars on the day, the largest negative reading in the past year, and the cash index settled 8.97 points beneath the model's volatility threshold at 7,715 while holding 16.03 points above the positioning note's own 7,690 pivot. Against that, the averages are intact: on settlements through Wednesday the contract sits one point above its 5-day average and 29.24 points above its 20-day, and the composite multi-indicator read is 56 percent buy. The index is sitting on the boundary between a damped and an undamped dealer configuration with its short averages directly underneath.
The primary setup is a short from a retracement into the 7,782 to 7,798 band around the standard pivot and the futures equivalent of the modeled volatility threshold, stopped above the first standard pivot resistance, with objectives beneath the session low, at the 50-day settlement average and an extended 7,682.
2.1 Intraday and Session Review
The completed Wednesday session opened at 7,830.00, 1.75 points beneath Tuesday's 7,831.75 settle, marked a high of 7,843.25 and a low of 7,758.75, and settled at 7,772.50. No intraday series was captured for this session, so the order in which those extremes were reached is not asserted and no path claim appears anywhere in this review. What the daily bar establishes is geometry: the settle finished 57.50 points beneath the open, 70.75 points beneath the high and 13.75 points above the low. The cash bar reads the same way, opening at 7,761.94, which the provider records as also the session high, with a low of 7,694.89 and a close of 7,706.03 at 16.6 percent of its range.
The session extremes used here are the completed-session inputs behind the published pivot ladder rather than an independently read bar, back-solved from the outer pivot pairs and verified against every rung. Pivot R3 at 7,908.75 minus Pivot S3 at 7,655.25, divided by three, returns 84.50, and Pivot R2 at 7,876.00 minus Pivot S2 at 7,707.00, divided by two, returns the same 84.50. Three times the Pivot Point at 7,791.50 less the 7,772.50 settle gives a high plus low sum of 15,602.00, and the resulting pair of 7,843.25 and 7,758.75 reproduces all seven published rungs. The provider's own published daily record returns 7,830.00, 7,843.25, 7,758.75, 7,772.50 on 1,488,717 contracts. Both are surfaces of the same vendor rather than independent sources, so they confirm internal consistency and not the underlying quote.
The provider's overview page shows a day open of 7,774.75, a day high of 7,779.25 and a day low of 7,767.00 at the time of reading. Those belong to the new Globex session that reopened at 6:00 PM ET and are not Wednesday's range.
2.2 Daily Structure
Tuesday spanned 7,848.50 to 7,810.50, and Wednesday's 7,843.25 to 7,758.75 sits 5.25 points lower at the top and 51.75 points lower at the bottom, a directional session after Tuesday's compression; Monday's 133.50 point range had been an expansion. The prior week, September 14 through September 18, spanned 7,739.25 at the high and 7,575.00 at the low, so the settle remains 33.25 points above the top of that week's range; the decline has not yet re-entered the structure beneath it.
For the quarterly reference the review uses the 13-week extremes as the available proxy, because no prior-quarter high or low was captured for this session. The 13-week and 52-week high stands at 7,905.00, set on 08/13/26, 132.50 points above the settle, and the 13-week low at 7,386.00, set on 07/29/26. The one-month high of 7,850.75 was set on 08/28/26 and the one-month low of 7,575.00 on 09/16/26.
2.3 4-Hour and Swing Structure
The swing from the 09/16 low at 7,575.00 to Tuesday's 7,848.50 high measures 273.50 points. Wednesday's settle sits 76.00 points beneath that high, a 27.8 percent retracement of the swing measured from the high. The retracement grid published for Thursday places the 38.2 percent retracement from the four-week high at 7,745.41, 27.09 points beneath the settle, and the 50 percent retracement of the four-week range at 7,712.88. The 38.2 percent retracement from the 13-week high sits at 7,706.74, 6.14 points beneath the 50 percent line, so the 7,706.74 to 7,712.88 band is the deepest well-defined retracement shelf of the current swing.
Wednesday's 84.50 point range was 1.16 times the published 14-day average daily range of 73.02, the first above-average range since the 09/21 advance, and it came on a down day. Range expansion in the direction of the decline is the part of the bar that matters most for Thursday.
2.4 Moving Averages
The averages cited in this subsection were computed for this session from the provider's published daily settlement series for the December contract, because the provider's technical page is dated for the Thursday session and substitutes the reopened-session last price for a close. On settlements through Wednesday the 5-day average stands at 7,771.50, the 20-day at 7,743.26, the 50-day at 7,715.77, the 100-day at 7,648.83 and the 200-day at 7,335.37.
The settle sits above all five: 1.00 point above the 5-day, 29.24 above the 20-day, 56.73 above the 50-day, 123.68 above the 100-day and 437.14 above the 200-day. The stack is in order from short to long. The 5-day is effectively at the settle, so Thursday opens with the shortest average as the first decision line, and the projection grid places the 40-day average crossing price at 7,759.89, 12.61 points beneath the settle, with the 18-day crossing at 7,735.81 and the 9-day at 7,728.66.
2.5 Oscillator and Trend Readings
The oscillator figures below are as published on the provider's technical page for the Thursday session, which substitutes the reopened-session price for a close; they are cited as published. Relative strength reads 53.24 on the 9-day, 52.56 on the 14-day, 52.58 on the 20-day, 53.84 on the 50-day and 54.33 on the 100-day, a neutral band around the midpoint. The published 14-day relative-strength grid places the 50 percent line at 7,739.20.
The raw stochastic reads 70.93 percent on the 9-day and 14-day and 70.35 percent on the 20-day, with the 9-day smoothed line at 79.01 percent beneath its 83.24 percent signal. The published grid places the 14-3 day raw stochastic 70 percent threshold at 7,766.45, 6.05 points beneath the settle, and the 50 percent threshold at 7,711.75.
The directional system shows no trend. The directional index reads 18.46 on the 9-day with positive direction 21.36 and negative direction 22.88, 13.46 on the 14-day with 20.54 and 22.68, and 10.26 on the 20-day with 20.12 and 22.27. Every horizon has negative direction marginally above positive, and every index reading is beneath 20. Historic volatility reads 11.58 percent on the 9-day and 10.82 percent on the 14-day.
The composite multi-indicator read published for Thursday is 56 percent buy. The snapshot history reads hold one week ago and 16 percent buy one month ago.
2.6 Volatility and Expected Range
The published 14-day average true range stands at 72.89 points and the 14-day average daily range at 73.02 points; the 9-day figures are 71.53 and 75.25. Adding and subtracting that 72.89 point figure from the 7,772.50 settle frames Thursday between 7,699.61 and 7,845.39. The published standard-deviation bands are tighter: one deviation spans 7,722.00 to 7,823.00 and two spans 7,701.09 to 7,843.91.
The positioning note's implied one-day move for the cash index is 0.66 percent, or 50.86 index points applied to Wednesday's 7,706.03 close, which frames the cash index between 7,655.17 and 7,756.89. The note also publishes an implied-move high of 7,810.36 and low of 7,707.94; the midpoint of that published pair is 7,759.15, which is neither Wednesday's close nor the note's own reference price of 7,764, so the percentage is used here and the published pair is recorded without being relied on.
3.1 Resistance
The Pivot Point at 7,791.50, 19.00 points above the settle, is the first ceiling, and the futures equivalent of the modeled volatility threshold sits immediately beneath it: the cash threshold of 7,715 converts to 7,781.47 at the measured basis, and the positioning note's own futures pair quotes 7,781.7 with SPX 7,715, carrying that source's 66.70 offset. The 7,781 to 7,792 band is therefore where the dealer configuration and the computed pivot meet, and a settle above it would put the cash index back above the threshold.
Above that, the published target price at 7,800.03, the three-and-ten day crossover stall at 7,806.68 and the positioning note's 7,750 cash support level, which converts to 7,816.47, lead to the 7,823.00 to 7,824.25 pair of one standard deviation resistance and Pivot R1. Two standard deviations resistance at 7,843.91 sits 0.66 points above Wednesday's 7,843.25 high, and Tuesday's 7,848.50 high and the one-month high at 7,850.75 close the group. Pivot R2 at 7,876.00, the positioning note's 7,800 cash ceiling at 7,866.47 at the measured basis, and the 52-week high at 7,905.00 are the extended references.
3.2 Support
The 5-day settlement average at 7,771.50, one point beneath the settle, is the first support, with the positioning note's 7,700 cash level converting to 7,766.47 and the stochastic 70 percent threshold at 7,766.45 immediately beneath it. The 40-day average crossing price at 7,759.89 and Wednesday's session low at 7,758.75 follow. The positioning note's own 7,690 cash pivot converts to 7,756.47 at the measured basis, so the 7,756 to 7,760 band is the most important support in the instrument: it holds the session low, a moving-average crossing and the positioning note's pivot.
Beneath it, the 38.2 percent retracement from the four-week high at 7,745.41, the 20-day settlement average at 7,743.26, Pivot S1 at 7,739.75 and the relative-strength 50 percent line at 7,739.20 sit within 6.21 points of each other and form the densest support group. The modeled gamma-flip level at 7,661 cash converts to 7,727.47, near the 9-day crossing at 7,728.66 and one standard deviation support at 7,722.00. The 7,706.74 to 7,715.77 band, holding the 13-week retracement, the 50 percent four-week retracement at 7,712.88 and the 50-day settlement average, sits with Pivot S2 at 7,707.00 and two standard deviations support at 7,701.09. Pivot S3 at 7,655.25 is the extended reference.
4.1 Dollar, Rates, and Fed Policy
The ten-year yield closed at 5.11 percent after a 4.98 to 5.14 range, up 15 basis points from Tuesday's 4.96 percent, and the positioning note described it as the highest level since July 2007. The dollar index closed at 101.10, up 0.50 percent. The five-year note auction at 1:00 PM ET stopped at a 5.033 percent high yield, a tail of 3.1 basis points above the when-issued level of 5.002 percent, with a 2.21 bid-to-cover against a prior 2.37, per the news-feed record and unconfirmed against an official calendar.
The Federal Reserve governor's housing remarks were scheduled at 10:05 AM ET, per the verified forward calendar, and press commentary quoted him as saying further policy adjustments are likely to be needed to bring inflation to target in a timely fashion. The projections published on September 16 showed 12 of 18 officials expecting one more quarter-point increase this year, per a news-feed item stamped 2:00 PM ET that day. The flash surveys at 9:45 AM ET printed manufacturing at 57.0 against 53.7, services at 58.7 against 55.8 and the composite at 58.4 against 55.3, per the news-feed record and unconfirmed against an official calendar, and press commentary described the manufacturing reading as the fastest expansion in four and a quarter years. The next policy meeting is scheduled for October 28 at 2:00 PM ET, per the news-feed calendar and unconfirmed. Strong activity data, a hawkish governor and a weak auction on the same day is the combination that moves the front end and the long end together.
4.2 Large-Cap Leadership and Earnings
The positioning note flagged a large-cap developer conference scheduled for 7:00 PM ET on Wednesday as a key catalyst for the data-center and artificial-intelligence trade, per the positioning note and unconfirmed against an official calendar; that time had passed at the time of writing and no content from it was captured, so its outcome is not asserted. An investment-bank note carried on the news feed, without a captured timestamp, reported the same company's shares up 21 percent since a consumer artificial-intelligence product launched two weeks earlier, against a 1 percent gain for the broad index.
On the calendar, a large-cap retailer reports after Thursday's close with a call at 5:00 PM ET, and a large memory-chip maker reports on September 30 at 4:30 PM ET, both per the verified forward calendar. Neither changes Thursday's cash session directly.
4.3 Geopolitical Backdrop
Press accounts carried remarks by the United States Secretary of State that Iran fired at commercial vessels in the Strait of Hormuz and that talks were being impeded, and Brent settled at 103.08, up 3.86 percent, per a news-feed item stamped 2:40 PM ET. A news-feed headline stamped 7:45 PM ET described the Iranian president sending a defiant message to the United States over potential talks. The index's exposure to that story runs through crude, inflation expectations and the ten-year yield.
On China, a news-feed item stamped 4:10 PM ET reported that China had taken possession of sensitive military aircraft parts diverted to Hong Kong, and the Chinese leader was scheduled to arrive at the White House at 6:00 PM ET, per the news-feed calendar and unconfirmed. After the close, a report stamped 8:15 PM ET said the United States and China had extended their trade truce through January 10, which is the most constructive overnight item for the index.
4.4 Sector Breadth and Rotation
The positioning note recorded the software fund up about 1 percent, the semiconductor fund down about 1 percent and memory names down about 3 percent, and press commentary described chipmakers and artificial-intelligence infrastructure stocks as sliding. The Dow Jones Industrial Average closed down 0.68 percent and the Nasdaq-100 cash index down 0.85 percent, per press commentary and the provider's daily record, so the decline was broad across the major indices with technology hardware at its centre. No advance-decline or up-volume series was captured for this session, so breadth is not measured beyond those index-level figures.
A news-feed item stamped 12:45 PM ET reported that the United States was preparing a 90-day diesel export ban; the White House called the report false in items stamped 1:41 PM and 1:59 PM ET. The episode touched energy and refining names rather than the index as a whole.
4.5 Cross-Asset and Volatility
The volatility index closed at 15.18, up 0.97 points or 6.83 percent, and the positioning note recorded the volatility-of-volatility index up about 7 percent to 89. The positioning note also recorded index fixed-strike implied volatilities as relatively flat despite the selloff, which it read as the options market not yet pricing sustained volatility. December gold settled at 4,318.4, down 1.33 percent, and November WTI at 92.16, up 1.81 percent. Equities, bonds and gold all fell together while crude and the dollar rose, which is the cross-asset signature of an inflation-and-rates shock rather than a growth scare.
4.6 Institutional Positioning
The positioning report as of September 15, 2026 remains the latest captured. Leveraged funds held 161,176 long against 454,319 short, a net short of 293,143, after covering 42,302 shorts on the week. Asset managers held 1,142,075 long against 237,391 short, a net long of 904,684, and dealers held 220,012 long against 922,950 short. Open interest on the December contract stood at 1,884,650 at the latest published reading.
The leveraged-fund book remains heavily net short even after that week's covering, which means a squeeze remains available on good news, and the asset-manager book is heavily net long, which means the long side has the most to hedge on bad news. The positioning note's minus 20 billion dollar hedging reading on Wednesday is consistent with the second of those behaviours, though the report predates Wednesday by six sessions and cannot confirm it.
5. Index Options Flow Context
This is the primary flow surface for this instrument rather than a proxy, and every level quoted from it is a cash index value unless a futures pair is stated explicitly.
The reference price column requires care and was checked explicitly. That column is the prior session's close, not Wednesday's. The cash index reference of 7,764 less the stated 0.755 percent decline returns 7,705.4 against the published cash close of 7,706.03, and the technology index reference of 30,732 less its 0.853 percent decline returns 30,469.9 against its close of 30,470.29. The reference column is therefore Tuesday's close on every symbol in the table.
The dealer-positioning stack reads a modeled volatility threshold at 7,715, a primary gamma concentration at 8,000, a call-side ceiling at 7,800 and a put-side base at 7,500, with a modeled gamma-flip level at 7,661. The gamma index reads 5.42, gamma tilt 1.498 and gamma notional 1.225 billion dollars. The 25-delta risk reversal sits at minus 0.027. Call volume was 693,214 contracts against put volume of 1.065 million, and call open interest 8.927 million against put open interest 12.726 million. The mapped key cash levels are 8,000, 7,000, 7,700 and 7,800, and the positioning note's own summary lists resistance at 7,800, a pivot at 7,690 and support at 7,750 and 7,700.
The cash close at 7,706.03 sits 8.97 points beneath the modeled volatility threshold at 7,715 and 45.03 points above the modeled gamma-flip level at 7,661. That places the index between the two model boundaries, a zone in which dealer hedging dampens movement less than it does above the threshold; this is the model's interpretation of the configuration rather than a measured cause of Thursday's behaviour. The positioning note also recorded that customer put-selling positions around 7,700 were trimmed as the market moved lower and that the model's gamma reading around that strike turned negative by the end of the session.
The futures column requires the same care as on Tuesday. The table's December futures column reads a reference of 7,830.70, a modeled volatility threshold of 7,781.70, a primary gamma concentration of 8,066.70, a call-side ceiling of 7,866.70, a put-side base of 7,566.70 and a modeled gamma-flip level of 7,727.70. Every one of those is the corresponding cash value plus exactly 66.70, so the column is a fixed-offset translation rather than an independent futures quote, and its reference of 7,830.70 is Tuesday's cash reference translated, not Wednesday's futures settle of 7,772.50. The basis measured this session is 66.47, and where a level in section 3 is quoted as a futures-and-cash pair from this source it carries the source's 66.70 offset and is labelled as such.
On flow, the positioning note recorded index hedging delta of minus 20 billion dollars on the day, described as the largest negative reading in the past year and dominated by same-day expiries, with a 2 billion dollar spread between non-same-day puts and same-day puts that it read as hedging demand. Single-stock hedging delta was minus 4.5 billion dollars, of which minus 2.5 billion was longer-dated call selling and minus 2 billion put buying. These are the positioning note's characterisations; no timestamp-aligned flow series was captured for this session.
The mapped confluence levels with their conviction scores give the finest-grained map available for Thursday. Around the close: 7,772 at 99.22, 7,765 at 72.42, 7,757 at 73.32, 7,749 at 94.23 and 7,703 at 93.11. Above: 7,780 at 97.46, 7,788 at 99.78, 7,796 at 92.55, 7,803 at 99.95, 7,811 at 97.86 and 7,827 at 99.62. Beneath: 7,648 at 93.90, 7,602 at 96.54 and 7,501 at 97.39. These are cash values and conviction scores rather than calibrated frequencies, and they are treated as such.
An equity positioning dashboard row for this index, updated on Wednesday, showed a current price of 7,704.20 against a previous close of 7,764.64, a daily change of minus 0.78 percent, share volume of 3,189,783,101, call gamma of 5.2 billion dollars, put gamma of minus 609 million dollars and next-expiry gamma at 10.30 percent. Its prior-close field agrees with the published cash series on Wednesday, unlike Tuesday's reading. Its 52-week low field reads zero and is unused, and its high-volatility-point and low-volatility-point fields, 8,005 and 7,735, are excluded as low-confidence.
6.1 Night Session (6:00 PM ET Wednesday to 3:00 AM ET Thursday, Globex and Asia)
The Globex reopen carries the Chinese leader's White House arrival at 6:00 PM ET, per the news-feed calendar and unconfirmed, the large-cap developer conference that began at 7:00 PM ET, per the positioning note and unconfirmed, and the trade truce extension reported at 8:15 PM ET. The reopened session was trading between 7,767.00 and 7,779.25 at the time of reading. Japanese flash purchasing-manager surveys print at 8:30 PM ET and Australian labour data at 9:30 PM ET, both per the news-feed calendar and unconfirmed. Bias neutral around the 5-day settlement average at 7,771.50, beneath the 7,781 to 7,792 band. Expected Globex band roughly 7,745 to 7,800.
6.2 London Session (3:00 AM to 8:00 AM ET Thursday)
The Swiss and Norwegian policy decisions land at 3:30 AM ET and 4:00 AM ET, the German business climate survey at 4:00 AM ET and a Federal Reserve speaker at 4:10 AM ET, all per the news-feed calendar and unconfirmed. For the index the European window matters through the direction of global yields. Bias neutral with a downward lean beneath 7,781.47, expected band roughly 7,740 to 7,800.
6.3 Morning Session (9:30 AM to 12:00 PM ET Thursday, regular trading hours open)
Weekly jobless claims print at 8:30 AM ET with a consensus of 200,000 against a prior 196,000, per the news-feed calendar and unconfirmed, and the second-quarter international transactions release lands at 8:30 AM ET, per the verified forward calendar. Federal Reserve speakers appear at 8:30 AM, 8:50 AM and 10:10 AM ET, per the news-feed calendar and unconfirmed, and new home sales print at 10:00 AM ET, per the verified forward calendar. The cash open at 9:30 AM ET is the session's first directional test, and the 7,756 to 7,760 band of the session low, the 40-day crossing and the positioning note's pivot is the level that test is fought over. Expected band roughly 7,720 to 7,810.
6.4 Afternoon Session (12:00 PM to 4:00 PM ET Thursday)
The seven-year note auction at 1:00 PM ET, where the prior auction stopped at a 4.512 percent high yield, per the news-feed calendar and unconfirmed, is the afternoon's rate event, and after Wednesday's five-year tail it is the most direct read on demand for duration. A dealer financing survey is published at 2:00 PM ET, per the verified forward calendar. Expected band roughly 7,725 to 7,805.
6.5 Night Session Forward (6:00 PM ET Thursday)
A large-cap retailer reports with a call at 5:00 PM ET, per the verified forward calendar. The forward anchor is the durable goods report at 8:30 AM ET on September 25, 2026, per the verified forward calendar. The larger forward grouping is the personal income and outlays report at 8:30 AM ET on September 30 and the employment report at 8:30 AM ET on October 2, both per the verified forward calendar, with the positioning note also listing quarter end on September 30.
6.6 Expected Range (Thursday Full Session)
Low-range scenario: 7,745 to 7,800
Mid-range scenario (most likely): 7,725 to 7,815
High-range scenario: 7,700 to 7,845
6.7 Most Likely Path
The most probable path holds the reopened session near the 5-day settlement average through Asia and Europe, with the trade truce extension offering modest support and global yields the main input. Through the United States morning the contract tests the 7,756 to 7,760 band, and in this review's analyst judgment a test of the 7,739.20 to 7,745.41 group is more likely than a recovery of the 7,781 to 7,792 band before the 1:00 PM ET auction, because the cash index settled beneath the modeled volatility threshold on a 15 basis point rise in yields that the overnight news does not reverse; that weighting is judgment rather than a measured frequency. The alternative that would invalidate this reading is a settle above Pivot R1 at 7,824.25.
7. Thursday Economic Calendar
The overnight block carries the Chinese leader's White House arrival at 6:00 PM ET Wednesday and the state visit running all day Thursday, both per the news-feed calendar and unconfirmed. Japanese flash purchasing-manager surveys print at 8:30 PM ET Wednesday, prior composite 53.5, per the news-feed calendar and unconfirmed. Australian employment data follows at 9:30 PM ET with the unemployment rate forecast at 4.5 percent, per the news-feed calendar and unconfirmed.
The European morning carries the Swiss and Swedish policy decisions at 3:30 AM ET, per the news-feed calendar and unconfirmed. The Norwegian decision lands at 4:00 AM ET with a forecast of 4.5 percent against a current 4.25 percent, per the news-feed calendar and unconfirmed. The German business climate survey prints at 4:00 AM ET, per the news-feed calendar and unconfirmed. A Federal Reserve speaker appears at 4:10 AM ET, per the news-feed calendar and unconfirmed.
The United States morning carries weekly jobless claims at 8:30 AM ET, consensus 200,000 against a prior 196,000, and continuing claims forecast at 1.74 million, per the news-feed calendar and unconfirmed. The second-quarter international transactions release lands at 8:30 AM ET, per the verified forward calendar. Federal Reserve speakers appear at 8:30 AM, 8:50 AM and 10:10 AM ET, per the news-feed calendar and unconfirmed. New home sales print at 10:00 AM ET, per the verified forward calendar, with a consensus of 0.615 million units per the news-feed calendar and unconfirmed. A tentative Treasury liquidity buyback is listed for 11:00 AM ET and a seven-year note auction for 1:00 PM ET, per the news-feed calendar and unconfirmed. A dealer financing survey is published at 2:00 PM ET and a large-cap retailer reports with a call at 5:00 PM ET, both per the verified forward calendar.
The single first-order event for the index on Thursday is the 1:00 PM ET seven-year auction, per the news-feed calendar and unconfirmed, because Wednesday's decline ran through the rate channel. The next first-order release is the durable goods report at 8:30 AM ET on September 25, 2026, per the verified forward calendar.
8. Primary Trade Setup
Direction: Short
Rationale: The contract made a lower high and a lower low on an expanded range and settled at 16.3 percent of it, the cash index closed beneath the modeled volatility threshold on a hedging reading the positioning note described as the largest negative in the past year, and the ten-year yield rose 15 basis points to 5.11 percent; the averages remain intact underneath, so the setup is a short from a retracement into the pivot and the threshold equivalent rather than a breakdown short.
Entry Zone: 7,782 to 7,798
Stop Loss: 7,826 (above Pivot R1 at 7,824.25 and one standard deviation resistance at 7,823.00)
Target 1 (T1): 7,754 (beneath Wednesday's session low at 7,758.75 and the 7,756 to 7,760 band)
Target 2 (T2): 7,718 (just above the 50-day settlement average at 7,715.77 and the 50 percent four-week retracement at 7,712.88)
Target 3 (T3, extended): 7,682 (beneath three standard deviations support at 7,685.04 and above the 38.2 percent retracement from the four-week low at 7,680.34)
Risk-to-Reward: Approximately 1:1 to T1, 1:2 to T2, 1:3 to T3
Invalidation: A settle above 7,824.25 negates the thesis, because it would recover Pivot R1 and put the cash index well above the modeled volatility threshold. Short of that, the edge is removed by acceptance above the three-and-ten day crossover stall, defined as two consecutive 30-minute closes above 7,806.68. A single trade into the entry band that is rejected inside one 30-minute bar does not meet the invalidation.
Macro override: A well-received developer conference overnight, a claims print that is followed by lower yields (the direction of the yield response, not the claims figure itself, is what matters here), or a seven-year auction that stops through its when-issued level, per the news-feed calendar and unconfirmed, would reverse the rate channel behind Wednesday's decline. With leveraged funds net short 293,143 contracts as of September 15, a reversal in the rate channel could produce a squeeze through the stop rather than a gradual recovery.
Sources and methodology
This outlook is built from our session review of the December E-mini S&P 500 contract, the December ’26 contract, prepared after Wednesday's close on September 23, 2026 for the Thursday, September 24, 2026 session. Wednesday's completed extremes are recovered from the published pivot ladder: Pivot R3 at 7,908.75 less Pivot S3 at 7,655.25, divided by three, and Pivot R2 at 7,876.00 less Pivot S2 at 7,707.00, divided by two, both return 84.50, and three times the 7,791.50 pivot less the settle gives a high-plus-low sum of 15,602.00, which yields 7,843.25 and 7,758.75 and reproduces all seven published rungs. The provider's daily record agrees at 7,830.00, 7,843.25, 7,758.75 and 7,772.50 on 1,488,717 contracts; it is a second surface of the same vendor, so it confirms internal consistency and not the underlying quote.
The contract domain was checked before any level was used: the chart read 7,768.50 with a stated change of minus 0.05 percent, and the provider's quote at the same time read 7,768.25, down 4.25, against a previous close of 7,772.50, so both sit on the same December contract. The new session's 7,774.75 open, 7,779.25 high and 7,767.00 low belong to Thursday and are never presented as Wednesday's range. The moving averages were computed from the provider's daily settlement series; the oscillators are cited as published for the Thursday session, which substitutes the reopened-session price for a close. Cash index levels from the positioning note are quoted as published; its reference column is the prior session's close, and its futures column is a fixed 66.70 translation, so any conversion made here uses the 66.47 basis measured this session, the 7,772.50 settle less the 7,706.03 cash close. The reference-column check is arithmetic: the 7,764 cash reference less the stated 0.755 percent decline returns 7,705.4 against the 7,706.03 close, and the technology index reference of 30,732 less 0.853 percent returns 30,469.9 against 30,470.29. The note's published implied-move pair of 7,810.36 and 7,707.94 has a midpoint of 7,759.15, which matches neither the close nor the reference, so it is recorded but not relied on. An equity positioning dashboard row for the index showed 7,704.20 against a previous close of 7,764.64, down 0.78 percent, on 3,189,783,101 shares, with call gamma of 5.2 billion dollars, put gamma of minus 609 million dollars and next-expiry gamma at 10.30 percent; its high-volatility-point and low-volatility-point fields, 8,005 and 7,735, are excluded as low-confidence. Conviction scores are scores, not calibrated frequencies. Scenario ranges are analyst judgment. Items marked unconfirmed come from the news-feed calendar or record. No timestamp-aligned price and flow series was captured for this session, and no order of events is asserted.
Wednesday’s outlook for this contract is here, and the Nasdaq-100 contract's Wednesday outlook covers the index that fell 0.85 percent on the same session. Outlooks for ES, NQ, GC and CL are collected on the market outlook page, and our forward trading record is on the performance statement.



