
Inside the 8:30 PM ET bar on Tuesday evening, two and a half hours after the reopen, the December S&P 500 contract printed 7,884.50. Nothing in Wednesday's session traded higher. The low came much later. The review places the 7,815.75 low inside the 10:30 AM ET bar, which traded from 7,815.75 to 7,828.00. Only selected half-hour bars were preserved, so the path between those two prints is not on record.
December E-mini futures settled at 7,852.75, down 21.25 points or 0.27 percent from Tuesday's 7,874.00. The daily row spans 7,884.50 to 7,815.75, a 68.75 point range, 0.89 times the 14-day average daily range of 77.23 points. The settle finished at 53.8 percent of that range. The streak is over. Wednesday printed a lower high and a lower low against Tuesday, ending a run of four higher settles that had added 158.50 points from the 7,715.50 settle of 09/30. The cash index closed at 7,801.77, down 0.22 percent. The news feed's post-close wrap described the record-setting advance as halted by high oil prices and renewed rate-increase concerns.
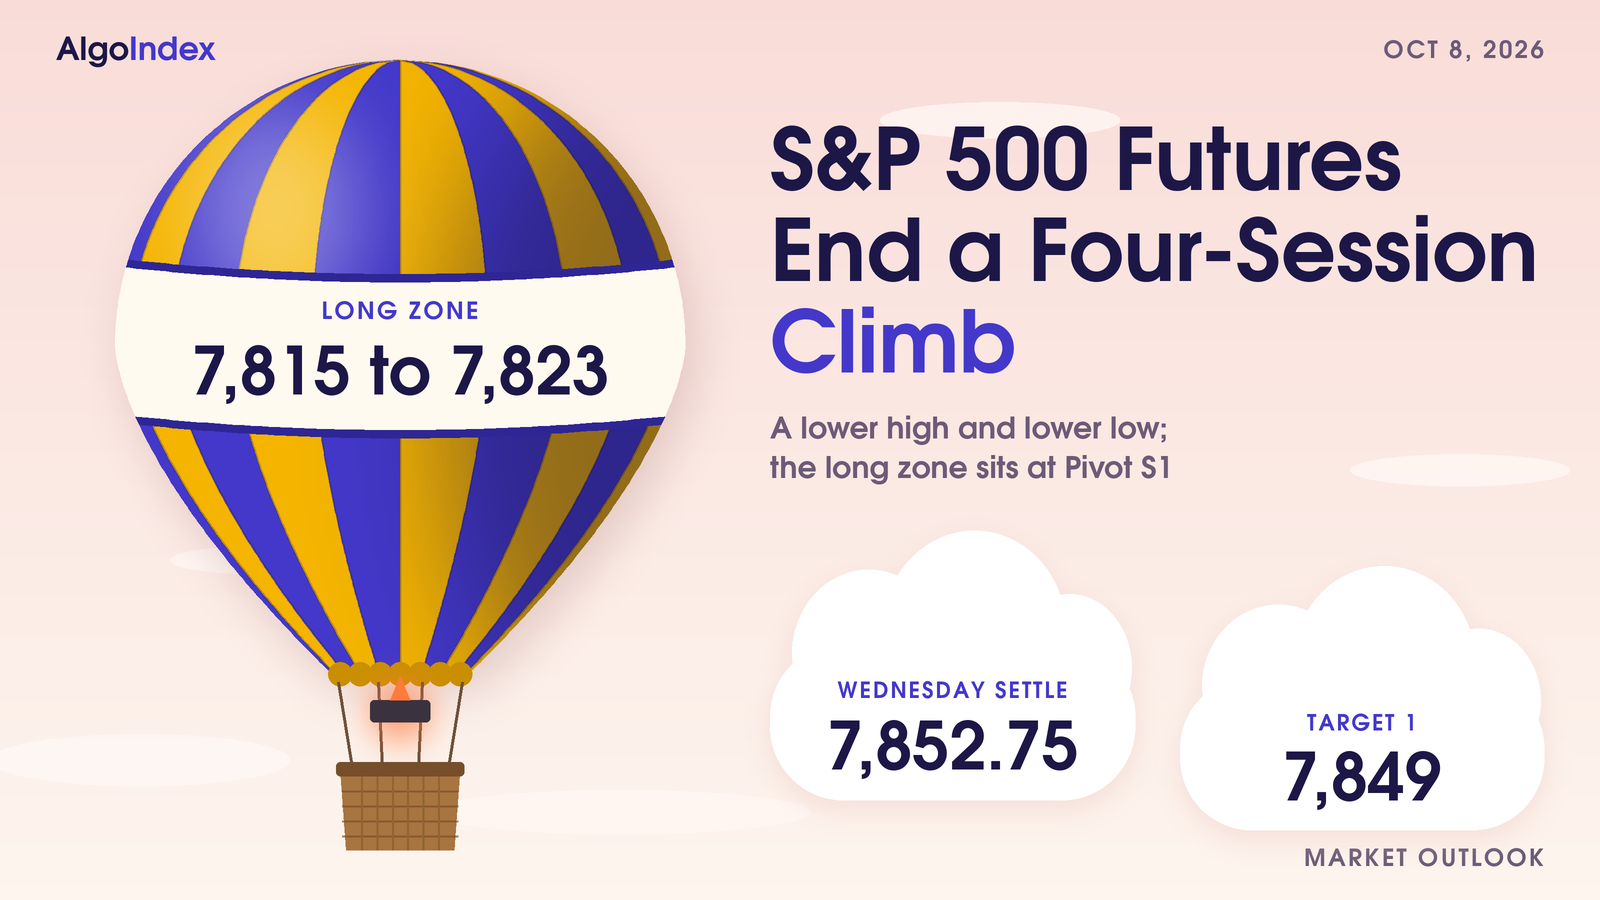
December S&P 500 futures settled at 7,852.75, 1.75 points above the 7,851.00 Pivot Point and above every settlement average from the 5-day to the 200-day. The primary setup is a long from 7,815 to 7,823 around Pivot S1 at 7,817.50 and Wednesday's 7,815.75 low, stop 7,789 beneath one standard deviation support at 7,792.23, targets 7,849, 7,879 and an extended 7,909. The band sits beneath the market. The settle finished 29.75 points above its top, so the setup needs a pullback to engage. Overhead, Wednesday's 7,884.50 high and Pivot R1 at 7,886.25 sit 1.75 points apart, and the 7,905.00 52-week high sits 52.25 points above the settle. Dealer positioning frames the close. The cash index closed 48.23 points beneath the 7,850 call-side ceiling and 36.77 above the 7,765 modeled volatility threshold, with dealer gamma positive, per the positioning note. Thursday's first-order event, in the review's judgment, is the 1:00 PM ET thirty-year bond auction, per the news-feed calendar and unconfirmed.
Wednesday's 7,815.75 low ran through the long band and the stop level
Wednesday's outlook set a long from 7,852 to 7,860, stop 7,826, targets 7,886, 7,916 and an extended 7,946. Wednesday's completed bar, from tonight's review and the provider's dated 2026-10-07 row, opened at 7,881.50 at the Tuesday 6:00 PM ET reopen, marked a high of 7,884.50 and a low of 7,815.75, and settled at 7,852.75. The two sources agree. The whole band traded. The open sat 21.50 points above its 7,860 top, and the low went 36.25 points beneath its 7,852 bottom. The 7,826 stop level traded too, with the low 10.25 points beneath it.
The first target never printed. The 7,886 level sat 1.50 points above the 7,884.50 high, and the 7,916 and 7,946 levels sat 31.50 and 61.50 points above it. That miss needs no timing. No print anywhere in the session reached 7,886.
The order is only partly on record. The review places the high inside the 8:30 PM ET bar on Tuesday evening and the low inside the 10:30 AM ET bar, and it makes no claim about the path between selected bars. So the record cannot say when price first entered the band, or whether it did so before or after the high. It cannot date the first print at 7,826 either. No fill and no result is asserted.
One invalidation test held and one cannot be settled. The card named a settle beneath Pivot S1 at 7,836.17, and the 7,852.75 settle finished 16.58 points above it after the low went 20.42 points beneath. Its acceptance line needed two consecutive 30-minute closes beneath 7,840. The review gives one qualifying bar. The 10:30 AM ET bar traded from 7,815.75 to 7,828.00, so it closed beneath the line. The review records neither neighbour of that bar, so a second consecutive close is not on record here. Its 3:30 PM ET bar, between 7,848.50 and 7,856.50, closed above the line.
Our bottom edges sat too high this time. In Wednesday's outlook we gave 7,830 to 7,920 as the most likely band. The settle finished inside it, but the low broke its bottom by 14.25 points, while the high stopped 35.50 points beneath its top. The low-range case of 7,850 to 7,900 broke by 34.25 at the bottom. The wider frames held. The high-range case of 7,796 to 7,952 and the one-range envelope of 7,796.19 to 7,951.81 contained the whole session, with the low 19.75 and 19.56 points above their bottoms.
The one-deviation band held as well. The 7,815.75 low stayed 9.24 points above one standard deviation support at 7,806.51. Above, the high stopped 56.99 points beneath one deviation resistance at 7,941.49.
Two session bands can be checked. The 7,884.50 high came inside the 8:30 PM ET bar, within the Globex window, and sat 15.50 points beneath the 7,900 top of the 7,850 to 7,900 Globex band. The 7,815.75 low came inside the 10:30 AM ET bar, within the morning window, and broke the 7,835 bottom of the 7,835 to 7,915 morning band by 19.25 points. The 3:30 PM ET bar sat inside the 7,825 to 7,935 afternoon band. London cannot be graded. The review records no bar from that window.
The weighted path missed. Wednesday's outlook weighted a hold above the 7,866.83 Pivot Point into the cash open and a test of the 7,904.67 to 7,905.00 pairing of Pivot R1 and the 52-week high before the 2:00 PM ET minutes. The high stopped 20.17 points beneath Pivot R1. The settle finished 14.08 points beneath that pivot. The alternative named a hawkish reading of the minutes that pushes the contract beneath Monday's 7,826.25 settle. The low did sit 10.50 points beneath that settle, yet the review places it in the 10:30 AM ET bar, hours before the 2:00 PM ET minutes, and the settle finished 26.50 points above it.
The macro override cannot be graded cleanly. It named a hawkish reading of the minutes that lifts the ten-year yield back above Monday's closing level of 5.31 percent, or a Gulf escalation that lifts crude and yields together. The ten-year yield index touched 5.36 percent, which provider commentary called a 24-year high, and closed at 5.27 percent. The review does not time that high against the minutes. November crude settled 1.16 lower. We grade the card as written.
Lower on both ends. The 7,884.50 high sat 13.00 points beneath Tuesday's 7,897.50, and the 7,815.75 low sat 13.25 points beneath Tuesday's 7,829.00. Session highs over the last six sessions read 7,782.00, 7,767.75, 7,810.25, 7,847.50, 7,897.50 and 7,884.50. The lows read 7,705.50, 7,672.75, 7,723.25, 7,760.25, 7,829.00 and 7,815.75. The prior week, September 28 through October 2, spanned 7,672.75 to 7,810.25. Wednesday's low sat 5.50 points above that week's high, so the whole session traded above the prior week. Wednesday gave back 21.25 of the 158.50 points the four higher settles had added.
Late prints sat near the settle. The chart's 3:30 PM ET bar traded between 7,848.50 and 7,856.50, and the 4:30 PM ET bar, after the settlement, between 7,847.75 and 7,851.00. The Thursday session reopened at 6:00 PM ET Wednesday. The provider's day open, high and low of 7,850.75, 7,855.50 and 7,850.50, shown at the time of writing, belong to that new session and are not used for Wednesday.
Pivot S1 at 7,817.50, the 7,815.75 low and the 7,851.00 pivot
The basis narrowed. Wednesday's 7,852.75 settle less the 7,801.77 cash close measures 50.98 points, against 55.07 on Tuesday. Every cash equivalent in this article uses that 50.98 point offset. The positioning note uses its own fixed 52.05 offset, and its published futures pairs carry that figure. Its 7,765 modeled volatility threshold carries a source pair of 7,817.05, its 7,715 modeled gamma-flip level 7,767.05, its 7,850 call-side ceiling 7,902.05, its 7,500 put-side base 7,552.05 and its 8,000 gamma concentration 8,052.05. The cash index finished 5.25 points beneath its 7,807.02 high and 38.43 above its 7,763.34 low.
Support starts at the pivot. The Pivot Point at 7,851.00 (cash 7,800.02) sits 1.75 points beneath the settle. The late bars' lows at 7,848.50 and 7,847.75 and Monday's 7,847.50 high sit just under it. The 40-day average stall price follows at 7,837.00 (cash 7,786.02), 15.75 points beneath the settle.
Then the band that anchors the setup. Tuesday's 7,829.00 low, the 7,828.00 high of the 10:30 AM ET bar and Monday's 7,826.25 settle come first. Pivot S1 at 7,817.50 (cash 7,766.52) and Wednesday's 7,815.75 low (cash 7,764.77) sit 1.75 points apart. The entry band wraps both. It also holds 7,817.05, the source pair of the 7,765 threshold in cash, 0.45 points beneath Pivot S1. Its 7,815 bottom sits 0.75 points beneath the low, and its 7,823 top 5.50 above Pivot S1. The 5-day settlement average at 7,810.85 (cash 7,759.87) sits 4.90 points beneath the low, with the prior week's 7,810.25 high just under it.
A second group sits lower. One standard deviation support at 7,792.23 (cash 7,741.25) is the stop's reference, 3.23 points above the 7,789 stop. The 9-day average at 7,783.58 and Pivot S2 at 7,782.25 (cash 7,731.27) sit 1.33 points apart, with the 7,782.00 high of 09/30 and the 9-day crossing price at 7,781.06 beside them. The stop sits 6.75 points above Pivot S2.
The list thickens beneath. The 7,777.25 settle of 10/02, the 7,775.59 bottom of the one-range frame and the 38.2 percent retracement from the four-week high at 7,774.30 come next. Two standard deviations support at 7,767.16 (cash 7,716.18), the 7,767.05 flip pair 0.11 points beneath it, the 40-day crossing at 7,765.01, the 18-day crossing at 7,762.10 and Monday's 7,760.25 low follow. Then the slower averages. The 50-day sits at 7,757.41 and the 20-day at 7,752.01.
The ladder ends at a pair. Pivot S3 at 7,748.75 (cash 7,697.77) and three standard deviations support at 7,747.92 (cash 7,696.94) sit 0.83 points apart. Further down sit the 50 percent retracement of the four-week range at 7,736.25, the 7,715.50 settle of 09/30 and the 38.2 percent retracement from the 13-week high at 7,706.74. The 100-day average at 7,677.35, the prior week's 7,672.75 low, the 7,552.05 put-side base pair (cash 7,500) and the 200-day average at 7,372.74 complete the list.
Resistance starts close. The target price published for Thursday sits at 7,879.67 (cash 7,828.69), 26.92 points above the settle, with Tuesday's 7,874.00 settle and Wednesday's 7,881.50 open beneath it. Wednesday's 7,884.50 high (cash 7,833.52) and Pivot R1 at 7,886.25 (cash 7,835.27) sit 1.75 points apart. That pair is the first real test.
Then the band of the old highs. Tuesday's 7,897.50 high (cash 7,846.52), the 3-10 day average crossover stall price at 7,898.18, the 7,902.05 pair of the 7,850 ceiling and the 7,905.00 52-week high from 08/13/26 (cash 7,854.02) span 7.50 points. The 52-week high sits 52.25 points above the settle. One standard deviation resistance at 7,913.27 (cash 7,862.29) and Pivot R2 at 7,919.75 (cash 7,868.77) sit 6.48 points apart, with the one-range frame top at 7,929.91 above them. Two standard deviations resistance at 7,938.34, Pivot R3 at 7,955.00 (cash 7,904.02), three standard deviations resistance at 7,957.58 and the 8,052.05 gamma concentration pair (cash 8,000) are the extended references.
Every average still sits beneath. The settle stands 41.90 points above the 5-day at 7,810.85, 69.17 above the 9-day at 7,783.58, 100.74 above the 20-day at 7,752.01 and 95.35 above the 50-day at 7,757.41. The 100-day sits at 7,677.35, 175.40 points beneath. The 200-day sits at 7,372.74, 480.01 beneath.
The short averages rose anyway. The 5-day added 27.45 points from Tuesday's 7,783.40, because the 09/30 settle of 7,715.50 left the window and 7,852.75 replaced it. The 9-day rose 9.53 as the 09/24 settle of 7,767.00 left, and the 20-day rose 7.16 as the 09/09 settle of 7,709.50 left. The 50-day still sits 5.39 points above the 20-day. That means the 30 older settlements inside the 50-day window averaged 7,761.00, higher than the most recent 20. For Thursday, the averages would be crossed at 7,781.06 for the 9-day, 7,762.10 for the 18-day and 7,765.01 for the 40-day.
Momentum cooled from high readings. Relative strength reads 62.60 on the 9-day, 58.85 on the 14-day and 56.90 on the 20-day. The raw stochastic reads 80.09 percent on both the 9-day and the 14-day, with the 14-day %K at 87.85 percent above %D at 82.36 percent. Trend strength stays low. On the 9-day, positive direction at 24.33 leads negative at 17.08 with the index at 16.66, and on the 14-day 22.70 leads 18.98 with the index at 12.24. Historic volatility reads 7.47 percent on the 9-day and 9.38 percent on the 14-day. These readings are as published on the provider's technical page dated for the Thursday session, read after the 6:00 PM ET reopen, so they may carry the live Globex price.
The composite multi-indicator read slipped to 80 percent buy from 88 percent buy, with signal strength average and direction strongest. It read 8 percent buy a week ago and 24 percent buy a month ago. One group reads full buy. The short-horizon group averages 60 percent buy, the medium-horizon group 100 percent buy and the long-horizon group 67 percent buy, and the composite trend indicator reads buy.
Ranges ran near their averages. The 14-day average true range stands at 77.16 points and the 14-day average daily range at 77.23; the 9-day figures are 77.54 and 76.08 and the 20-day figures 77.46 and 79.90. One 14-day average true range either side of the settle frames Thursday between 7,775.59 and 7,929.91. The published deviation bands are narrower. Built from five settlements, one deviation spans 7,792.23 to 7,913.27, two 7,767.16 to 7,938.34 and three 7,747.92 to 7,957.58. They describe settlement dispersion, not intraday reach.
Zoom out. The settlement sequence from 09/23 reads 7,772.50, 7,767.00, 7,803.75, 7,746.75, 7,732.00, 7,715.50, 7,724.00, 7,777.25, 7,826.25, 7,874.00 and 7,852.75. Daily ranges for the last eight sessions ran 77.00, 58.50, 76.50, 95.00, 87.00, 87.25, 68.50 and 68.75 points. The last two are the narrowest since the 58.50 point range of 09/29. Three retracements sit beneath. The grid published for Thursday places the 38.2 percent line from the four-week high at 7,774.30, the 50 percent line of the four-week range at 7,736.25 and the 38.2 percent line from the 13-week high at 7,706.74. No four-hour series was captured, so swing structure rests on daily bars only.
A 5.36 percent yield high, the minutes and a thirty-year auction ahead
Yields set the tone. The ten-year yield index closed at 5.27 percent, up one basis point, after a session high of 5.36 percent, and the thirty-year index closed at 5.66 percent, per the provider's quotes. Provider commentary said stocks settled lower on higher Treasury yields, with the ten-year yield touching a 24-year high. The ten-year closed nine basis points beneath that high. A ten-year note auction stopped at 5.300 percent, per the news-feed calendar and unconfirmed, the highest auction yield since November 2000 per the news feed. The dollar index rose 0.40 percent to 102.24.
The minutes came at 2:00 PM ET. The minutes of the September policy meeting were released at 2:00 PM ET on Wednesday, October 7, 2026, as the calendar lists it. Provider commentary said most policymakers judged another rate increase by year-end appropriate. No priced policy probability was captured for this session. Consumer credit rose 8.28 billion dollars against a 15 billion forecast at 3:00 PM ET, as the calendar lists the release, with the figure from the news-feed calendar.
Stocks came off their lows. Provider commentary said they recovered from their worst levels after crude gave up an early advance. The cash index closed at 7,801.77, down 17.16 points, after a session range of 7,763.34 to 7,807.02, per the provider's quote. That ended a record-setting advance, which the news feed's post-close wrap described as halted by high oil prices and renewed rate-increase concerns.
Chips fell harder than the index. The semiconductor index fell 1.15 percent to 13,066.15 and the Nasdaq-100 cash index 0.21 percent to 31,160.08. The Dow Jones industrial average fell 0.66 percent, per provider commentary, so the industrial average lagged the broad index. No sector breadth series was captured, so no further rotation claim is made.
Two technology headlines crossed midday. The equities feed carried a software maker's product event between 1:15 PM ET and 1:57 PM ET with a chipmaker partner, and an artificial-intelligence developer's model release at 2:03 PM ET. These are statements carried by the news feed, not measured effects. The captured calendars carry no mega-capitalisation earnings entry for Thursday. Large bank earnings begin before the open on Tuesday, October 13, 2026, as the calendar lists it.
The Gulf headlines came late. At 3:08 PM ET the news feed carried a press report that the White House is seeking strike options against Iran. At 3:41 PM ET it carried a maritime security notice of a tanker struck near Qatar, with casualties reported. Between 4:35 PM ET and 4:37 PM ET, after the cash close, it carried a statement that Iran and Oman agreed coordinates for safe transit routes through the Strait of Hormuz. These are statements carried by the news feed, not events confirmed for this session.
Commodities fell together. November crude settled at 88.28, down 1.16, or 1.30 percent from 89.44. December gold settled at 4,140.7, down 46.4, or 1.11 percent. The volatility index closed at 15.08, up 0.07, after a session high of 16.01, and the Nasdaq volatility index closed at 21.00.
The model has the index between its lines. The positioning note used here is the 6:21 PM ET edition for Wednesday, and its reference column holds Tuesday's closes: its 7,818 cash reference equals Tuesday's 7,818.93 close. The note places the primary call-side ceiling at 7,850 in cash, the modeled volatility threshold at 7,765, the modeled gamma-flip level at 7,715, the largest gamma concentration at 8,000 and the primary put-side support base at 7,500. The 7,801.77 cash close sits 48.23 points beneath the ceiling. It sits 36.77 above the threshold and 86.77 above the flip level.
Dealer gamma is positive. Gamma tilt reads 1.497 and gamma notional plus 1.482 billion dollars. A positioning console for the cash index, dated 2026-10-07, shows call gamma of 9 billion against put gamma of minus 2.9 billion, with 8.80 percent of gamma attributed to the nearest expiration. In this review's interpretation positive dealer gamma above the 7,765 threshold favours contained ranges and buying of dips toward it.
Then the note's own map. It lists resistance at 7,800, 7,830, 7,850 and 7,900 and support at 7,750 and 7,700, with its own pivot at 7,690 and key strikes at 8,000, 7,800, 7,000 and 7,700, all in cash. The modeled threshold and flip level are model outputs, not option strikes.
The narrative fills in the day. The note said the S&P 500 traded a 56 basis point range, and that same-day put spreads of about 12 thousand contracts around 7,715 and call spreads of about 8 thousand around 7,830 were established around 10:30 AM ET. It said the hedging-flow measure finished at plus 12 billion dollars of delta, driven mostly by same-day put selling, and that the index bounced from the 7,765 hedge level toward 7,800. It also said one-month implied correlation fell to 8, an extremely low reading. That is the note's reading.
Implied volatility stays low. At-the-money implied volatility sits around 9 to 10 percent, per the note, and its implied one-day move is 0.58 percent. Applied to the 7,801.77 cash close, that is 45.25 points, about 45. The volatility-of-volatility index closed at 83, per the note.
Activity rose. Volume was 1,347,574 contracts on Wednesday's dated row against 1,262,330 on Tuesday's, an increase of 85,244. The open-interest column shows 1,889,967 for Wednesday, the same figure the record carried for Tuesday before revision, so the column appears lagged one session. Tuesday's revised row now reads 1,918,632. No open-interest change is asserted. No weekly positioning report figure was captured for the contract, so no positioning change is asserted either.
The trade map for Thursday
The primary setup is a long from 7,815 to 7,823. The settle sits above every average from the 5-day to the 200-day, positive direction leads on the 9-day and 14-day directional systems, and the composite reads 80 percent buy with direction strongest. The band holds three references. Pivot S1 at 7,817.50, Wednesday's 7,815.75 low and 7,817.05, the source's futures pair for the 7,765 modeled volatility threshold in cash, all sit inside it. Beneath that threshold, the review says, dealer positioning offers less dampening. The stop sits at 7,789, 3.23 points beneath one standard deviation support at 7,792.23 and 6.75 above Pivot S2 at 7,782.25. The targets step up. First comes 7,849, 2.00 points beneath the Pivot Point, then 7,879, 0.67 beneath the published target price, then an extended 7,909, 4.00 above the 52-week high. Trend-strength readings are low. They lead the review to label the setup an analyst judgment that pullbacks stay shallow while yields stabilise, not a measured edge.
From the 7,819 midpoint the risk to the stop is 30 points, 38.9 percent of the 14-day average true range of 77.16. The targets sit 30, 60 and 90 points above that midpoint. Exact multiples of the risk. The settle sits 29.75 points above the top of the band and 37.75 above its bottom, and the review frames the entry as a pullback into it. It even sits 3.75 points above the first target. A one-range frame from the settle spans 7,775.59 to 7,929.91. It holds the band, the stop and all three targets, with the stop 13.41 points inside its bottom and the extended 7,909 20.91 inside its top. The published one-deviation band runs 7,792.23 to 7,913.27. Its lower edge sits 3.23 points above the stop, and the extended target sits 4.27 points beneath its upper edge.
The scenario ranges are analyst judgment. None carries a calibration. The low-range case runs 7,825 to 7,880, the most likely 7,800 to 7,900 and the high-range case 7,776 to 7,930. Session by session the review expects roughly 7,825 to 7,880 through Globex absent a headline shock, with a neutral bias around the 7,851.00 Pivot Point, and 7,815 to 7,886 through London. The morning band is 7,800 to 7,895, with Pivot S1 at 7,817.50 the first meaningful support. The afternoon band is identical.
The night comes first. The contract reopened at 6:00 PM ET Wednesday with the minutes and the 4:37 PM ET Hormuz transit statement already released, and it opened at 7,850.75, 2.00 points beneath the settle. Japanese current account data are listed at 7:50 PM ET, per the news-feed calendar and unconfirmed. German trade data follow at 2:00 AM ET Thursday, per the news-feed calendar and unconfirmed.
London brings speakers. A Federal Reserve governor speaks on the economic outlook at 4:30 AM ET on Thursday, October 8, 2026, as the calendar lists it. The European Central Bank's meeting account is listed at 7:30 AM ET and the Bank of England governor at 8:15 AM ET, both per the news-feed calendar and unconfirmed.
Then the United States morning. Weekly initial jobless claims are listed at 8:30 AM ET with a forecast of 200 thousand against 197 thousand, per the news-feed calendar and unconfirmed. The cash open follows at 9:30 AM ET. Wholesale inventories are scheduled for 10:00 AM ET, as the calendar lists them. A regional Federal Reserve president is listed at 10:40 AM ET and again at 1:40 PM ET, per the news-feed calendar and unconfirmed.
The auction is the event. A thirty-year bond auction is listed at 1:00 PM ET, per the news-feed calendar and unconfirmed, and in the review's judgment it is the single first-order event for the contract on Thursday, because yields set the tone on Wednesday. Japanese household spending is listed at 7:30 PM ET Thursday, and the preliminary University of Michigan survey at 10:00 AM ET on Friday, both per the news-feed calendar and unconfirmed. The calendar runs on from there. Monday, October 12, 2026 is the Columbus Day holiday with normal futures hours, and the consumer price index for September is scheduled for 8:30 AM ET on Wednesday, October 14, 2026, both as the calendar lists them.
One path is weighted. In this review's analyst judgment the most probable path holds the contract above Pivot S1 at 7,817.50, with a pullback into the 7,815.75 to 7,817.50 band weighted as a buying area. The reasons given are a settle above every computed average, positive direction leading on the 9-day and 14-day directional systems, and an 80 percent buy composite with direction strongest. Low trend-strength readings argue that a break of the 7,905.00 52-week high needs a catalyst. No measured frequency backs it. The alternative that would invalidate this reading is a further rise in yields after the 1:00 PM ET thirty-year auction, per the news-feed calendar and unconfirmed, that takes the contract beneath one standard deviation support at 7,792.23 and toward Pivot S2 at 7,782.25.
Wednesday's low printed 1.75 points beneath Thursday's Pivot S1, and Thursday's band starts 0.75 points beneath that low.
The complete data picture
Every number behind Thursday’s plan, charted first, then the full level lists, then the complete numeric reference underneath.
Full numeric reference, every remaining figure from the session review
1. Executive Summary
The December S&P 500 contract settled at 7,852.75 on Wednesday, down 21.25 points or 0.27 percent from Tuesday's settle of 7,874.00, after trading between 7,884.50 and 7,815.75, a 68.75 point daily range. The settle finished at 53.8 percent of the range, and the 68.75 point range was 0.89 times the published 14-day average daily range of 77.23 points. Wednesday printed a lower high and a lower low against Tuesday, and the decline ended a run of four consecutive higher settles that had added 158.50 points from the 7,715.50 settle of 09/30.
The S&P 500 cash index closed at 7,801.77, down 17.16 points or 0.22 percent, after a session range of 7,763.34 to 7,807.02, per the provider's quote, ending a record-setting advance that the news feed's post-close wrap described as halted by high oil prices and renewed rate-increase concerns. Provider commentary said stocks settled lower on higher Treasury yields, with the ten-year yield touching a 24-year high of 5.36 percent and the minutes of the September policy meeting showing most policymakers judged another increase by year-end appropriate, and that stocks recovered from their worst levels after crude gave up an early advance. The Dow Jones Industrial Average fell 0.66 percent, per provider commentary.
The composite multi-indicator read published for the Thursday session is 80 percent buy, down from 88 percent buy in the prior session's snapshot, with signal strength described as average and direction as strongest. The evening positioning note places the primary call side ceiling at 7,850 in cash, the modeled volatility threshold at 7,765, the modeled gamma-flip level at 7,715 and the largest gamma concentration at 8,000, so the 7,801.77 cash close sits above the threshold and beneath the ceiling, with gamma tilt at 1.497; section 5 carries the detail.
The primary setup is a long from the 7,815 to 7,823 band (cash 7,764.02 to 7,772.02), around Pivot S1 at 7,817.50 and Wednesday's 7,815.75 low, stopped at 7,789 (cash 7,738.02) beneath one standard deviation support at 7,792.23, with objectives at 7,849, 7,879 and an extended 7,909.
2.1 Intraday and Session Review
The Wednesday session opened at 7,881.50 at the Tuesday 6:00 PM ET reopen, 7.50 points above Tuesday's settle, marked a daily high of 7,884.50 and a daily low of 7,815.75, and settled at 7,852.75. The chart's 30-minute bars place the 7,884.50 high inside the 8:30 PM ET bar of Tuesday evening and the 7,815.75 low inside the 10:30 AM ET bar, which traded from 7,815.75 to 7,828.00. Only selected 30-minute bars were preserved rather than a complete intraday series, so this review makes no claim about the path between those bars.
The chart's 3:30 PM ET bar traded between 7,848.50 and 7,856.50 and the 4:30 PM ET bar between 7,847.75 and 7,851.00. The Thursday session reopened at 6:00 PM ET Wednesday; the provider's day open, high and low of 7,850.75, 7,855.50 and 7,850.50 shown at the time of writing belong to that new session, not to Wednesday, even though the overview header still carried Wednesday's date.
The session extremes used here are the completed-session inputs behind the published pivot ladder rather than an independently read bar, back-solved from the outer pivot pairs and verified against every rung. The third resistance point at 7,955.00 minus the third support point at 7,748.75, divided by three, returns 68.75, and the second resistance point at 7,919.75 minus the second support point at 7,782.25, divided by two, returns the same 68.75. Three times the Pivot Point of 7,851.00 less the 7,852.75 settle gives a high plus low sum of 15,700.25, equal to the 15,700.25 of the solved pair, and the pair of 7,884.50 and 7,815.75 reproduces all seven published rungs. Independent corroboration: the provider's settlement row and the chart's completed Wednesday daily bar carry the same 7,884.50 high and 7,815.75 low.
2.2 Daily Structure
Wednesday printed a lower high and a lower low against Tuesday: the 7,884.50 high sits 13.00 points beneath Tuesday's 7,897.50, and the 7,815.75 low sits 13.25 points beneath Tuesday's 7,829.00. The settle sits 52.25 points beneath the 52-week high of 7,905.00, dated 08/13/26. The sequence of session highs over the last six sessions reads 7,782.00, 7,767.75, 7,810.25, 7,847.50, 7,897.50 and 7,884.50, and the sequence of session lows reads 7,705.50, 7,672.75, 7,723.25, 7,760.25, 7,829.00 and 7,815.75.
The prior week, September 28 through October 2, spanned 7,672.75 to 7,810.25, and Wednesday's 7,815.75 low sits 5.50 points above that prior-week high, so the whole Wednesday range traded above the prior week. Settlements over the last six sessions ran 7,715.50, 7,724.00, 7,777.25, 7,826.25, 7,874.00 and 7,852.75.
2.3 4-Hour and Swing Structure
Daily ranges for the last eight sessions ran 77.00, 58.50, 76.50, 95.00, 87.00, 87.25, 68.50 and 68.75, so the last two sessions are the narrowest since the 58.50 point range of 09/29. Wednesday gave back 21.25 of the 158.50 points added over the prior four sessions.
The retracement grid published for Thursday places the 38.2 percent retracement from the four-week high at 7,774.30, the 50 percent retracement of the four-week range at 7,736.25 and the 38.2 percent retracement from the 13-week high at 7,706.74, all beneath the settle. No four-hour series was captured for this session, so swing structure here rests on daily bars only.
2.4 Moving Averages
The averages cited in this subsection were computed from the provider's daily settlement series for the December contract, which holds 259 completed sessions through Wednesday. The 5-day average stands at 7,810.85, the 9-day at 7,783.58, the 20-day at 7,752.01, the 50-day at 7,757.41, the 100-day at 7,677.35 and the 200-day at 7,372.74.
The 7,852.75 settle sits above every one of them: 41.90 points above the 5-day, 69.17 above the 9-day, 100.74 above the 20-day, 95.35 above the 50-day, 175.40 above the 100-day and 480.01 above the 200-day. The 5-day average rose 27.45 points from Tuesday's 7,783.40, because the 09/30 settle of 7,715.50 left the window and was replaced by 7,852.75. The 9-day rose 9.53 points as the 09/24 settle of 7,767.00 left its window, and the 20-day rose 7.16 points as the 09/09 settle of 7,709.50 left.
The 50-day average sits 5.39 points above the 20-day, which means the 30 older settlements inside the 50-day window averaged higher than the most recent 20, at 7,761.00. The projection grid gives the prices at which each average would be crossed on Thursday: 7,781.06 for the 9-day, 7,762.10 for the 18-day and 7,765.01 for the 40-day.
2.5 Oscillator and Trend Readings
The oscillator figures below are as published on the provider's technical page dated for the Thursday session, read after the 6:00 PM ET reopen; the page may carry the live Globex price rather than the settle, so they are quoted as published. The 9-day relative strength reads 62.60, the 14-day relative strength 58.85 and the 20-day relative strength 56.90.
The 9-day raw stochastic reads 80.09 percent and the 14-day raw stochastic 80.09 percent, while the 14-day stochastic %K reads 87.85 percent and the 14-day stochastic %D 82.36 percent.
The 9-day directional index ADX reads 16.66 with the 9-day +DI at 24.33 and the 9-day -DI at 17.08, and the 14-day directional index ADX reads 12.24 with the 14-day +DI at 22.70 and the 14-day -DI at 18.98, so positive direction leads on both while the trend-strength readings stay low. The 9-day historic volatility reads 7.47 percent and the 14-day historic volatility 9.38 percent.
The composite multi-indicator read published for the Thursday session is 80 percent buy, down from 88 percent buy in the prior session's snapshot, against 8 percent buy a week ago and 24 percent buy a month ago, with strength described as average and direction as strongest. The short-horizon group averages 60 percent buy, the medium-horizon group 100 percent buy and the long-horizon group 67 percent buy, and the composite trend indicator reads buy.
2.6 Volatility and Expected Range
The published 14-day average true range stands at 77.16 points and the 14-day average daily range at 77.23 points; the 9-day average true range is 77.54 with a 9-day average daily range of 76.08, and the 20-day average true range is 77.46 with a 20-day average daily range of 79.90. Wednesday's 68.75 point range was 0.89 times the 14-day average daily range.
Adding and subtracting the 14-day average true range of 77.16 points from the 7,852.75 settle frames Thursday between 7,775.59 and 7,929.91. The published standard-deviation bands are built from five settlements: one deviation spans 7,792.23 to 7,913.27, two spans 7,767.16 to 7,938.34 and three spans 7,747.92 to 7,957.58. These bands describe settlement dispersion, not intraday reach.
The volatility index closed at 15.08, up 0.07, after a session high of 16.01, per the provider's quote.
3.1 Resistance
The published target price of 7,879.67 sits first above the settle, with Wednesday's 7,884.50 high and Pivot R1 at 7,886.25 just above it. Tuesday's 7,897.50 high, the 3-10 day average crossover stall price at 7,898.18 and the 52-week high at 7,905.00 follow, then one standard deviation resistance at 7,913.27 and Pivot R2 at 7,919.75. Two standard deviations resistance at 7,938.34, Pivot R3 at 7,955.00 and three standard deviations resistance at 7,957.58 are the extended references.
3.2 Support
Beneath the settle, the Pivot Point at 7,851.00 comes first, then the 40-day average stall price at 7,837.00. Pivot S1 at 7,817.50 and Wednesday's 7,815.75 low form the band that anchors the setup, with the 5-day settlement average at 7,810.85 just beneath. One standard deviation support at 7,792.23, the 9-day settlement average at 7,783.58 and Pivot S2 at 7,782.25 follow, then the 38.2 percent retracement from the four-week high at 7,774.30, two standard deviations support at 7,767.16 and the 40-day and 18-day average crossing prices at 7,765.01 and 7,762.10. Pivot S3 at 7,748.75 and three standard deviations support at 7,747.92 are the deeper references.
4.1 Dollar, Rates, and Fed Policy
The minutes of the September policy meeting were released at 2:00 PM ET on Wednesday, October 7, 2026, as the calendar lists it, and provider commentary said most policymakers judged another rate increase by year-end appropriate. The ten-year yield index closed at 5.27 percent, up one basis point, after a session high of 5.36 percent, and the thirty-year yield index closed at 5.66 percent. A ten-year note auction stopped at 5.300 percent, per the news-feed calendar and unconfirmed, the highest auction yield since November 2000 per the news feed. The dollar index rose 0.40 percent to 102.24. Consumer credit rose 8.28 billion dollars against a 15 billion forecast at 3:00 PM ET on Wednesday, October 7, 2026, as the calendar lists it, with the figure from the news-feed calendar. No priced policy probability was captured for this session.
4.2 Large-Cap Leadership and Earnings
The equities feed carried a software maker's product event between 1:15 PM ET and 1:57 PM ET with a chipmaker partner, and an artificial-intelligence developer's model release at 2:03 PM ET; these are statements carried by the news feed rather than measured effects. The captured calendars carry no mega-capitalisation earnings entry for Thursday. Large bank earnings begin before the open on Tuesday, October 13, 2026, as the calendar lists it.
4.3 Geopolitical Backdrop
The news feed carried at 3:08 PM ET a press report that the White House is seeking strike options against Iran, at 3:41 PM ET a maritime security notice of a tanker struck near Qatar with casualties reported, and between 4:35 PM ET and 4:37 PM ET a statement that Iran and Oman agreed coordinates for safe transit routes through the Strait of Hormuz. These are statements carried by the news feed rather than events confirmed for this session.
4.4 Sector Breadth and Rotation
The semiconductor index fell 1.15 percent to 13,066.15 and the Nasdaq-100 cash index 0.21 percent to 31,160.08, while the Dow Jones Industrial Average fell 0.66 percent, per provider commentary, so the industrial average lagged the broad index. No sector breadth series was captured for this session, so no further rotation claim is made.
4.5 Cross-Asset and Volatility
November crude settled at 88.28, down 1.16, and December gold at 4,140.7, down 46.4. The volatility index closed at 15.08, up 0.07, and the Nasdaq volatility index at 21.00. The measured closing basis, the December settlement of 7,852.75 less the 7,801.77 cash close, both from the provider for the completed session, is 50.98 points, against 55.07 on Tuesday; the cash equivalents in this article use that 50.98 point offset.
4.6 Institutional Positioning
No weekly positioning report figure was captured for the S&P 500 contract for this session, so no positioning change is asserted. Wednesday's volume was 1,347,574 contracts against Tuesday's 1,262,330. The open-interest column on the daily record shows 1,889,967 for Wednesday, the same figure the record carried for Tuesday before revision, so the column appears lagged one session and no open-interest change is asserted.
5. Index Options Flow Context
The positioning note used for this section is the 6:21 PM ET edition for Wednesday. Its reference prices are the prior session's closes, not Wednesday's: its 7,818 cash reference equals Tuesday's 7,818.93 cash close and its 779 reference for the largest S&P 500 exchange-traded fund equals Tuesday's 779.09, and 7,818 less 0.22 percent gives 7,800.8, consistent with the note's stated 7,802 close and the provider's 7,801.77. Every level below is read against Wednesday's 7,801.77 cash close.
On the index the primary call side ceiling sits at 7,850 in cash, the largest gamma concentration at 8,000, the modeled volatility threshold at 7,765, the modeled gamma-flip level at 7,715 and the primary put side support base at 7,500. The close sits 48.23 points beneath the 7,850 ceiling, 36.77 points above the threshold and 86.77 points above the flip level. Gamma tilt reads 1.497 and gamma notional plus 1.482 billion dollars, so dealer gamma is positive. The note's summary lists resistance at 7,800, 7,830, 7,850 and 7,900, support at 7,750 and 7,700 and its own pivot at 7,690, and its key strikes are 8,000, 7,800, 7,000 and 7,700 in cash.
The note publishes its own December futures pair for each level, carrying the source's 52.05 point offset rather than the measured 50.98 point basis: the ceiling at 7,902.05, the largest concentration at 8,052.05, the modeled volatility threshold at 7,817.05, the modeled gamma-flip level at 7,767.05 and the put side support base at 7,552.05. These are quoted as the source's pairs. The modeled threshold and flip level are model outputs, not option strikes.
The narrative said the S&P 500 traded a 56 basis point range, that same-day put spreads of about 12 thousand contracts around 7,715 and call spreads of about 8 thousand around 7,830 were established around 10:30 AM ET, that the S&P 500 hedging-flow measure finished at plus 12 billion dollars of delta driven mostly by same-day put selling, that the index bounced from the 7,765 hedge level toward 7,800, and that one-month implied correlation fell to 8, an extremely low reading. At-the-money implied volatility sits around 9 to 10 percent, the note's implied one-day move is 0.58 percent, or about 45 points on the 7,801.77 close, and the volatility-of-volatility index closed at 83, per the note.
A positioning console for the cash index, dated 2026-10-07, shows call gamma of 9 billion against put gamma of minus 2.9 billion, with 8.80 percent of gamma attributed to the nearest expiration. Its current-price field of 7,795.45 is a post-close indicative quote, not the close, and its high and low volatility point fields are treated as low-confidence and excluded.
In this review's interpretation positive dealer gamma above the 7,765 threshold favours contained ranges and buying of dips toward it, and the setup in section 8 sits on the source's 7,817.05 futures pair for that threshold.
6.1 Night Session (6:00 PM ET Wednesday to 3:00 AM ET Thursday, Globex and Asia)
The contract reopened at 6:00 PM ET Wednesday with the minutes and the 4:37 PM ET Hormuz transit statement already released. Japanese current account data are listed at 7:50 PM ET, per the news-feed calendar and unconfirmed. Bias neutral around the 7,851.00 Pivot Point, expected Globex band roughly 7,825 to 7,880 absent a headline shock.
6.2 London Session (3:00 AM ET to 8:00 AM ET Thursday)
A Federal Reserve governor speaks on the economic outlook at 4:30 AM ET on Thursday, October 8, 2026, as the calendar lists it, and the European Central Bank's meeting account is listed at 7:30 AM ET, per the news-feed calendar and unconfirmed. Expected band roughly 7,815 to 7,886.
6.3 Morning Session (9:30 AM ET to 12:00 PM ET Thursday, regular trading hours open)
Weekly jobless claims are listed at 8:30 AM ET, per the news-feed calendar and unconfirmed, before the cash open at 9:30 AM ET, and wholesale inventories follow at 10:00 AM ET on Thursday, October 8, 2026, as the calendar lists it. A regional Federal Reserve president is listed at 10:40 AM ET, per the news-feed calendar and unconfirmed. Expected band roughly 7,800 to 7,895, with Pivot S1 at 7,817.50 the first meaningful support.
6.4 Afternoon Session (12:00 PM ET to 4:00 PM ET Thursday)
A thirty-year bond auction is listed at 1:00 PM ET, per the news-feed calendar and unconfirmed, and the same regional Federal Reserve president is listed again at 1:40 PM ET, per the news-feed calendar and unconfirmed. Expected band roughly 7,800 to 7,895.
6.5 Night Session Forward (6:00 PM ET Thursday)
Japanese household spending is listed at 7:30 PM ET Thursday, per the news-feed calendar and unconfirmed. The University of Michigan preliminary survey is listed at 10:00 AM ET on Friday, per the news-feed calendar and unconfirmed.
6.6 Expected Range (Thursday Full Session)
Low-range scenario: 7,825 to 7,880
Mid-range scenario (most likely): 7,800 to 7,900
High-range scenario: 7,776 to 7,930
6.7 Most Likely Path
In this review's analyst judgment the most probable path holds the contract above Pivot S1 at 7,817.50, with a pullback into the 7,815.75 to 7,817.50 band weighted as a buying area, because the settle sits above every computed average, positive direction leads on the 9-day and 14-day directional systems and the composite reads 80 percent buy with direction strongest. Low trend-strength readings argue that a break of the 7,905.00 52-week high needs a catalyst. The alternative that would invalidate this reading is a further rise in yields after the 1:00 PM ET thirty-year auction, per the news-feed calendar and unconfirmed, that takes the contract beneath one standard deviation support at 7,792.23 and toward Pivot S2 at 7,782.25.
7. Thursday Economic Calendar
The Thursday session reopened at 6:00 PM ET Wednesday. German trade data are listed at 2:00 AM ET Thursday, per the news-feed calendar and unconfirmed. A Federal Reserve governor speaks on the economic outlook at 4:30 AM ET on Thursday, October 8, 2026, as the calendar lists it. The European Central Bank's meeting account is listed at 7:30 AM ET and the Bank of England governor at 8:15 AM ET, both per the news-feed calendar and unconfirmed.
Weekly initial jobless claims are listed at 8:30 AM ET with a forecast of 200 thousand against 197 thousand, per the news-feed calendar and unconfirmed. The cash open is at 9:30 AM ET. Wholesale inventories are scheduled for 10:00 AM ET on Thursday, October 8, 2026, as the calendar lists it. A regional Federal Reserve president is listed at 10:40 AM ET and again at 1:40 PM ET, and a thirty-year bond auction at 1:00 PM ET, all per the news-feed calendar and unconfirmed. The captured calendars carry no mega-capitalisation earnings entry for Thursday.
Looking a week forward, Monday, October 12, 2026 is the Columbus Day holiday with normal futures hours, as the calendar lists it, large bank earnings begin before the open on Tuesday, October 13, 2026, as the calendar lists it, and the consumer price index for September is scheduled for 8:30 AM ET on Wednesday, October 14, 2026, as the calendar lists it. In this review's judgment the single first-order event for the S&P 500 contract on Thursday is the 1:00 PM ET thirty-year bond auction, per the news-feed calendar and unconfirmed, because yields set the tone on Wednesday.
8. Primary Trade Setup
Direction: Long
Rationale: The settle sits above every average from the 5-day to the 200-day, positive direction leads on the 9-day and 14-day directional systems, and the composite reads 80 percent buy with direction strongest; a pullback into Pivot S1 at 7,817.50 and Wednesday's 7,815.75 low offers a long with a defined risk point beneath one standard deviation support. The entry band also contains 7,817.05, the source's futures pair for the modeled volatility threshold at 7,765 in cash, beneath which dealer positioning offers less dampening. Low trend-strength readings mean the setup is an analyst judgment that pullbacks stay shallow while yields stabilise, not a measured edge.
Entry Zone: 7,815 to 7,823
Stop Loss: 7,789 (beneath one standard deviation support at 7,792.23)
Target 1 (T1): 7,849 (2.00 beneath the Pivot Point at 7,851.00)
Target 2 (T2): 7,879 (0.67 beneath the published target price of 7,879.67)
Target 3 (T3, extended): 7,909 (4.00 above the 7,905.00 52-week high)
Risk-to-Reward: Approximately 1:1 to T1, 1:2 to T2, 1:3 to T3
Invalidation: A settle beneath Pivot S2 at 7,782.25 negates the thesis. Short of that, the edge is removed by acceptance beneath 7,792.23 rather than by a touch, defined as two consecutive 30-minute closes beneath 7,792.23.
Macro override: A sharp rise in yields after the thirty-year auction or an escalation in the Gulf would invalidate the long in real time. In that scenario a gap beneath the 7,789 stop removes the setup before entry, and Pivot S2 at 7,782.25 and Pivot S3 at 7,748.75 become the references within one 14-day average true range of 77.16 points.
Sources and methodology
This outlook is built from our session review of the December E-mini S&P 500 contract, the December ’26 contract, prepared after Wednesday's close on October 7, 2026 for the Thursday, October 8, 2026 session. Wednesday's completed extremes are recovered from the published pivot ladder: Pivot R3 at 7,955.00 less Pivot S3 at 7,748.75, divided by three, and Pivot R2 at 7,919.75 less Pivot S2 at 7,782.25, divided by two, both return 68.75, and three times the 7,851.00 Pivot Point less the settle gives a high-plus-low sum of 15,700.25, equal to the solved pair of 7,884.50 and 7,815.75, which reproduces all seven published rungs. The provider's dated row agrees at 7,881.50, 7,884.50, 7,815.75 and 7,852.75, on volume of 1,347,574 contracts and open interest of 1,889,967. It is a second surface of the same vendor, so it confirms internal consistency and not the underlying quote. That row and the review's own statements are the only evidence used to grade Wednesday's card. The review places the high and the low in two selected 30-minute bars; no claim is made about the path between them. Tuesday's row now reads volume of 1,262,330 and open interest of 1,918,632, revised figures that replace the 1,197,046 and 1,889,967 carried on Wednesday's outlook; that post was not changed.
The contract domain was checked before any level was used: the explicit-month chart's completed Wednesday bar equals the provider's settlement row, the chart's current Thursday bar opened at 7,850.75, equal to the provider's day open, and the provider's published previous close of 7,852.75 equals the settlement. The Globex session reopened at 6:00 PM ET Wednesday, so the overview page's day high, day low and open belong to the Thursday session and are not used as Wednesday's range. The moving averages were computed from the 259-row daily settlement series, which excludes the partial Thursday row; the oscillators are cited as published for the Thursday session. The positioning note used is the 6:21 PM ET edition for Wednesday, October 7, and its cash levels are quoted as published. Its reference column is the prior session's close and its futures column a fixed 52.05 translation, so any cash equivalent given here uses the 50.98 basis measured this session, settlement against cash close. The cash-index console's current-price field of 7,795.45 is a post-close indicative quote, not the close, and its high and low volatility point fields are excluded as low-confidence; modeled thresholds are never called strikes. The cash index extremes and the other cross-asset closes come from the provider's quote read at about 6:25 PM ET. Scenario ranges are analyst judgment. Items marked unconfirmed come from the news-feed calendar or press reports. Every catalyst whose release time had passed at the time of writing is recorded as completed.
Wednesday’s outlook for this contract is here, and the Nasdaq-100 contract's Wednesday outlook covers the index that fell 0.21 percent in cash on Wednesday. Outlooks for ES, NQ, GC and CL are collected on the market outlook page, and our forward trading record is on the performance statement.



