
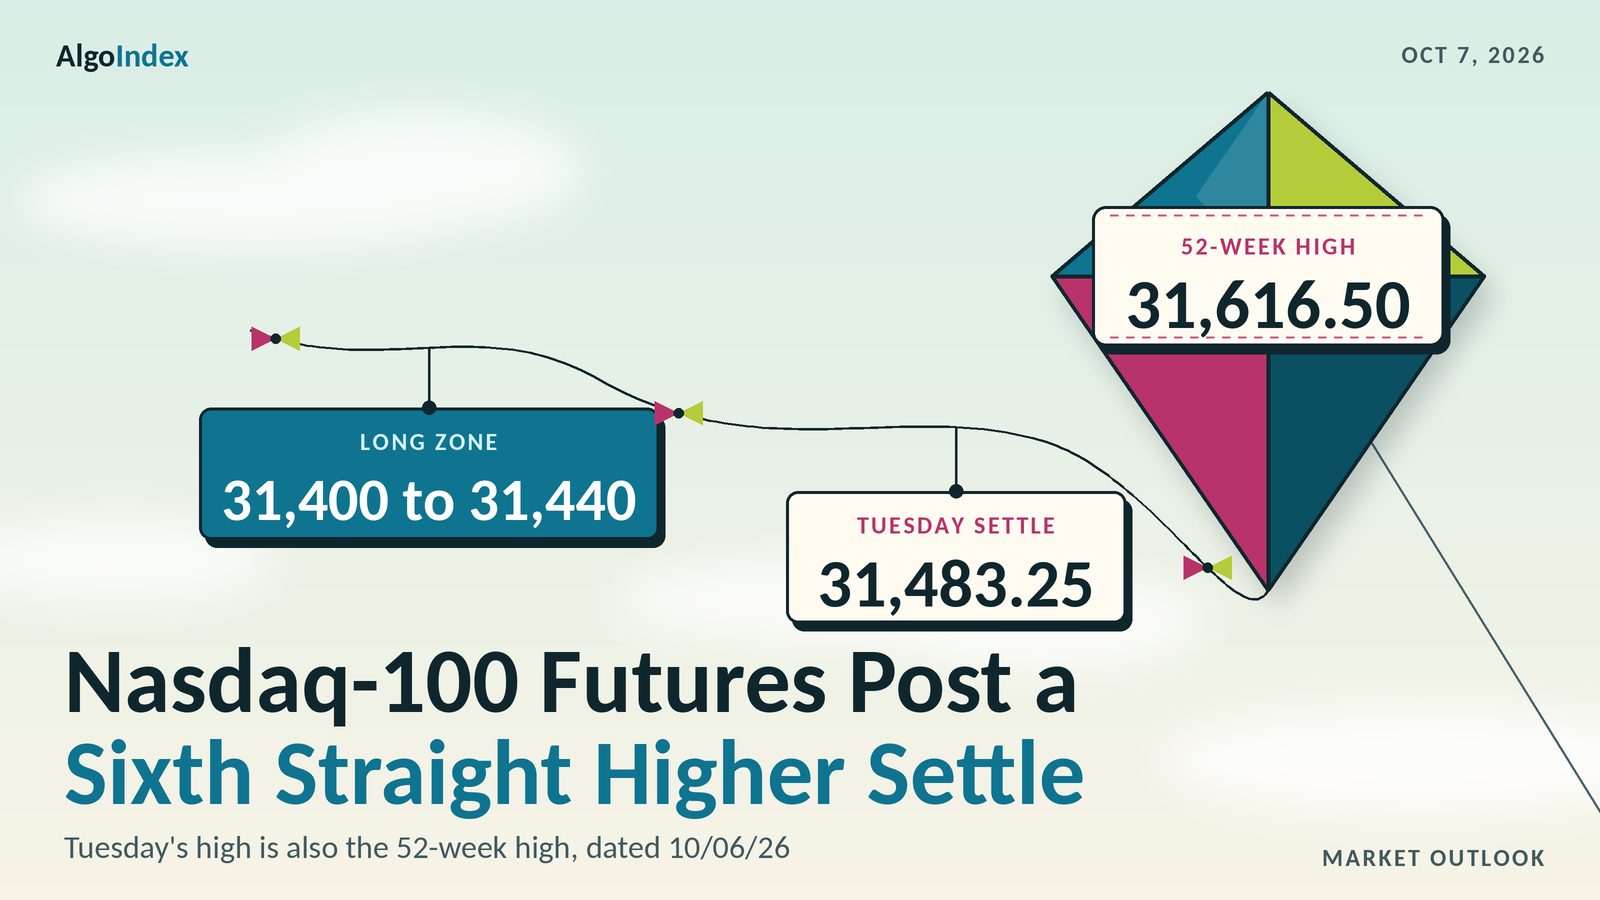
On Tuesday the December Nasdaq-100 contract reached 31,616.50, the provider's 52-week high, dated 10/06/26. That cleared Monday's 31,371.00 high by 245.50 points. The low held at 31,309.25, 351.75 points above Monday's low. Both ends stepped up. Provider commentary said the Nasdaq-100 cash index closed at a record, crediting lower Treasury yields, strength in most of the largest technology names, a rally in cybersecurity shares and earnings optimism ahead of next week's bank reports.
Settlement came at 31,483.25, up 165.50 points or 0.53 percent from Monday's 31,317.75. It was a sixth consecutive higher settle and the highest settle in the provider's daily record for the contract, which begins on 09/26/25. The range was narrow. At 307.25 points it ran 0.65 times the published 14-day average daily range of 475.11, the narrowest session since the 287.75 point range of 09/15, and the settle finished at 56.6 percent of it. Yields eased. The ten-year yield index closed five basis points lower at 5.26 percent. Globex reopened at 6:00 PM ET Tuesday, and the calendar lists the minutes of the September policy meeting at 2:00 PM ET Wednesday.
December Nasdaq-100 futures settled at 31,483.25, up 165.50 points, at 56.6 percent of a 307.25 point range and 13.58 points above the Pivot Point at 31,469.67. The 31,616.50 high is the provider's 52-week high, dated 10/06/26. Tuesday's row on the provider's daily record shows volume of 470,004 contracts and open interest of 281,627; Monday's row now reads 468,008 and 286,884. The composite multi-indicator read holds at 88 percent buy, direction strongest. Every settlement average sits beneath the settle. Overhead: the 31,548.09 relative-strength price, the 31,616.50 high, Pivot R1 at 31,630.08, the 31,701.89 target price and the 31,737.82 stall price. Beneath: the Pivot Point, the 31,358.78 conversion, the 31,322.83 to 31,309.25 band of Pivot S1, Monday's settle and Tuesday's low, and the 31,258.78 conversion. The primary setup is a long from 31,400 to 31,440, stop 31,280, targets 31,560, 31,700 and 31,840. The first-order event is the 2:00 PM ET release of the policy meeting minutes, which the calendar lists.
Tuesday settled 263.25 points above the untouched 31,180 to 31,220 band
Our Tuesday outlook set a long from 31,180 to 31,220 with a stop at 31,040 and targets at 31,360, 31,520 and 31,680. Tuesday's completed bar, on the provider's daily record, opened at 31,346.75 at the Monday 6:00 PM ET reopen, marked a high of 31,616.50 and a low of 31,309.25, and settled at 31,483.25. Tonight's review states the same open, high, low and settle. Price never reached the band. The low stopped 89.25 points above its upper edge, and the 31,040 stop sat 269.25 points beneath that low. Above, the high ran 256.50 points through the 31,360 first target level and 96.50 through the 31,520 second. The 31,680 extension stayed 63.50 points out of reach.
No intraday series was preserved for Tuesday. The daily bar shows where the contract traded, not in what order. For this card the order changes nothing. The session opened 126.75 points above the band's upper edge, and no print traded lower than 31,309.25. With the zone untouched, no fill and no result is asserted. Settlement landed at 31,483.25, 263.25 points above the band.
Session bands are harder to score. Our Globex, European, morning and afternoon bands topped at 31,480, 31,450, 31,500 and 31,550, and the 31,616.50 high cleared all four tops. The daily bar cannot show which window printed that high, or whether any window stayed inside its own band. The bottoms are simpler. The four bands bottomed at 31,150, 31,100, 31,150 and 31,200, and the 31,309.25 low held above every one of them, 109.25 points over the highest. Across the full session the high cleared the 31,480 top of the low-range case by 136.50 points and the 31,610 top of the mid-range case by 6.50. The settle landed inside the mid-range case, 126.75 points beneath its top. The high-range case of 30,850 to 31,790 held the whole session, with 173.50 points to spare at the top.
The weighted path held where the bar can judge it. We had the contract holding above the 31,215.42 Pivot Point after a test of the 31,371.00 high, with a move to Pivot R1 at 31,473.33 weighted above a return to Pivot S1 at 31,059.83. The whole session held above that Pivot Point, with the low 93.83 points over it. The high ran 245.50 points through 31,371.00 and 143.17 through Pivot R1. The low stayed 249.42 points above Pivot S1. Whether the test of 31,371.00 came before anything else is a question the daily bar cannot answer.
Neither invalidation test triggered. The settle finished 423.42 points above the 31,059.83 Pivot S1 threshold. No print traded beneath 31,100, the low holding 209.25 points above it, so no pair of 30-minute closes could fall beneath it. The macro override named three risks. They were a yield spike after the 1:00 PM ET auction, a reversal in the large technology names on the after-hours reports, or a Gulf escalation. The three-year note auction stopped at a high yield of 4.932 percent with a bid-to-cover of 2.620, per the news-feed calendar and unconfirmed. Yields fell. The ten-year yield index closed five basis points lower, at 5.26 percent, and provider commentary said most of the largest technology names closed higher. Provider commentary on crude cited reports of increased Iranian attacks on tankers in the Strait of Hormuz, and November crude settled up one cent. We grade the card as written.
A 31,616.50 high, a 31,309.25 low and a sixth higher settle
Tuesday opened at 31,346.75 at the Monday 6:00 PM ET reopen, 29.00 points above Monday's settle. Its low, 31,309.25, sat 8.50 points beneath that settle. Its high of 31,616.50 is the provider's 52-week high, and the 13-week and one-month highs read the same figure, dated 10/06/26. Settlement came at 31,483.25, 133.25 points beneath the high and 174.00 above the low.
The order inside the session is not known. No intraday series was preserved for the contract, so this outlook makes no claim about which extreme printed first or about the path between them. Late bars are the exception. The chart's 30-minute bars from the 3:00 PM ET bar through the 4:30 PM ET bar traded between 31,467.75 and 31,537.50, inside the daily range, and the 4:30 PM ET bar closed at 31,501.00. Those quotes are not used as the settlement.
Wednesday's session is already open. Globex reopened at 6:00 PM ET Tuesday. The provider's day open, high and low of 31,510.00, 31,520.50 and 31,496.00, shown at the time of writing, belong to that new session and not to Tuesday. None of them is used as a Tuesday figure.
Those extremes also come from the ladder. Tuesday's high and low are the completed-session inputs behind the published pivot ladder, back-solved from the outer pivot pairs and verified against every rung. The third resistance point at 31,937.33 minus the third support point at 31,015.58, divided by three, returns 307.25. The second pair, 31,776.92 and 31,162.42, divided by two, returns the same 307.25. Three times the 31,469.67 Pivot Point less the settle gives 62,925.76, one hundredth from the 62,925.75 sum of the solved pair because the published pivot is rounded. The provider's settlement row and the chart's completed Tuesday daily bar carry the same high and low.
Against Monday the bar stepped up at both ends. The high sits 245.50 points above Monday's 31,371.00, and the low 351.75 above Monday's 30,957.50. Activity held steady. Tuesday's row on the provider's daily record shows volume of 470,004 contracts against 468,008 on Monday's row. Open interest reads 281,627 on Tuesday's row and 286,884 on Monday's, the figure the provider's overview showed at capture. Monday's row has been revised since our Tuesday outlook, which carried volume of 459,389 and open interest of 281,627 for it.
The prior week is now beneath the whole bar. That week, September 28 through October 2, spanned 30,356.75 to 31,282.50, and Tuesday's 31,309.25 low sat 26.75 points over its top. The one-month low of 29,053.00 from 09/16 sits 2,430.25 points beneath the settle. No prior-quarter high or low was captured, so the 13-week extremes serve as the available quarterly reference: 31,616.50 above and 27,482.00, dated 07/29/26, beneath.
Six higher settles in a row. Settlements over the last six sessions ran 30,613.25, 30,698.75, 30,760.50, 31,061.75, 31,317.75 and 31,483.25, and the advance from the 30,566.25 settle of 09/28 totals 917.00 points. Session highs over the same six sessions read 30,725.50, 30,906.00, 31,151.50, 31,282.50, 31,371.00 and 31,616.50, and session lows 30,372.00, 30,512.25, 30,529.25, 30,760.25, 30,957.50 and 31,309.25. Both sequences have risen for five consecutive sessions. Ranges have shrunk. Daily ranges for the last seven sessions ran 564.00, 353.50, 393.75, 622.25, 522.25, 413.50 and 307.25, so each of the last three narrowed against the one before.
The retracement grid published for Wednesday places the 38.2 percent retracement from the four-week high at 30,637.24, the 50 percent retracement of the four-week range at 30,334.75 and the 38.2 percent retracement from the four-week low at 30,032.26. No four-hour series was captured. Swing structure here rests on daily bars only.
Every average sits beneath the settle. Computed from the provider's daily settlement series for the December contract, 259 completed sessions through Tuesday, the 5-day stands at 31,064.40, the 9-day at 30,906.39, the 20-day at 30,360.03, the 50-day at 29,926.24, the 100-day at 30,001.44 and the 200-day at 28,130.52. The settle sits 418.85 points above the 5-day, 576.86 above the 9-day, 1,123.22 above the 20-day and 1,557.01 above the 50-day. It is 1,481.81 above the 100-day and 3,352.73 above the 200-day.
Window arithmetic explains the moves. The 5-day rose 174.00 points from Monday's 30,890.40, because the 09/29 settle of 30,613.25 left the window and was replaced by 31,483.25. The 100-day sits 75.21 points above the 50-day. Its older 50 settles averaged 30,076.65, higher than the latest 50's 29,926.24, and that keeps the 100-day above the 50-day. The projection grid gives the prices at which each average would be crossed on Wednesday: 30,923.84 for the 9-day, 30,491.10 for the 18-day and 30,106.26 for the 40-day.
Momentum is stretched. The oscillator figures are as published on the provider's technical page dated for the Wednesday session, read after the 6:00 PM ET reopen, so the page may carry the live Globex price in place of the settle. Relative strength reads 75.84 on the 9-day, 69.30 on the 14-day and 64.41 on the 20-day. The stochastics sit near the top of their ranges. The 9-day raw stochastic reads 89.42 percent and the 14-day 94.37 percent, with the 14-day %K at 94.06 percent above %D at 89.27 percent. The published grid places the 14-day relative-strength 70 percent price at 31,548.09.
Direction favours the upside. On the 9-day the directional index reads 29.72, with positive direction at 31.75 and negative at 10.94; on the 14-day it reads 19.45, with positive direction at 29.05 against negative at 13.85. Historic volatility reads 8.46 percent on the 9-day and 14.34 percent on the 14-day. The composite multi-indicator read published for the Wednesday session is 88 percent buy, unchanged from the prior session's snapshot, with signal strength described as good and direction as strongest. A week ago it also read 88 percent buy. A month ago, 80 percent buy. The short-horizon and medium-horizon groups both average 100 percent buy, the long-horizon group 33 percent buy, and the composite trend indicator reads buy.
Volatility frames Wednesday. The published 14-day average true range stands at 455.18 points, 1.45 percent of the settle, and the 14-day average daily range at 475.11; the 9-day figures are 448.22 and 439.39, and the 20-day figures 468.99 and 458.15. One 14-day average true range either side of the settle spans 31,028.07 to 31,938.43. The published standard-deviation bands are narrower, built from five settlements. One deviation spans 31,142.04 to 31,824.46, two span 31,000.71 to 31,965.79 and three span 30,892.27 to 32,074.23. Those bands describe settlement dispersion only, not intraday reach.
A 5.26 percent ten-year, a 0.34 percent chip gain and a 105.6 billion trade deficit
Start with yields. The ten-year yield index closed at 5.26 percent, down five basis points from Monday's close, and the thirty-year index at 5.64 percent, down two, per the provider's quotes. The dollar index fell 0.33 percent to 101.83. The trade deficit, released at 8:30 AM ET as the calendar lists it, widened to 105.6 billion dollars against a 102.05 billion forecast, per the news-feed calendar.
Rates news kept coming. A three-year note auction, on the news-feed calendar and unconfirmed, stopped at a high yield of 4.932 percent with a bid-to-cover of 2.620. At 2:00 PM ET the news feed carried remarks from the San Francisco Federal Reserve president that more increases may be needed if shocks persist. Provider commentary said markets price a 19 percent chance of a quarter-point increase at the October 27-28 meeting. No inflation-indexed yield was captured, so no real-yield figure is asserted.
Most of the largest technology names rose, per provider commentary. The largest online retailer gained more than 1 percent, the largest software maker 0.85 percent, the largest electric-vehicle maker 0.47 percent, the search-engine parent 0.34 percent, the largest consumer-electronics maker 0.22 percent and the largest AI chip designer 0.15 percent. The largest social-media company fell 0.34 percent. The same commentary said third-quarter S&P 500 profits are expected to rise 25 percent from a year earlier according to a data compiler, up from a 22 percent estimate in July, and that earnings season begins next week with the large banks.
Chips split. The semiconductor index closed at 13,217.82, up 0.34 percent, in a 13,196.50 to 13,349.96 range per the provider's quote; that session high sat 1.35 percent above Monday's close. Provider commentary said chipmakers and AI-linked shares limited the broader gain. A data-storage maker fell more than 9 percent to lead decliners in both the S&P 500 and the Nasdaq-100, a second storage maker more than 6 percent, a chip-equipment maker more than 4 percent, and another equipment maker and a large chipmaker more than 3 percent. The desk note instead highlighted gains of about 4 percent, 3 percent and 6 percent in three AI-related chip designers.
Company news ran through the day. At 9:00 AM ET the news feed carried a pact between a chip-equipment maker and a large chipmaker to co-develop AI chip technology, and at 9:26 AM ET a chip designer's chief executive put its addressable market at about 400 billion dollars by 2030 at its investor day. A new model release from the search-engine parent followed at 12:05 PM ET. At 12:48 PM ET a press report said a cloud computing firm backed by the largest AI chip designer is raising up to 4 billion dollars, and at 2:20 PM ET the feed carried an agent protocol developed with the largest social-media company and several retailers. Cybersecurity shares rallied. One security software maker rose more than 5 percent and two others more than 3 percent, per provider commentary. With no intraday series, no price move here is tied to any headline.
Geopolitics arrived after the close. Between 4:04 PM ET and 4:24 PM ET the news feed carried presidential remarks that the United States still has to finish its campaign against Iran, and at 4:20 PM ET a remark that the Russia and Ukraine war is getting closer to ending. At 4:42 PM ET it carried a statement by the Treasury Secretary that Iran has not loaded a single barrel of crude onto a vessel since August 25. November crude settled up one cent at 89.44. These are statements carried by the news feed and provider commentary and were not confirmed.
The broad market did slightly better. The S&P 500 cash index closed at 7,818.93, up 0.58 percent, a record close per the news feed at 4:02 PM ET. The Nasdaq-100 cash index closed at 31,224.47, up 0.48 percent, 0.10 percentage points behind. The volatility index closed at 15.01, down 0.51, and the Nasdaq-100 volatility gauge, VXN, at 21.15, down 0.55. The QQQ fund closed at 759.66, up 0.46 percent, and December gold settled at 4,187.1, up 0.73 percent.
Positioning reports lag. The latest positioning report on the provider's overview is still the one as of September 29, 2026: asset managers long 108,558 contracts against short 38,814, leveraged funds long 48,150 against short 72,873, and dealers long 49,079 against short 107,321. No change in positioning is asserted for Tuesday.
The desk note comes next. The edition used is the 5:31 PM ET note for Tuesday, read at 6:18 PM ET, and its reference prices are the prior session's closes. The NDX reference of 31,076 equals Monday's 31,076.44 cash close, and the QQQ reference of 756 equals Monday's 756.20. Every level is therefore read against Tuesday's closes: 31,224.47 for the cash index and 759.66 for the fund.
The fund proxy reads long gamma. Its primary call-side ceiling sits at 760, the modeled volatility threshold at 753, the modeled gamma-flip level at 749, the primary put-side support base at 749 and the largest gamma concentration at 740. The fund closed at 759.66. That is 0.34 beneath the 760 ceiling and above the threshold, the flip and the largest concentration. Gamma tilt reads 1.098 and the gamma notional plus 282.156 million dollars, so the proxy's dealers carry a net long gamma position. The 25-delta risk reversal reads 0.00. Put volume of 1.814 million contracts exceeded call volume of 891,714. The note lists 740, 760, 750 and 749 as key strikes. The fund console, marked as updated 2026-10-06, shows call gamma of minus 716 million and put gamma of minus 1.9 billion and attributes 14.01 percent of the fund's gamma and 1.63 percent of its delta to the nearest expiration. Its high and low volatility point fields are excluded as low-confidence.
Now the cash index. Its call-side ceiling sits at 31,100 and its largest gamma concentration at 31,000, and the 31,224.47 close exceeds both. The modeled volatility threshold sits at 30,790 and the modeled gamma-flip level at 30,305, with the primary put-side support base at 28,000. The key strikes are 31,000, 31,100, 31,500 and 30,000, and the combination levels 31,232, 30,797, 31,108 and 31,325. Gamma tilt on the index reads 1.946, with a gamma notional of 17.676 million dollars.
Conversions carry four cash levels into futures. At the measured closing basis of 258.78 points, Tuesday's 31,483.25 settlement less the 31,224.47 cash close, cash 31,100 corresponds to 31,358.78 on the December contract, 31,000 to 31,258.78, 31,500 to 31,758.78 and the modeled volatility threshold at 30,790 to 31,048.78. These are conversions made by this review. The source publishes no Nasdaq futures pair, and the modeled threshold is not a listed strike. The fund serves as the positioning proxy for the dataset available. It stays secondary to technical structure and to the large-cap and semiconductor drivers. In this review's interpretation the cash index holding above its 31,100 ceiling while the fund sits just beneath its 760 ceiling, with net long dealer gamma on both, favours slower, mean-reverting trade on Wednesday, with the 31,100 area acting as support on a pullback.
The trade map for Wednesday
The primary setup is a long from 31,400 to 31,440, a pullback zone between Pivot S1 at 31,322.83 and the Pivot Point at 31,469.67. The case rests on the run. Tuesday produced a sixth consecutive higher settle above every average from the 5-day to the 200-day, with the composite read at 88 percent buy, direction strongest, and net long dealer gamma on the index and the fund. The stop at 31,280 sits beneath Tuesday's 31,309.25 low and Pivot S1. Two readings cut the other way. The 14-day %K reads 94.06 percent, and the range narrowed for a third session. So the setup is an analyst judgment that the trend holds through the minutes. It is not a measured edge. The 14-day average true range of 455.18 points compares with a 140 point stop distance from the 31,420 midpoint. The settle sits 43.25 points above the top of the zone.
Overhead the references start 64.84 points above the settle, at the 14-day relative-strength 70 percent price of 31,548.09. Tuesday's 31,616.50 high, the 52-week high, comes next, with Pivot R1 13.58 points above it at 31,630.08. The 31,701.89 target price and the 31,737.82 stall price of the 3-10 day average crossover follow. The 31,758.78 conversion of the cash 31,500 key strike, Pivot R2 at 31,776.92 and one standard deviation resistance at 31,824.46 sit above them. Pivot R3 at 31,937.33, two standard deviations resistance at 31,965.79 and three at 32,074.23 are the extended references. Closer in, the late 30-minute bars topped at 31,537.50, and the new Wednesday session had printed 31,520.50 by the time of writing.
Support starts 13.58 points beneath the settle, at the 31,469.67 Pivot Point, with the 31,467.75 low of the late 30-minute bars 1.92 points under it. Beneath the zone, Monday's 31,371.00 high and the 31,358.78 conversion of the cash 31,100 ceiling come first. Pivot S1 at 31,322.83, Monday's 31,317.75 settle and Tuesday's 31,309.25 low sit within 13.58 points of each other, all above the 31,280 stop. The 31,258.78 conversion of the cash 31,000 concentration sits beneath it. Pivot S2 at 31,162.42, the 14-3 day raw stochastic 80 percent threshold at 31,142.75 and one standard deviation support at 31,142.04 form the next band. The 5-day average at 31,064.40, the 31,048.78 threshold conversion, Pivot S3 at 31,015.58 and two standard deviations support at 31,000.71 lie deeper. The 9-day crossing at 30,923.84, the 9-day average at 30,906.39 and three standard deviations support at 30,892.27 come last.
The night comes first. Globex reopened at 6:00 PM ET Tuesday and had traded between 31,496.00 and 31,520.50 by the time of writing. A regional Federal Reserve president is listed at 7:00 PM ET Tuesday and German industrial production at 2:00 AM ET Wednesday, both on the news-feed calendar and unconfirmed. Bias reads constructive above the 31,469.67 Pivot Point, with an expected Globex band of roughly 31,380 to 31,600.
Europe follows. The managing director of the International Monetary Fund is listed at 2:00 AM ET, on the news-feed calendar and unconfirmed, just before the window, and mainland Chinese markets remain closed for the holiday, per provider commentary. Bias reads constructive, with an expected band of roughly 31,350 to 31,620 and Tuesday's 31,616.50 high the first test.
Then the cash open. At 9:30 AM ET it is the first directional test of the session. The calendar lists the weekly petroleum status report at 10:30 AM ET, which reaches the index through yields. A regional inflation-expectations survey and a European Central Bank speaker are listed at 11:00 AM ET, both on the news-feed calendar and unconfirmed. The morning band runs roughly 31,300 to 31,700.
The afternoon carries the minutes. A ten-year note auction is listed at 1:00 PM ET, on the news-feed calendar and unconfirmed. The calendar lists the minutes of the September policy meeting at 2:00 PM ET and consumer credit at 3:00 PM ET. The afternoon band runs roughly 31,250 to 31,780 into the 4:00 PM ET settlement, and the minutes can extend either side. The captured calendars carry no mega-capitalisation earnings entry for Wednesday. In this review's judgment the single first-order event for the Nasdaq-100 on Wednesday is the 2:00 PM ET release of the minutes. Further out, the calendar lists a Federal Reserve governor on the economic outlook at 4:30 AM ET on Thursday, October 8, the large banks from 7:00 AM ET on Tuesday, October 13, and the consumer price index at 8:30 AM ET on Wednesday, October 14.
Three scenarios frame the day. Across the full session the low-range case runs 31,380 to 31,620, the mid-range and most likely case 31,280 to 31,720 and the high-range case 31,030 to 31,940. All three nest. In this review's analyst judgment the most probable path holds the contract above the 31,469.67 Pivot Point into the cash open and offers a retest of the 31,616.50 high to the 31,630.08 Pivot R1 area before the 2:00 PM ET minutes. In the same judgment a pullback toward Pivot S1 at 31,322.83 and the 31,358.78 conversion that holds is weighted above a break beneath Tuesday's 31,309.25 low. Four grounds carry that weight. Six consecutive higher settles. A settle above every settlement average. The 88 percent buy composite with direction strongest. And net long dealer gamma. A 14-day %K of 94.06 percent and a third consecutive narrower range argue for slower progress. A hawkish reading of the minutes that pushes the ten-year yield back above Monday's closing level and the contract beneath 31,309.25 would invalidate this reading.
Tuesday's 52-week high sits 133.25 points above the settle, and the minutes land at 2:00 PM ET.
The complete data picture
Every number behind Wednesday’s plan, charted first, then the full level map, then the complete numeric reference underneath.
Cash-index levels at the measured 258.78 point basis: the 31,100 call-side ceiling translates to 31,358.78 in futures, the 31,000 largest gamma concentration to 31,258.78, the 31,500 key strike to 31,758.78 and the 30,790 modeled volatility threshold to 31,048.78. No other cash level is translated.
Full numeric reference, every remaining figure from the session review
3.1 Resistance, level by level
The settle at 31,483.25 sits 13.58 points above the Pivot Point at 31,469.67. The 14-day relative-strength 70 percent price at 31,548.09 comes first, then Tuesday's 31,616.50 high, the 52-week high, and Pivot R1 at 31,630.08. The published target price of 31,701.89 and the 3-10 day average crossover stall price at 31,737.82 follow, with the NDX 31,500 key strike at 31,758.78 on this review's basis conversion, Pivot R2 at 31,776.92 and one standard deviation resistance at 31,824.46 above them. Pivot R3 at 31,937.33, two standard deviations resistance at 31,965.79 and three standard deviations resistance at 32,074.23 are the extended references.
3.2 Support, level by level
Beneath the settle, the Pivot Point at 31,469.67 comes first, followed by the NDX 31,100 call side ceiling at 31,358.78 on this review's basis conversion. Pivot S1 at 31,322.83, Monday's 31,317.75 settle and Tuesday's 31,309.25 low sit together, then the NDX 31,000 gamma concentration at 31,258.78 on the same conversion. Pivot S2 at 31,162.42, the 14-3 day raw stochastic 80 percent threshold at 31,142.75 and one standard deviation support at 31,142.04 form the next band, with the 5-day settlement average at 31,064.40, the NDX 30,790 modeled volatility threshold at 31,048.78 on the conversion, Pivot S3 at 31,015.58 and two standard deviations support at 31,000.71 beneath. The 9-day average crossing price at 30,923.84 and the 9-day settlement average at 30,906.39 are the deeper references.
1. Executive Summary
The December Nasdaq-100 contract settled at 31,483.25 on Tuesday, up 165.50 points or 0.53 percent from Monday's settle of 31,317.75, after trading between 31,616.50 and 31,309.25, a 307.25 point daily range. The settle finished at 56.6 percent of the range, and the range was 0.65 times the published 14-day average daily range of 475.11 points, the narrowest session since the 287.75 point range of 09/15. Tuesday was the sixth consecutive higher settle, and the settle is the highest in the provider's daily record for the contract, which begins on 09/26/25. The 31,616.50 high is the provider's 52-week high, dated 10/06/26, and Tuesday printed a higher high and a higher low against Monday.
The Nasdaq-100 cash index closed at 31,224.47, up 0.48 percent, a record close per provider commentary, which credited lower Treasury yields, strength in most of the largest technology names, a rally in cybersecurity shares and earnings optimism ahead of next week's bank reports. The same commentary said weakness in chipmakers and other AI-linked shares limited the gain, with data-storage and equipment names among the largest decliners, while the desk note highlighted gains in several AI-related semiconductor names. No intraday series was preserved for the contract, so no price move in this review is tied to any headline.
The ten-year yield index closed five basis points lower at 5.26 percent and the dollar index fell 0.33 percent to 101.83, after the trade deficit, released at 8:30 AM ET as the calendar lists it, widened to 105.6 billion dollars against a 102.05 billion forecast, per the news-feed calendar. The Nasdaq volatility gauge (VXN) fell 0.55 to 21.15, and the semiconductor index rose 0.34 percent with a session high of 13,349.96, 1.35 percent above Monday's close.
The composite multi-indicator read is 88 percent buy with strength good and direction strongest. The Primary Setup below is a long from the 31,400 to 31,440 zone between Pivot S1 at 31,322.83 and the Pivot Point at 31,469.67, stopped at 31,280 beneath Tuesday's low, with objectives at 31,560, 31,700 and an extended 31,840.
2.1 Intraday and Session Review
The Tuesday session opened at 31,346.75 at the Monday 6:00 PM ET reopen, 29.00 points above Monday's settle, marked a daily high of 31,616.50 and a daily low of 31,309.25, and settled at 31,483.25. The low sat 8.50 points beneath Monday's settle. No intraday series was preserved for the contract, so this review makes no claim about the order in which the extremes printed or about the path between them; only the daily bar, the settlement and the chart's late-session 30-minute bars are used.
The chart's 30-minute bars read after the close show trade between 31,467.75 and 31,537.50 from the 3:00 PM ET bar through the 4:30 PM ET bar, inside the daily range, with the 4:30 PM ET bar closing at 31,501.00. These quotes are not used as the settlement anywhere in this review. The Wednesday session reopened at 6:00 PM ET Tuesday; the provider's day open, high and low of 31,510.00, 31,520.50 and 31,496.00 shown at the time of writing belong to that new session, not to Tuesday.
The session extremes used here are the completed-session inputs behind the published pivot ladder and were not read independently from a bar, back-solved from the outer pivot pairs and verified against every rung. The third resistance point at 31,937.33 minus the third support point at 31,015.58, divided by three, returns 307.25, and the second resistance point at 31,776.92 minus the second support point at 31,162.42, divided by two, returns the same 307.25. Three times the Pivot Point of 31,469.67 less the 31,483.25 settle gives a high plus low sum of 62,925.76, 0.01 from the 62,925.75 of the solved pair because the published pivot is rounded, and the pair of 31,616.50 and 31,309.25 reproduces all seven published rungs. Independent corroboration: the provider's settlement row and the chart's completed Tuesday daily bar carry the same 31,616.50 high and 31,309.25 low, and the provider's 52-week, 13-week and one-month high all read 31,616.50 dated 10/06/26.
2.2 Daily Structure
Tuesday printed a higher high and a higher low against Monday: the 31,616.50 high sits 245.50 points above Monday's 31,371.00, and the 31,309.25 low sits 351.75 points above Monday's 30,957.50. The sequence of session highs over the last six sessions reads 30,725.50, 30,906.00, 31,151.50, 31,282.50, 31,371.00 and 31,616.50, and the sequence of session lows reads 30,372.00, 30,512.25, 30,529.25, 30,760.25, 30,957.50 and 31,309.25, so both sequences have risen for five consecutive sessions.
The prior week, September 28 through October 2, spanned 30,356.75 to 31,282.50, and Tuesday traded entirely above that week's 31,282.50 high, with its 31,309.25 low 26.75 points over it. The one-month low of 29,053.00, dated 09/16/26, sits 2,430.25 points beneath the settle. Settlements over the last six sessions ran 30,613.25, 30,698.75, 30,760.50, 31,061.75, 31,317.75 and 31,483.25.
No prior-quarter high or low was captured, so the 13-week extremes serve as the available quarterly reference: 31,616.50 above and 27,482.00, dated 07/29/26, beneath.
2.3 4-Hour and Swing Structure
The six-session advance from the 30,566.25 settle of 09/28 to Tuesday's 31,483.25 totals 917.00 points. Daily ranges for the last seven sessions ran 564.00, 353.50, 393.75, 622.25, 522.25, 413.50 and 307.25, so the last three sessions each narrowed against the one before.
The retracement grid published for Wednesday places the 38.2 percent retracement from the four-week high at 30,637.24, the 50 percent retracement of the four-week range at 30,334.75 and the 38.2 percent retracement from the four-week low at 30,032.26. No four-hour series was captured, and no intraday series was preserved, so swing structure here rests on daily bars only.
2.4 Moving Averages
The averages cited in this subsection were computed from the provider's daily settlement series for the December contract, which holds 259 completed sessions through Tuesday. The 5-day average stands at 31,064.40, the 9-day at 30,906.39, the 20-day at 30,360.03, the 50-day at 29,926.24, the 100-day at 30,001.44 and the 200-day at 28,130.52.
The 31,483.25 settle sits 418.85 points above the 5-day average, 576.86 points above the 9-day and 3,352.73 points above the 200-day, and above every average from the 5-day to the 200-day. The 5-day average rose 174.00 points from Monday's 30,890.40 as the 09/29 settle of 30,613.25 left the window and was replaced by 31,483.25.
The 100-day average sits 75.21 points above the 50-day. That ordering follows from the arithmetic of the two windows: the 100-day is the mean of the latest 50 settlements and the 50 before them, so the older 50 settlements averaged 30,076.65, higher than the latest 50's 29,926.24, which holds the 100-day above the 50-day.
The projection grid gives the prices at which each average would be crossed on Wednesday: 30,923.84 for the 9-day, 30,491.10 for the 18-day and 30,106.26 for the 40-day.
2.5 Oscillator and Trend Readings
The oscillator figures below are as published on the provider's technical page dated for the Wednesday session, read after the 6:00 PM ET reopen; the page may carry the live Globex price in place of the settle, so they are quoted as published. The 9-day relative strength reads 75.84, the 14-day relative strength 69.30 and the 20-day relative strength 64.41.
The stochastics sit near the top of their ranges. The 9-day raw stochastic reads 89.42 percent and the 14-day raw stochastic 94.37 percent, while the 14-day stochastic %K reads 94.06 percent and the 14-day stochastic %D 89.27 percent. The published grid places the 14-day relative-strength 70 percent price at 31,548.09.
The directional system favours the upside. The 9-day directional index ADX reads 29.72 with the 9-day +DI at 31.75 and the 9-day -DI at 10.94; the 14-day directional index ADX reads 19.45 with the 14-day +DI at 29.05 and the 14-day -DI at 13.85. The 9-day historic volatility reads 8.46 percent and the 14-day historic volatility 14.34 percent.
The composite multi-indicator read published for the Wednesday session is 88 percent buy, unchanged from the prior session's snapshot, with signal strength described as good and direction as strongest. The snapshot history reads 88 percent buy a week ago and 80 percent buy a month ago. The short-horizon group averages 100 percent buy, the medium-horizon group 100 percent buy and the long-horizon group 33 percent buy, and the composite trend indicator reads buy.
2.6 Volatility and Expected Range
The published 14-day average true range stands at 455.18 points and the 14-day average daily range at 475.11 points; the 9-day average true range is 448.22 with a 9-day average daily range of 439.39, and the 20-day average true range is 468.99 with a 20-day average daily range of 458.15. Tuesday's 307.25 point range was 0.65 times the 14-day average daily range.
The 14-day average true range of 455.18 points, added to and subtracted from the 31,483.25 settle, frames Wednesday between 31,028.07 and 31,938.43. The published standard-deviation bands are narrower because they are built from five settlements: one deviation spans 31,142.04 to 31,824.46, two spans 31,000.71 to 31,965.79 and three spans 30,892.27 to 32,074.23. These bands describe settlement dispersion, not intraday reach.
4.1 Mag7 Earnings and AI Capex Cycle
Provider commentary said most of the largest technology names closed higher, with the largest online retailer up more than 1 percent, the largest software maker up 0.85 percent, the largest electric-vehicle maker up 0.47 percent, the search-engine parent up 0.34 percent, the largest consumer-electronics maker up 0.22 percent and the largest AI chip designer up 0.15 percent, while the largest social-media company fell 0.34 percent. The news feed carried an announcement at 2:20 PM ET of an agent protocol developed with the largest social-media company and several retailers, a press report at 12:48 PM ET that a cloud computing firm backed by the largest AI chip designer is raising up to 4 billion dollars, and a new model release from the search-engine parent at 12:05 PM ET. Provider commentary added that third-quarter S&P 500 profits are expected to rise 25 percent from a year earlier according to a data compiler, up from a 22 percent estimate in July, and that earnings season begins next week with the large banks.
4.2 Semiconductor Cycle and Tech Sector Rotation
The semiconductor index closed at 13,217.82, up 0.34 percent, after trading between 13,196.50 and 13,349.96, per the provider's quote. Provider commentary said chipmakers and AI-linked shares limited the broader gain, with a data-storage maker down more than 9 percent to lead decliners in both the S&P 500 and the Nasdaq-100, a second storage maker down more than 6 percent, a chip-equipment maker down more than 4 percent and another equipment maker and a large chipmaker down more than 3 percent. The desk note instead highlighted gains of about 4 percent, 3 percent and 6 percent in three AI-related chip designers. At 9:00 AM ET the news feed carried a pact between a chip-equipment maker and a large chipmaker to co-develop AI chip technology, and at 9:26 AM ET a chip designer's chief executive put the company's addressable market at about 400 billion dollars by 2030 at its investor day. Cybersecurity shares rallied, with one security software maker up more than 5 percent and two others up more than 3 percent, per provider commentary.
4.3 Fed Policy and Real Yields (Duration Sensitivity)
The ten-year yield index closed at 5.26 percent, down five basis points from Monday's close, and the thirty-year index at 5.64 percent, down two, per the provider's quotes. A three-year note auction, per the news-feed calendar and unconfirmed, stopped at a high yield of 4.932 percent with a bid-to-cover of 2.620. The news feed carried remarks from the San Francisco Federal Reserve president at 2:00 PM ET that more increases may be needed if shocks persist, and provider commentary said markets price a 19 percent chance of a quarter-point increase at the October 27-28 meeting. The minutes of the September policy meeting are scheduled for 2:00 PM ET on Wednesday, October 7, 2026, as the calendar lists it. No inflation-indexed yield was captured, so no real-yield figure is asserted.
4.4 Geopolitical Backdrop
After the cash close, the news feed carried presidential remarks between 4:04 PM ET and 4:24 PM ET that the United States still has to finish its campaign against Iran, a remark at 4:20 PM ET that the Russia and Ukraine war is getting closer to ending, and a statement by the Treasury Secretary at 4:42 PM ET that Iran has not loaded a single barrel of crude onto a vessel since August 25. Provider commentary on crude cited reports of increased Iranian attacks on tankers in the Strait of Hormuz. November crude settled up one cent at 89.44. These are statements carried by the news feed and provider commentary and were not confirmed.
4.5 Cross-Asset and Volatility
The S&P 500 cash index closed at 7,818.93, up 0.58 percent, a record close per the news feed at 4:02 PM ET. The volatility index closed at 15.01, down 0.51, per the provider's quote. The Nasdaq gauge, VXN, closed at 21.15, down 0.55. The dollar index fell 0.33 percent to 101.83. The QQQ fund closed at 759.66, up 0.46 percent. December gold settled at 4,187.1, up 0.73 percent.
4.6 Institutional Positioning
The latest positioning report on the provider's overview is still the one as of September 29, 2026: asset managers long 108,558 contracts against short 38,814, and leveraged funds long 48,150 against short 72,873, with dealers long 49,079 against short 107,321. The provider overview read shows that September 29 report as its latest, so no change in positioning is asserted for Tuesday.
Open interest on the December contract is shown at 286,884 on the provider's overview, the figure on Monday's 2026-10-05 row of the provider's daily record; Tuesday's 2026-10-06 row reads 281,627, and no change in open interest is asserted for Tuesday. Tuesday's volume was 470,004 contracts against Monday's 468,008.
5. QQQ Options Flow Context (Proxy)
The desk note read for this section is the 5:31 PM ET edition for Tuesday, read at 6:18 PM ET. Its reference prices are the prior session's closes, not Tuesday's: NDX 31,076 equals Monday's 31,076.44 cash close and QQQ 756 equals Monday's 756.20, so every level below is read against Tuesday's 31,224.47 cash close and 759.66 fund close and not against the reference column.
On the QQQ proxy the primary call side ceiling sits at 760, the modeled volatility threshold at 753, the modeled gamma-flip level at 749, the primary put side support base at 749 and the largest gamma concentration at 740. The fund closed at 759.66, 0.34 beneath the 760 ceiling and above the threshold, the flip and the largest concentration. Gamma tilt reads 1.098 and the gamma notional plus 282.156 million dollars, so the proxy's dealers carry a net long gamma position, and the 25-delta risk reversal reads 0.00. Put volume of 1.814 million contracts exceeded call volume of 891,714. The note lists 740, 760, 750 and 749 as key strikes. The QQQ console, marked as updated 2026-10-06, shows call gamma of minus 716 million and put gamma of minus 1.9 billion and attributes 14.01 percent of the fund's gamma and 1.63 percent of its delta to the nearest expiration; its high and low volatility point fields are excluded as low-confidence.
On the Nasdaq-100 index the primary call side ceiling sits at NDX 31,100 and the largest gamma concentration at NDX 31,000, both of which the 31,224.47 cash close exceeds, with the modeled volatility threshold at NDX 30,790 and the modeled gamma-flip level at NDX 30,305. The primary put side support base is NDX 28,000. The note lists NDX 31,000, 31,100, 31,500 and 30,000 as key strikes and NDX 31,232, 30,797, 31,108 and 31,325 as combination levels. Gamma tilt on the index reads 1.946 with a gamma notional of 17.676 million dollars.
At the measured closing basis of 258.78 points, the December settlement of 31,483.25 less the 31,224.47 cash close, NDX 31,100 corresponds to 31,358.78 on the December contract, NDX 31,000 to 31,258.78, NDX 31,500 to 31,758.78 and the modeled volatility threshold at NDX 30,790 to 31,048.78. These are conversions made by this review; the source publishes no Nasdaq futures pair, and the modeled threshold is not a listed strike. The review uses the QQQ fund as the positioning proxy for the Nasdaq-100 contract, a choice made for the dataset available, and it remains secondary to technical structure and to the large-cap and semiconductor drivers in section 4. In this review's interpretation the cash index holding above its NDX 31,100 ceiling while the fund sits just beneath its 760 ceiling, with net long dealer gamma on both, favours slower, mean-reverting trade on Wednesday, with the NDX 31,100 area acting as support on a pullback.
6.1 Night Session (6:00 PM ET Tuesday to 3:00 AM ET Wednesday, Globex and Asia)
The contract reopened at 6:00 PM ET Tuesday and traded between 31,496.00 and 31,520.50 at the time of writing. A regional Federal Reserve president is listed at 7:00 PM ET Tuesday and German industrial production at 2:00 AM ET Wednesday, both per the news-feed calendar and unconfirmed. Bias constructive above the 31,469.67 Pivot Point, expected Globex band roughly 31,380 to 31,600.
6.2 London Session (3:00 AM to 8:00 AM ET Wednesday)
The managing director of the International Monetary Fund is listed at 2:00 AM ET, per the news-feed calendar and unconfirmed, just before the window, and mainland Chinese markets remain closed for the holiday, per provider commentary. Bias constructive, expected band roughly 31,350 to 31,620, with Tuesday's 31,616.50 high the first test.
6.3 Morning Session (9:30 AM to 12:00 PM ET Wednesday, RTH Open)
The cash open at 9:30 AM ET is the first directional test of the session, and the 10:30 AM ET weekly petroleum report, as the calendar lists it, reaches the index through yields. A regional inflation-expectations survey is listed at 11:00 AM ET, per the news-feed calendar and unconfirmed. Expected band roughly 31,300 to 31,700.
6.4 Afternoon Session (12:00 PM to 4:00 PM ET Wednesday)
A ten-year note auction is listed at 1:00 PM ET, per the news-feed calendar and unconfirmed, and the minutes of the September policy meeting follow at 2:00 PM ET on Wednesday, October 7, 2026, as the calendar lists it, the first-order event for the rate-sensitive index. Expected band roughly 31,250 to 31,780, with the minutes able to extend either side.
6.5 Night Session Forward (6:00 PM ET Wednesday)
Consumer credit is scheduled for 3:00 PM ET on Wednesday, October 7, 2026, as the calendar lists it. A Federal Reserve governor speaks on the economic outlook at 4:30 AM ET on Thursday, October 8, 2026, as the calendar lists it, inside the following overnight window.
6.6 Expected Range (Wednesday Full Session)
Low-range scenario: 31,380 to 31,620; Mid-range scenario (most likely): 31,280 to 31,720; High-range scenario: 31,030 to 31,940.
6.7 Most Likely Path
In this review's analyst judgment the most probable path holds the contract above the 31,469.67 Pivot Point into the cash open and offers a retest of the 31,616.50 high to the 31,630.08 Pivot R1 area before the 2:00 PM ET minutes. A pullback toward the 31,322.83 Pivot S1 and the 31,358.78 conversion of the NDX 31,100 ceiling that holds is weighted above a break beneath Tuesday's 31,309.25 low, because the contract has six consecutive higher settles, sits above every settlement average, the composite read is 88 percent buy with direction strongest, and dealer gamma is net long. A 14-day stochastic %K of 94.06 percent and a third consecutive narrower range argue for slower progress, and the alternative that would invalidate this reading is a hawkish reading of the minutes that pushes the ten-year yield back above Monday's closing level and the contract beneath 31,309.25.
7. Wednesday Economic Calendar
The Wednesday session reopened at 6:00 PM ET Tuesday. A regional Federal Reserve president is listed at 7:00 PM ET Tuesday, and the managing director of the International Monetary Fund and German industrial production are listed at 2:00 AM ET Wednesday, all per the news-feed calendar and unconfirmed.
The cash open is at 9:30 AM ET. The weekly petroleum status report is scheduled for 10:30 AM ET on Wednesday, October 7, 2026, as the calendar lists it. A regional inflation-expectations survey and a European Central Bank speaker are listed at 11:00 AM ET, and a ten-year note auction at 1:00 PM ET, all per the news-feed calendar and unconfirmed. The minutes of the September policy meeting are scheduled for 2:00 PM ET on Wednesday, October 7, 2026, as the calendar lists it, and consumer credit follows at 3:00 PM ET on Wednesday, October 7, 2026, as the calendar lists it. The captured calendars carry no mega-capitalisation earnings entry for Wednesday.
In this review's judgment the single first-order event for the contract on Wednesday is the 2:00 PM ET release of the minutes, as the calendar lists it. The large banks report from 7:00 AM ET on Tuesday, October 13, 2026, as the calendar lists it, and the consumer price index follows at 8:30 AM ET on Wednesday, October 14, 2026, as the calendar lists it.
8. Primary Trade Setup
Direction: Long
Rationale: Six consecutive higher settles, a settle above every average from the 5-day to the 200-day, an 88 percent buy composite with direction strongest and net long dealer gamma on the index and the fund support buying a pullback into the 31,400 to 31,440 zone between Pivot S1 at 31,322.83 and the Pivot Point at 31,469.67. Stretched stochastics and a narrowing range mean the setup is an analyst judgment that the trend holds through the minutes, not a measured edge.
Entry Zone: 31,400 to 31,440
Stop Loss: 31,280 (beneath Tuesday's 31,309.25 low and Pivot S1 at 31,322.83)
Target 1 (T1): 31,560 (56.50 beneath the 31,616.50 Tuesday high)
Target 2 (T2): 31,700 (1.89 beneath the 31,701.89 published target price)
Target 3 (T3, extended): 31,840 (above Pivot R2 at 31,776.92 and one standard deviation resistance at 31,824.46)
Risk-to-Reward: Approximately 1:1 to T1, 1:2 to T2, 1:3 to T3
Invalidation: A settle beneath Pivot S1 at 31,322.83 negates the thesis. Short of that, the edge is removed by acceptance beneath 31,340 and not by a touch, defined as two consecutive 30-minute closes beneath 31,340.
Macro override: A hawkish reading of the minutes that lifts the ten-year yield back above Monday's closing level, a renewed slide in semiconductor shares, or a Gulf escalation that lifts crude and yields together would invalidate the long in real time. In that scenario a gap beneath the 31,280 stop removes the setup, and the 31,048.78 conversion of the NDX 30,790 modeled volatility threshold becomes the reference within one 14-day average true range of 455.18 points.
Alternate setup: the session review states none.
Sources and methodology
This outlook is built from our session review of the December E-mini Nasdaq-100 contract, NQZ26, the December ’26 contract, prepared after Tuesday's close on October 6, 2026 for the Wednesday, October 7 session. The contract was verified before any level was used: the daily chart's completed Tuesday bar equals the provider's settlement row for the December contract, the chart's current Wednesday bar opened at 31,510.00, equal to the provider's day open, and the provider's published previous close of 31,483.25 equals the settlement, so chart and provider are on the same December contract. The Globex session reopened at 6:00 PM ET Tuesday, so the day high, day low and open on the provider's overview belong to the Wednesday session and are not used as Tuesday's range. Tuesday's extremes are the completed-session inputs behind the published pivot ladder, back-solved from the outer pivot pairs, verified against all seven published rungs, and reproduced by the chart's daily bar and the settlement row. No intraday series was preserved for Tuesday, so no statement here orders prices within Tuesday's session, and the prior card is graded only on what the completed daily bar shows.
The settlement averages were computed from the provider's 259-row daily settlement series, which excludes the partial Wednesday row, and are shown to two decimals; that series also supplies the seven closes charted above. Volume and open interest come from the provider's daily record: the 2026-10-06 row reads volume of 470,004 contracts and open interest of 281,627, and the 2026-10-05 row now reads volume of 468,008 and open interest of 286,884, where Tuesday's outlook carried 459,389 and 281,627 for Monday. The 286,884 open interest shown on the provider's overview is the 2026-10-05 figure. The oscillator readings are cited as published. The desk note is the 5:31 PM ET edition for Tuesday, read at 6:18 PM ET; its reference prices are Monday's closes and are used as such. Cash-denominated levels are translated with the measured 258.78 point basis, the settlement against the 4:00 PM ET cash close; the modeled threshold is not a listed strike. The two volatility-gauge percentages and the crude percentage are computed from the provider's closes and stated changes. The 52-week high cited is the provider's 31,616.50, dated 10/06/26, which replaced the 31,371.00 Monday high named in Tuesday's outlook. Scenario ranges, session bands and the path weighting are analyst judgment and carry no calibration. Items marked unconfirmed come from the news-feed calendar, the desk note or press reports and were not matched on the calendar used for confirmed times, and every catalyst whose time had passed by the 6:18 PM ET start of collection is recorded as completed.
Tuesday’s outlook for this contract is here and the broad-index outlook for the same date is here. Outlooks for ES, NQ, GC and CL are collected on the market outlook page, and our forward trading record is on the performance statement.



