
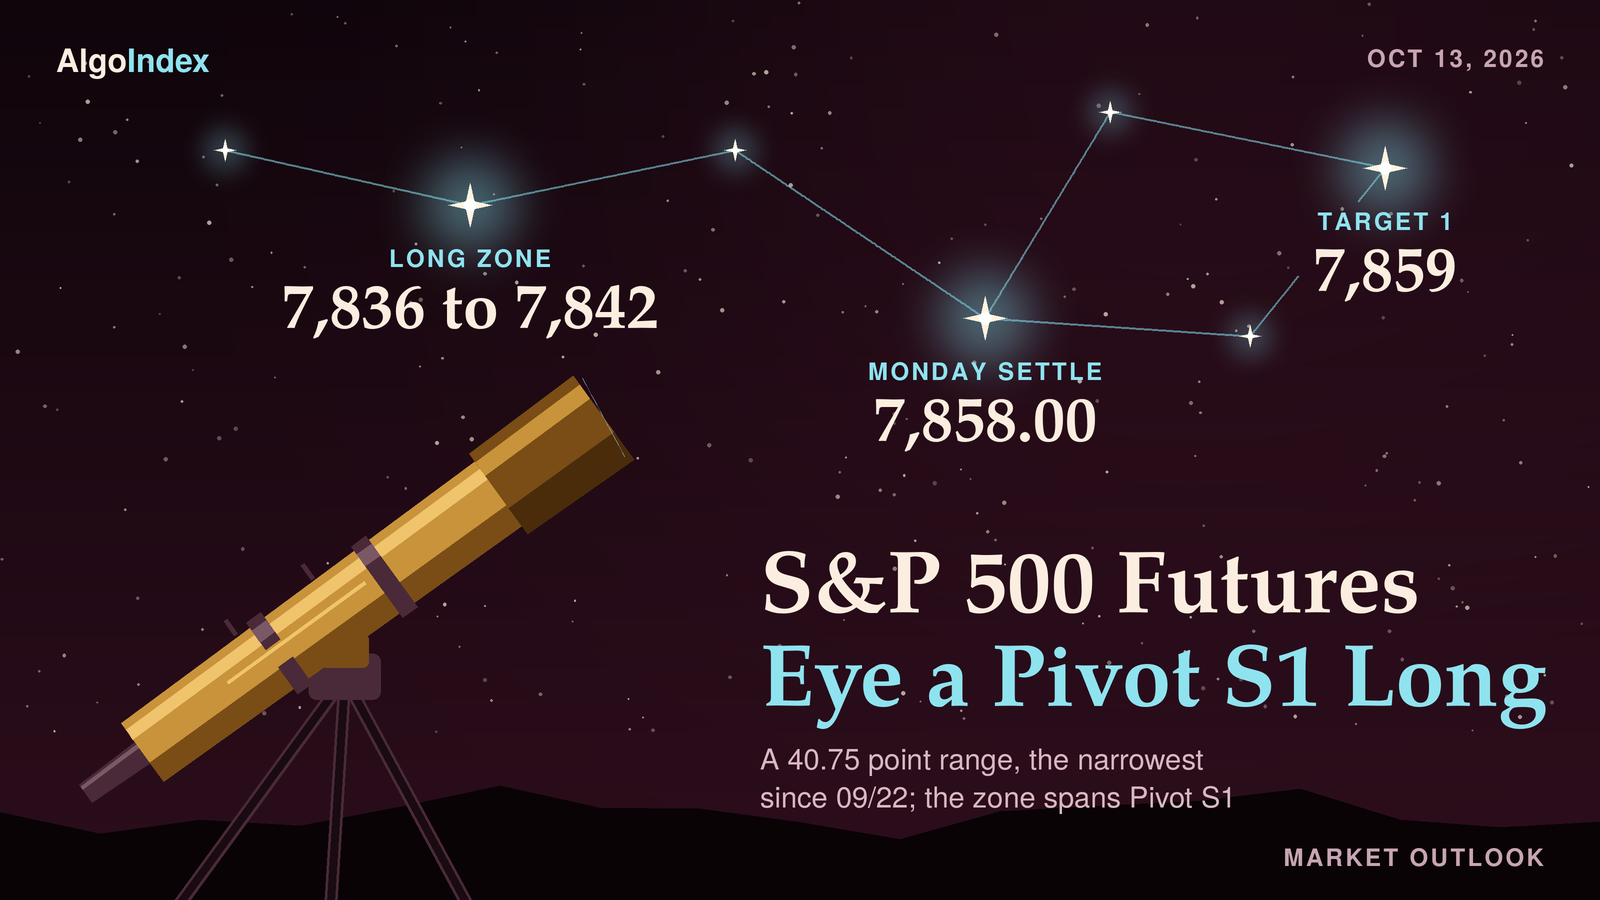
At 6:22 PM ET on Monday the December S&P 500 contract traded at 7,859.75, 1.75 points above the settle. Globex had reopened at 6:00 PM ET, and the new session had so far stayed inside 7,855.25 to 7,860.50. That leaves Tuesday's long zone, 7,836 to 7,842, 17.75 points beneath the quote.
Monday barely moved. December E-mini futures settled at 7,858.00, down 1.75 points or 0.02 percent, after a 7,846.25 to 7,887.00 session on the Columbus Day holiday. The 40.75 point range was the narrowest since the 38.00 point range of 09/22. Still a higher high and a higher low. The settle finished at 28.8 percent of the range and 15.00 points beneath the 7,873.00 open. The cash index closed at 7,807.24, down 0.06 percent, while the desk note described semiconductors down about 3 percent and the memory group about 4 percent.
December S&P 500 futures settled at 7,858.00. That sits 5.75 points beneath the 7,863.75 Pivot Point and above every settlement average from the 5-day at 7,852.15 to the 200-day at 7,383.80. The primary setup is a long from 7,836 to 7,842 around Pivot S1 at 7,840.50 and one standard deviation support at 7,836.44, stop 7,819 beneath 7,833.70, the desk note's futures pair for the modeled volatility threshold, targets 7,859, 7,879 and an extended 7,899. The band sits beneath the market. The settle sat 16.00 points above the band top and the 6:22 PM ET quote 17.75 above it, so the setup needs a dip to engage. The cash close sits 22.24 points above the 7,785 modeled volatility threshold with gamma tilt at 1.37. Bank earnings begin at about 7:00 AM ET on Tuesday, as the calendar lists them, and in the review's judgment the September consumer price index on Wednesday is the week's key scheduled event.
Monday's 7,846.25 low stopped 10.25 points above the long band
In Monday’s outlook we set a long from 7,828 to 7,836. Its stop sat at 7,808, with targets at 7,856, 7,880 and an extended 7,904. Monday's completed bar, from the review, opened at 7,873.00 at the Sunday 6:00 PM ET reopen, marked a high of 7,887.00 and a low of 7,846.25, and settled at 7,858.00. The dip fell short. The low stopped 10.25 points above the band's 7,836 top and 18.25 above its 7,828 bottom. The band never traded. No fill and no result is asserted.
Without an entry, the targets decide nothing. Price did print through the first two levels: the high cleared 7,856 by 31.00 points and 7,880 by 7.00, while 7,904 stayed 17.00 out of reach. Those prints carry no result. The 7,808 stop sat 38.25 points beneath the low and was never in play.
The card's hard lines stayed far away. It named a settle beneath 7,816.07, the desk note's pair for the modeled volatility threshold, as the invalidation, and the 7,858.00 settle finished 41.93 points above it. Acceptance beneath two standard deviations support at 7,825.89 needed two consecutive 30-minute closes beneath that line. The low held 20.36 points above it. No such close was possible.
The Sunday update framed Monday's first test as whether Pivot R1 at 7,881.17 held as support or capped the move. The record answers only in part. The open at 7,873.00 sat 8.17 points beneath that pivot, the high cleared it by 5.83 and the settle finished 23.17 beneath it. No complete intraday series was preserved for Monday, so the daily bar cannot show when the high printed or how long price held above 7,881.17.
Our ranges held the session. The most likely band of 7,817 to 7,894 contained the whole bar, with the high 7.00 points beneath its top and the low 29.25 above its bottom. The low-range case of 7,828 to 7,881 held the settle but lost the high by 6.00 points. The high-range case of 7,784 to 7,935 was never stretched.
The weighted path held too. Monday's outlook expected a hold between Pivot S1 at 7,827.67 and Pivot R2 at 7,902.58. The low stayed 18.58 points above that Pivot S1 and the high 15.58 beneath Pivot R2. The named alternative was a weekend escalation that lifted yields and the dollar, or a renewed slide in chip shares, carrying the contract through 7,816.07 toward Pivot S3 at 7,774.17. Some of the triggers showed in Monday's data. The semiconductor index fell 2.67 percent, and the dollar index stood at 102.59 as of 6:26 PM ET against Friday's 102.21 close. The ten-year yield index was unchanged at 5.24 percent, with the cash Treasury market closed for Columbus Day, per the desk note. The price leg never started. The low held 30.18 points above 7,816.07. We grade the card as written.
Pivot S1 at 7,840.50, the 7,836 to 7,842 band and the 7,833.70 line
The basis widened. Monday's 7,858.00 settle less the 7,807.24 cash close measures 50.76 points, against 48.21 on Friday, and every cash equivalent in this article uses the new figure. The desk note keeps its own fixed 48.70 point offset, so its published futures pairs differ: 8,048.70 for the 8,000 gamma concentration, 7,948.70 for the 7,900 call-side ceiling, 7,833.70 for the 7,785 modeled volatility threshold, 7,755.70 for the 7,707 modeled gamma-flip level and 7,548.70 for the 7,500 put-side base.
Resistance starts within 6 points. The published target price at 7,862.25 (cash 7,811.49) and the Pivot Point at 7,863.75 (cash 7,812.99) sit 4.25 and 5.75 points above the settle, with Friday's 7,870.50 high (cash 7,819.74) next. One standard deviation resistance at 7,879.56 (cash 7,828.80) and Pivot R1 at 7,881.25 (cash 7,830.49) sit 1.69 points apart. Monday's 7,887.00 high (cash 7,836.24) and two standard deviations resistance at 7,888.48 (cash 7,837.72) sit just above them. Three standard deviations resistance at 7,895.34 (cash 7,844.58), the 7,897.50 one-month high from 10/06 (cash 7,846.74), Pivot R2 at 7,904.50 (cash 7,853.74) and the 7,905.00 52-week and 13-week high (cash 7,854.24) stack within 9.66 points. Pivot R3 at 7,922.00 (cash 7,871.24) is the last pivot. The 7,948.70 and 8,048.70 pairs sit beyond it.
Support begins close. The 5-day settlement average at 7,852.15 (cash 7,801.39) and Monday's 7,846.25 low (cash 7,795.49) sit 5.85 and 11.75 points beneath the settle. Then comes the band that anchors the setup. Pivot S1 at 7,840.50 (cash 7,789.74), one standard deviation support at 7,836.44 (cash 7,785.68) and 7,833.70, the desk note's pair for the 7,785 threshold, span 6.80 points. The 7,836 to 7,842 entry band wraps the first two, and its bottom sits 2.30 points above the threshold pair.
The stop's group sits next. Two standard deviations support at 7,827.52 (cash 7,776.76), the 9-day average crossing price at 7,823.53, Pivot S2 at 7,823.00 (cash 7,772.24), three standard deviations support at 7,820.66 (cash 7,769.90) and Friday's 7,817.00 low (cash 7,766.24) span 10.52 points. The 7,819 stop sits 1.66 beneath the three-deviation line and 2.00 above Friday's low. Lower down come the 9-day average at 7,811.53, Pivot S3 at 7,799.75 (cash 7,748.99), the 18-day crossing at 7,794.32, the 50-day average at 7,777.33, the 20-day average at 7,774.49, the 38.2 percent retracement from the four-week high at 7,774.30 and the 40-day crossing at 7,763.41. The deep references follow. Last week's 7,760.25 low, the 7,755.70 flip pair (cash 7,707), the 50 percent retracement of the four-week range at 7,736.25, the 100-day average at 7,686.74, the 7,575.00 one-month low, the 7,548.70 put-side pair (cash 7,500) and the 200-day average at 7,383.80 complete the list.
Every average sits beneath the settle. The 5-day stands 5.85 points under it, the 9-day 46.47, the 20-day 83.51 and the 50-day 80.67. The 100-day sits 171.26 beneath and the 200-day 474.20. The 5-day rose 6.35 points from Friday's 7,845.80 as the 10/05 settle of 7,826.25 left the window and 7,858.00 replaced it. The 20-day rose 8.26 from 7,766.23 and the 50-day 5.46 from 7,771.88. The quirk persists. The 50-day still sits above the 20-day, so the 30 older settlements in its window averaged 7,779.23, more than the latest 20. For Tuesday the averages would be crossed at 7,823.53 for the 9-day, 7,794.32 for the 18-day and 7,763.41 for the 40-day.
Momentum held up. Relative strength reads 61.04 on the 9-day, 58.26 on the 14-day and 56.64 on the 20-day. The raw stochastic reads 82.42 percent on both the 9 and 14-day windows, while the smoothed 14-day %K at 76.49 percent sits just beneath %D at 76.91 percent. Trend strength stays thin. Positive direction leads on the 9-day, 22.96 against 17.16 with the ADX at 14.52, and on the 14-day, 21.96 against 18.84 with the ADX at 10.67. Historic volatility reads 6.54 percent on the 9-day and 7.66 percent on the 14-day. These readings come from the provider's page for the Tuesday session, read after the 6:00 PM ET reopen. That page can substitute the live Globex price for the settle.
The composite multi-indicator read rose to 88 percent buy from 80 percent buy, with strength average and direction strengthening. It read 56 percent buy a week ago and 8 percent buy a month ago. The short-horizon group averages 60 percent buy. The medium and long-horizon groups both read 100 percent buy, and the composite trend indicator reads buy.
Ranges shrank again. The 14-day average true range stands at 72.92 points and the 14-day average daily range at 72.50; the 9-day figures are 70.95 and 72.50 and the 20-day figures 74.42 and 76.85. Monday's 40.75 point range was 0.56 times the 14-day average daily range. One average true range either side of the settle frames Tuesday between 7,785.08 and 7,930.92. The published deviation bands are tighter: 7,836.44 to 7,879.56 at one deviation, 7,827.52 to 7,888.48 at two and 7,820.66 to 7,895.34 at three. Built from five settlements, they describe settlement dispersion only.
Zoom out. Daily ranges over the last eight sessions ran 95.00, 87.00, 87.25, 68.50, 68.75, 75.25, 53.50 and 40.75 points. Settlement changes over the same stretch read plus 8.50, plus 53.25, plus 49.00, plus 47.75, minus 21.25, minus 36.50, plus 43.50 and minus 1.75. Last week, October 5 through October 9, spanned 7,760.25 to 7,897.50. Over five sessions the contract rose 31.75 points from the 7,826.25 settle of 10/05. The 52-week high of 7,905.00 sits 47.00 points above the settle and the 7,575.00 one-month low 283.00 beneath it. The retracement grid for Tuesday places the 38.2 percent line from the four-week high at 7,774.30 and the 50 percent line at 7,736.25. No four-hour series and no prior-quarter extremes were captured. Swing structure rests on daily bars.
Chip losses, a firmer dollar and Gulf headlines on a holiday Monday
Chips led the losers. The desk note said semiconductors fell about 3 percent and the memory group about 4 percent, while energy, consumer staples and healthcare rose about 1 percent each as capital rotated. The semiconductor index closed at 12,236.79, down 2.67 percent. The Dow Jones industrial average closed at 51,850.55, up 0.38 percent, while the S&P 500 slipped 0.06 percent and the Nasdaq-100 fell 0.71 percent. The desk note described a 32 basis point intraday range and a flat close for the cash index. Its session ran from 7,796.94 to 7,821.67.
Rates stood still. The cash Treasury market was closed for Columbus Day, per the desk note, and the ten-year yield index was unchanged at 5.24 percent. The dollar firmed. The dollar index stood at 102.59 as of 6:26 PM ET, up from Friday's 102.21 close, and the desk note described the dollar's close as its highest since April. A regional Federal Reserve president said at 1:35 PM ET to 1:40 PM ET, per the news feed, that the question for the central bank is how fast to make policy more restrictive and that more restraint is needed. November WTI crude settled at 93.74, up 2.06 percent, and December gold at 4,190.6, down 0.61 percent.
Then the Gulf. The news feed carried at 2:02 PM ET to 2:14 PM ET reports of a warning in Riyadh, explosions heard and a ballistic missile destroyed by the Saudi-led coalition. More followed within the hour. At 3:02 PM ET it carried a British navy report that a crude tanker was struck by an unknown projectile in Hormuz, and at 3:03 PM ET a Houthi statement claiming an attack on Riyadh's airport, per the news feed. After the cash close, at 5:00 PM ET, the President said, per the news feed, that the leaders of Ukraine and Russia have to meet and end the war. These are statements carried by the news feed. None was confirmed for this review, and no link between them and any price move is asserted.
The banks report next. Bank results begin with the largest bank at about 7:00 AM ET, a second large bank at about 7:30 AM ET and a third at about 8:00 AM ET, as the calendar lists them. The desk note said the second bank's options imply a 3.6 percent move and that the stock closed just beneath its key positioning level. A technology headline ran too. On Monday, at 12:55 PM ET to 1:05 PM ET, the news feed carried, citing a press report for part of it, that the largest social-media company introduced a larger class of artificial-intelligence models and signalled further spending. These are statements carried by the news feed and the desk note. None is a result confirmed for this review.
Implied volatility stayed low. The volatility index closed at 15.21, up 0.37, and the Nasdaq-100 implied-volatility gauge at 20.84. The desk note put the volatility-of-volatility index at 85.93 and said the volatility complex is still trading in an unusually low zone for October. Per the desk note, fixed-strike implied volatility rose one to two points for the week, while at-the-money implied volatility for the week sits between 9 and 11 percent. The note also cited monthly options expiration on Friday, October 16, 2026, per the desk note and unconfirmed. Its implied one-day move is 0.53 percent, about 41.38 points on the 7,807.24 close, and its implied five-day move 1.22 percent. That is about 95.25 points.
The cash close sits above the model lines. The desk note used is the 5:22 PM ET Monday edition, and its reference column carries Friday's closes: its 7,811 reference equals Friday's 7,811.54 cash close. Against Monday's 7,807.24 close, the index sits 22.24 points above the 7,785 modeled volatility threshold, 100.24 above the 7,707 modeled gamma-flip level and 92.76 beneath the 7,900 call-side ceiling. Gamma tilt reads 1.37 and gamma notional plus 1.22 billion dollars. Dealer gamma stays positive. The modeled threshold and flip level are model outputs; neither is an option strike.
A positioning console for the cash index, dated 2026-10-10, built from the Friday close and read at about 6:24 PM ET, shows call gamma of 8.88 billion against put gamma of minus 2.72 billion, with 7.76 percent of gamma in the nearest expiration. One-month implied volatility of 11.70 percent sits above one-month realised volatility of 9.91 percent. The implied-volatility rank reads 8.71 percent and the skew rank 90.91 percent. In the review's interpretation a cash close above the modeled volatility threshold, with positive gamma tilt and low near-term implied volatility, favours contained dips toward the 7,833.70 to 7,840.50 zone over a trend day lower.
The note draws its own map. It lists resistance at 7,830, 7,850 and 7,900, support at 7,800, 7,750 and 7,700, a desk pivot at 7,690 and key strikes at 8,000, 7,800, 7,000 and 7,700, all in cash. Per the desk note, positive gamma between 7,700 and 7,800 should keep the index contained, and a same-day position of about 7 thousand contracts at the 7,800 strike provided support. One line points the other way. The desk note said that after Monday a move above 7,825 could extend quickly because gamma above that level is negative. Monday's cash high of 7,821.67 stayed 3.33 points beneath that line.
Then the flow. The S&P 500 hedging-flow measure finished at about minus 2 billion dollars of delta, driven by longer-dated call selling, which the desk note read as traders unwinding some upside exposure into a catalyst-heavy week. Volume thinned. Monday's December volume was 891,209 contracts against 1,130,030 on Friday, the revised 2026-10-09 row that replaces the 1,077,892 carried in Monday's outlook. Open interest reads 1,914,613 on the 2026-10-12 row against 1,911,164 on the revised 2026-10-09 row. The positioning report as of October 6, 2026 puts leveraged funds at 113,223 long against 528,310 short and asset managers at 1,106,717 long against 200,102 short.
The trade map for Tuesday
The primary setup is a long from 7,836 to 7,842. The cash close sits 22.24 points above the 7,785 modeled volatility threshold with positive dealer gamma, the settle sits above every settlement average from the 5-day to the 200-day, and the composite rose to 88 percent buy with direction strengthening. The band holds Pivot S1 at 7,840.50 and one standard deviation support at 7,836.44. Its bottom sits 2.30 points above 7,833.70. The stop sits at 7,819, beneath 7,833.70 and three standard deviations support at 7,820.66. Targets step up. The first, 7,859, sits 3.25 beneath the 7,862.25 published target price; the second, 7,879, sits 0.56 beneath one standard deviation resistance at 7,879.56; and the extended 7,899 sits 1.50 above the 7,897.50 one-month high. A narrow Monday range, low ADX readings and a sharp fall in chip shares lead the review to call the setup an analyst judgment that dips stay contained above the threshold pair. No measured edge stands behind it.
Now the arithmetic. From the 7,839 midpoint the risk to the stop is 20 points, 27.4 percent of the 14-day average true range of 72.92. The targets sit 20, 40 and 60 points above the midpoint. Exact multiples. The settle sat 16.00 points above the band top, and the 6:22 PM ET quote of 7,859.75 sits 17.75 above it. The new session's low so far, 7,855.25, stayed 13.25 points above the band. A one-range frame from the settle, 7,785.08 to 7,930.92, holds the band, the stop and all three targets. One oddity stands out. The first target at 7,859 sits just 1.00 point above the settle, and the 6:22 PM ET quote already sat 0.75 above it.
The session bands are the review's analyst judgment. Through Globex the review expects roughly 7,835 to 7,882, with a neutral to higher bias above Pivot S1 at 7,840.50. London runs 7,830 to 7,886, with the 7,836 to 7,842 band the first meaningful support. The morning band is 7,826 to 7,893 and the afternoon band 7,823 to 7,898. The scenario ranges run 7,840 to 7,882 for the low-range case, 7,827 to 7,889 for the most likely and 7,785 to 7,931 for the high-range case. The cash open at 9:30 AM ET sets the session's first directional test.
Tuesday's calendar starts early. A Federal Reserve governor speaks at 3:45 AM ET, and bank results follow from about 7:00 AM ET, as the calendar lists them. The cash session runs from 9:30 AM ET to 4:00 PM ET. Existing home sales are listed at 10:00 AM ET and regional Federal Reserve presidents at 10:00 AM ET, 1:00 PM ET and 4:00 PM ET, all per the news-feed calendar and unconfirmed. Monday night's listings were the President's remarks at 7:00 PM ET, Japanese producer prices at 7:50 PM ET, the Australian central bank's minutes at 8:30 PM ET and the International Monetary Fund's World Economic Outlook at 10:00 PM ET, also per the news-feed calendar and unconfirmed. The review was written before those times. Chinese consumer and producer prices are listed at 9:30 PM ET Tuesday, per the news-feed calendar and unconfirmed.
The week builds toward Wednesday. The September consumer price index lands at 8:30 AM ET on Wednesday, October 14, 2026, and retail sales and producer prices follow at 8:30 AM ET on Thursday, October 15, 2026, as the calendar lists them. In the review's judgment the first-order influence on Tuesday is the start of bank earnings at about 7:00 AM ET, with Wednesday's inflation report the week's key scheduled event.
One path is weighted. In this review's analyst judgment the most probable path holds the contract between two standard deviations support at 7,827.52 and two standard deviations resistance at 7,888.48, with bank results and chip shares deciding the side. In the same judgment, a dip toward the 7,836 to 7,842 band that holds above the 7,833.70 threshold pair is weighted above a break lower. It rests on judgment alone. The alternative that would invalidate the reading is a further slide in chip shares, or a Gulf escalation that lifts the dollar, carrying the contract through 7,827.52 toward Pivot S3 at 7,799.75.
Monday's low missed the old band by 10.25 points; the new band's 7,842 top sits 4.25 points beneath that same low.
The complete data picture
Every number behind Tuesday’s plan, charted first, then the full level lists, then the complete numeric reference underneath.
Full numeric reference, every remaining figure from the session review
1. Executive Summary
The December S&P 500 contract settled at 7,858.00 on Monday, down 1.75 points or 0.02 percent from Friday's settle of 7,859.75, after trading between 7,887.00 and 7,846.25, a 40.75 point daily range. The settle finished at 28.8 percent of the range, and the range was 0.56 times the published 14-day average daily range of 72.50 points. Monday printed a higher high and a higher low against Friday, and its 40.75 point range was the narrowest since the 38.00 point range of 09/22. Over five sessions the contract rose 31.75 points from the 7,826.25 settle of 10/05.
The S&P 500 cash index closed at 7,807.24, down 4.30 points or 0.06 percent. Its Monday session ran from 7,796.94 to 7,821.67. The desk note described a 32 basis point intraday range and a flat close, with semiconductors down about 3 percent and the memory group about 4 percent. Per the desk note, energy, consumer staples and healthcare rose about 1 percent each as capital rotated. The Dow Jones Industrial Average closed at 51,850.55, up 0.38 percent, the Nasdaq-100 fell 0.71 percent and the semiconductor index 2.67 percent.
November WTI crude settled at 93.74, up 2.06 percent, while the news feed carried Saudi and Hormuz headlines. The dollar index stood at 102.59 as of 6:26 PM ET, up from Friday's 102.21 close, and the cash Treasury market was closed for Columbus Day, per the desk note, with the ten-year yield index unchanged at 5.24 percent. The volatility index closed at 15.21, up 0.37. The cash close sits 22.24 points above the modeled volatility threshold at SPX 7,785 published in the desk note, with gamma tilt at 1.37 and positive gamma notional.
The Tuesday session opens with bank earnings from about 7:00 AM ET, as the calendar lists it, and the September consumer price index at 8:30 AM ET on Wednesday, October 14, 2026, as the calendar lists it. The primary setup is a long from the 7,836 to 7,842 band, around Pivot S1 at 7,840.50 and one standard deviation support at 7,836.44, above the 7,833.70 source futures pair of the modeled volatility threshold, stopped at 7,819, with objectives at 7,859, 7,879 and an extended 7,899.
2. Price Action & Technical Structure
2.1 Intraday and Session Review
The Monday session opened at 7,873.00 at the Sunday 6:00 PM ET reopen, 13.25 points above Friday's settle, marked a daily high of 7,887.00 and a daily low of 7,846.25, and settled at 7,858.00. No complete intraday series was preserved for this session, so this review makes no claim about when the high or the low printed or about the path between them.
After the settle, the chart's 4:30 PM ET bar closed at 7,857.00; that post-settlement quote is not used as the settlement anywhere in this review. Globex reopened at 6:00 PM ET, so the provider's displayed day open, high and low of 7,855.50, 7,860.50 and 7,855.25 belong to the new session dated Tuesday, not to Monday, and are not used as Monday's range.
The session extremes used here are the completed-session inputs behind the published pivot ladder rather than an independently read bar, back-solved from the outer pivot pairs and verified against every rung. Pivot R3 at 7,922.00 minus Pivot S3 at 7,799.75, divided by three, returns 40.75, and Pivot R2 at 7,904.50 minus Pivot S2 at 7,823.00, divided by two, returns the same 40.75. Three times the Pivot Point of 7,863.75 less the 7,858.00 settle gives a high plus low sum of 15,733.25, which the pair of 7,887.00 and 7,846.25 reproduces, and that pair reproduces all seven published rungs. Independent corroboration: the provider's settlement row, the chart's completed Monday daily bar and the extremes of the captured Monday 30-minute bars carry the same 7,887.00 high and 7,846.25 low.
2.2 Daily Structure
Monday printed a higher high and a higher low against Friday: the 7,887.00 high sits 16.50 points above Friday's 7,870.50, and the 7,846.25 low sits 29.25 points above Friday's 7,817.00. The settle at 28.8 percent of the range leaves an upper shadow of 14.00 points and a lower shadow of 11.75 points on the daily bar, with the settle 15.00 points beneath the open. The sequence of session highs over the last six sessions reads 7,847.50, 7,897.50, 7,884.50, 7,858.25, 7,870.50 and 7,887.00, and the sequence of session lows reads 7,760.25, 7,829.00, 7,815.75, 7,783.00, 7,817.00 and 7,846.25. Settlements over the same six sessions ran 7,826.25, 7,874.00, 7,852.75, 7,816.25, 7,859.75 and 7,858.00.
Last week, October 5 through October 9, spanned 7,897.50 to 7,760.25. The 52-week and 13-week high of 7,905.00 sits 47.00 points above the settle, and the one-month low of 7,575.00 sits 283.00 points beneath it.
No prior-quarter high or low was captured for this session, so the 13-week extremes serve as the available quarterly reference.
2.3 4-Hour and Swing Structure
Daily ranges for the last eight sessions ran 95.00, 87.00, 87.25, 68.50, 68.75, 75.25, 53.50 and 40.75. The settlement changes over the same eight sessions read plus 8.50, plus 53.25, plus 49.00, plus 47.75, minus 21.25, minus 36.50, plus 43.50 and minus 1.75.
The retracement grid published for Tuesday places the 38.2 percent retracement from the four-week high at 7,774.30 and the 50 percent retracement of the four-week range at 7,736.25. No four-hour series was captured for this session, so swing structure here rests on daily bars only.
2.4 Moving Averages
The averages cited in this subsection were computed from the provider's daily settlement series for the December contract, which holds 259 completed sessions through Monday. The 5-day average stands at 7,852.15, the 9-day at 7,811.53, the 20-day at 7,774.49, the 50-day at 7,777.33, the 100-day at 7,686.74 and the 200-day at 7,383.80.
The 7,858.00 settle sits 5.85 points above the 5-day average, 46.47 points above the 9-day, 83.51 points above the 20-day, 80.67 points above the 50-day, 171.26 points above the 100-day and 474.20 points above the 200-day. The 5-day average rose 6.35 points from Friday's 7,845.80, because the 10/05 settle of 7,826.25 left the window and was replaced by 7,858.00. The 20-day rose 8.26 points from 7,766.23 and the 50-day 5.46 points from 7,771.88.
The 50-day average sits above the 20-day because the last 20 settlements averaged 7,774.49 against 7,777.33 for the full 50, which means the 30 older settlements in the 50-day window averaged higher, at 7,779.23. The projection grid gives the prices at which each average would be crossed on Tuesday: 7,823.53 for the 9-day, 7,794.32 for the 18-day and 7,763.41 for the 40-day.
2.5 Oscillator and Trend Readings
The oscillator figures below are as published on the provider's technical page dated for the Tuesday session and read after the 6:00 PM ET reopen; the page can substitute the live Globex price for the settle, so these readings carry that caveat. The 9-day relative strength reads 61.04, the 14-day relative strength 58.26 and the 20-day relative strength 56.64.
The 9-day raw stochastic reads 82.42 percent and the 14-day raw stochastic 82.42 percent, while the 14-day stochastic %K reads 76.49 percent and the 14-day stochastic %D 76.91 percent, so the smoothed lines sit in the upper quarter of their range with %K just beneath %D.
The 9-day directional index ADX reads 14.52 with the 9-day +DI at 22.96 and the 9-day -DI at 17.16; the 14-day directional index ADX reads 10.67 with the 14-day +DI at 21.96 and the 14-day -DI at 18.84, so positive direction leads on both while the ADX readings stay low. The 9-day historic volatility reads 6.54 percent and the 14-day historic volatility 7.66 percent.
The composite multi-indicator read published for the Tuesday session is 88 percent buy, up from 80 percent buy in the prior session's snapshot, with signal strength described as average and direction as strengthening. The snapshot history reads 56 percent buy a week ago and 8 percent buy a month ago. The short-horizon group averages 60 percent buy, the medium-horizon group 100 percent buy and the long-horizon group 100 percent buy, and the composite trend indicator reads buy.
2.6 Volatility and Expected Range
The published 14-day average true range stands at 72.92 points and the 14-day average daily range at 72.50 points; the 9-day average true range is 70.95 with a 9-day average daily range of 72.50, and the 20-day average true range is 74.42 with a 20-day average daily range of 76.85. Monday's 40.75 point range was 0.56 times the 14-day average daily range.
Adding and subtracting the 14-day average true range of 72.92 points from the 7,858.00 settle frames Tuesday between 7,785.08 and 7,930.92. The published standard-deviation bands are narrower because they are built from five settlements: one deviation spans 7,836.44 to 7,879.56, two spans 7,827.52 to 7,888.48 and three spans 7,820.66 to 7,895.34. These bands describe settlement dispersion, not intraday reach.
3. Key Levels
3.1 Resistance
Above the 7,858.00 settle, the published target price at 7,862.25 and the Pivot Point at 7,863.75 come first. One standard deviation resistance at 7,879.56, Pivot R1 at 7,881.25, Monday's 7,887.00 high and two standard deviations resistance at 7,888.48 form the next band. Three standard deviations resistance at 7,895.34, the 7,897.50 one-month high, Pivot R2 at 7,904.50 and the 7,905.00 52-week high follow. Pivot R3 at 7,922.00 and the 7,948.70 source futures pair of the primary call side ceiling at SPX 7,900 are the extended references, with the 8,048.70 source pair of the largest gamma concentration at SPX 8,000 beyond.
3.2 Support
Beneath the settle, the 5-day settlement average at 7,852.15 and Monday's 7,846.25 low come first. Pivot S1 at 7,840.50, one standard deviation support at 7,836.44 and the 7,833.70 source futures pair of the modeled volatility threshold at SPX 7,785 form the band that anchors the setup. Two standard deviations support at 7,827.52, the 9-day average crossing price at 7,823.53, Pivot S2 at 7,823.00, three standard deviations support at 7,820.66 and Friday's 7,817.00 low form the next grouping. Pivot S3 at 7,799.75, the 18-day average crossing price at 7,794.32 and the 7,755.70 source pair of the modeled gamma-flip level at SPX 7,707 follow, with the 7,548.70 source pair of the primary put side support base at SPX 7,500 beyond.
4. Macro Drivers
4.1 Dollar, Rates, and Fed Policy
The cash Treasury market was closed for Columbus Day, per the desk note, and the ten-year yield index was unchanged at 5.24 percent. The dollar index stood at 102.59 as of 6:26 PM ET, up from Friday's 102.21 close, and the desk note described the dollar's close as its highest since April. A regional Federal Reserve president said at 1:35 PM ET to 1:40 PM ET, per the news feed, that the question for the central bank is how fast to make policy more restrictive and that more restraint is needed. The consumer price index for September is scheduled for 8:30 AM ET on Wednesday, October 14, 2026, as the calendar lists it.
4.2 Large-Cap Leadership and Earnings
Bank earnings begin on Tuesday, October 13, 2026, with the largest bank's results at about 7:00 AM ET, as the calendar lists it, and a second large bank at about 7:30 AM ET, as the calendar lists it. The desk note said that bank's options imply a 3.6 percent move and that the stock closed just beneath its key positioning level. The news feed carried at 12:55 PM ET to 1:05 PM ET, citing a press report for part of it, that the largest social-media company introduced a larger class of artificial-intelligence models and signalled further spending. These are statements carried by the news feed and the desk note rather than results confirmed for this review.
4.3 Geopolitical Backdrop
The news feed carried at 2:02 PM ET to 2:14 PM ET reports of a warning in Riyadh, explosions heard and a ballistic missile destroyed by the Saudi-led coalition, at 3:02 PM ET a British navy report that a crude tanker was struck by an unknown projectile in Hormuz, and at 3:03 PM ET a Houthi statement claiming an attack on Riyadh's airport. At 5:00 PM ET the President said, per the news feed, that the leaders of Ukraine and Russia have to meet and end the war. These are statements carried by the news feed rather than events confirmed for this review.
4.4 Sector Breadth and Rotation
The desk note said semiconductors fell about 3 percent and the memory group about 4 percent, while energy, consumer staples and healthcare rose about 1 percent each as capital rotation continued. The semiconductor index closed at 12,236.79, down 2.67 percent. The Dow Jones Industrial Average rose 0.38 percent while the S&P 500 slipped 0.06 percent and the Nasdaq-100 fell 0.71 percent.
4.5 Cross-Asset and Volatility
The volatility index closed at 15.21, up 0.37. The Nasdaq-100 implied-volatility gauge closed at 20.84. The desk note put the volatility-of-volatility index at 85.93, said the volatility complex is still trading in an unusually low zone for October, and said fixed-strike implied volatility rose one to two points for the week while at-the-money implied volatility for the week remains between 9 and 11 percent. The desk note also cited monthly options expiration on Friday, October 16, 2026, per the desk note and unconfirmed. November WTI crude settled at 93.74, up 2.06 percent, and gold at 4,190.6, down 0.61 percent.
4.6 Institutional Positioning
Monday's volume on the December contract was 891,209 contracts against 1,130,030 on Friday. The provider's settlement series shows open interest of 1,914,613 against 1,911,164 on Friday. The positioning report as of October 6, 2026, shown on the provider's overview, puts leveraged funds at 113,223 long against 528,310 short and asset managers at 1,106,717 long against 200,102 short. The desk note said the S&P 500 hedging-flow measure finished at about minus 2 billion dollars of delta, driven by longer-dated call selling, and read it as traders unwinding some upside exposure into a catalyst-heavy week.
5. SPX Options Flow Context
The desk note read for this section is the 5:22 PM ET edition for Monday. Its reference prices are the prior session's closes, not Monday's: SPX 7,811 equals Friday's 7,811.54 cash close, and 7,811.54 less 0.06 percent gives 7,806.9, consistent with the note's stated 7,807 close and the provider's 7,807.24. Every level below is read against Monday's 7,807.24 cash close.
On the index the primary call side ceiling sits at SPX 7,900, the largest gamma concentration at SPX 8,000, the modeled volatility threshold at SPX 7,785, the modeled gamma-flip level at SPX 7,707 and the primary put side support base at SPX 7,500. The close sits 92.76 points beneath the 7,900 ceiling, 22.24 points above the threshold and 100.24 points above the flip level. Gamma tilt reads 1.37 and gamma notional plus 1.22 billion dollars, so dealer gamma remains positive. The note's summary lists resistance at 7,830, 7,850 and 7,900, support at 7,800, 7,750 and 7,700 and its desk pivot at 7,690, and its key strikes are SPX 8,000, 7,800, 7,000 and 7,700.
The note publishes its own December futures pair for each level, carrying the source's 48.70 point offset rather than this review's measured 50.76 point basis: the ceiling at 7,948.70, the largest concentration at 8,048.70, the modeled volatility threshold at 7,833.70, the modeled gamma-flip level at 7,755.70 and the put side support base at 7,548.70. These are quoted as the source's pairs. The modeled threshold and flip level are model outputs, not option strikes.
The desk note's narrative said positive gamma between 7,700 and 7,800 should keep the index contained, that a same-day position of about 7 thousand contracts at the 7,800 strike provided support. The desk note also said that after Monday a move above 7,825 could extend quickly because gamma above that level is negative. The note's implied one-day move is 0.53 percent, or about 41.38 points on the 7,807.24 close, and its implied five-day move 1.22 percent, or about 95.25 points. Its published implied one-day high and low do not reconcile with either the reference or the close, so that pair is excluded.
The S&P 500 positioning console, Date Updated 2026-10-10 and built from the Friday close, read at about 6:24 PM ET, shows call gamma of 8.88 billion against put gamma of minus 2.72 billion, with 7.76 percent of gamma attributed to the nearest expiration. One-month implied volatility of 11.70 percent sits above one-month realised volatility of 9.91 percent, with an implied-volatility rank of 8.71 percent and a skew rank of 90.91 percent. Its current-price field of 7,807.55 is a post-close indicative quote, not the close, and its high and low volatility point fields are treated as low-confidence and excluded.
In this review's interpretation a cash close above the modeled volatility threshold, with positive gamma tilt and low near-term implied volatility, favours contained dips toward the 7,833.70 to 7,840.50 zone rather than a trend day lower, and the primary setup buys the band just above that threshold pair.
6. Forecast
6.1 Night Session (6:00 PM ET Monday to 3:00 AM ET Tuesday, Globex/Asia)
Globex reopened at 6:00 PM ET with the December contract quoted at 7,859.75 at 6:22 PM ET, 1.75 points above the settle. The President's remarks were listed at 7:00 PM ET, Japanese producer prices at 7:50 PM ET and the International Monetary Fund's World Economic Outlook at 10:00 PM ET, all per the news-feed calendar and unconfirmed; the review was written at about 6:27 PM ET, before those listed times, so it records them as listings only. Bias neutral to higher above Pivot S1 at 7,840.50, expected Globex band roughly 7,835 to 7,882.
6.2 London Session (3:00 AM ET to 8:00 AM ET Tuesday)
A Federal Reserve governor speaks at 3:45 AM ET, as the calendar lists it. Bias neutral to higher, expected band roughly 7,830 to 7,886, with the 7,836 to 7,842 band the first meaningful support.
6.3 Morning Session (9:30 AM ET to 12:00 PM ET Tuesday, RTH Open)
Bank earnings arrive before the cash open, with the largest bank's results at about 7:00 AM ET, as the calendar lists it. The cash open at 9:30 AM ET sets the session's first directional test. Existing home sales are listed at 10:00 AM ET, per the news-feed calendar and unconfirmed. Expected band roughly 7,826 to 7,893.
6.4 Afternoon Session (12:00 PM ET to 4:00 PM ET Tuesday)
A regional Federal Reserve president is listed at 1:00 PM ET and another at 4:00 PM ET, both per the news-feed calendar and unconfirmed. The cash close follows at 4:00 PM ET. Expected band roughly 7,823 to 7,898.
6.5 Night Session Forward (6:00 PM ET Tuesday)
The Wednesday session opens at 6:00 PM ET Tuesday. Chinese consumer and producer prices are listed at 9:30 PM ET, per the news-feed calendar and unconfirmed. The consumer price index for September is scheduled for 8:30 AM ET on Wednesday, October 14, 2026, as the calendar lists it.
6.6 Expected Range (Tuesday Full Session)
Low-range scenario: 7,840 to 7,882
Mid-range scenario (most likely): 7,827 to 7,889
High-range scenario: 7,785 to 7,931
6.7 Most Likely Path
In this review's analyst judgment the most probable path holds the contract between two standard deviations support at 7,827.52 and two standard deviations resistance at 7,888.48, with bank results and chip shares deciding the side. A dip toward the 7,836 to 7,842 band that holds above the 7,833.70 threshold pair is weighted above a break lower, because the cash close sits above the modeled volatility threshold with positive dealer gamma, the settle sits above every settlement average from the 5-day to the 200-day, and the composite rose to 88 percent buy with direction strengthening. The alternative that would invalidate this reading is a further slide in chip shares, or a Gulf escalation that lifts the dollar, carrying the contract through 7,827.52 toward Pivot S3 at 7,799.75.
7. Tuesday Economic Calendar
Globex reopened at 6:00 PM ET on Monday. The President's remarks were listed at 7:00 PM ET, Japanese producer prices at 7:50 PM ET, the Australian central bank's minutes at 8:30 PM ET and the International Monetary Fund's World Economic Outlook at 10:00 PM ET, all per the news-feed calendar and unconfirmed.
On Tuesday, a Federal Reserve governor speaks at 3:45 AM ET, as the calendar lists it. Bank earnings begin with the largest bank's results at about 7:00 AM ET, a second large bank at about 7:30 AM ET and a third at about 8:00 AM ET, all as the calendar lists them. The cash session runs from 9:30 AM ET to 4:00 PM ET. Existing home sales are listed at 10:00 AM ET, and regional Federal Reserve presidents at 10:00 AM ET, 1:00 PM ET and 4:00 PM ET, all per the news-feed calendar and unconfirmed. Chinese consumer and producer prices are listed at 9:30 PM ET, per the news-feed calendar and unconfirmed.
Later in the week, the consumer price index for September is scheduled for 8:30 AM ET on Wednesday, October 14, 2026, as the calendar lists it. Retail sales and producer prices are scheduled for 8:30 AM ET on Thursday, October 15, 2026, as the calendar lists it. In this review's judgment the first-order influence on the S&P 500 on Tuesday is the start of bank earnings at about 7:00 AM ET, as the calendar lists it, with Wednesday's inflation report the week's key scheduled event.
8. Primary Trade Setup
Direction: Long
Rationale: The cash close sits 22.24 points above the modeled volatility threshold at SPX 7,785 with positive dealer gamma, the settle sits above every settlement average from the 5-day to the 200-day, and the composite rose to 88 percent buy with direction strengthening; a dip into Pivot S1 at 7,840.50 and one standard deviation support at 7,836.44 offers a long with a defined risk point beneath the 7,833.70 source futures pair of that threshold. Monday settled at 28.8 percent of a narrow range, the directional systems show low ADX readings and chip shares fell sharply, so the setup is an analyst judgment that dips stay contained above the threshold pair, not a measured edge.
Entry Zone: 7,836 to 7,842
Stop Loss: 7,819 (beneath the 7,833.70 source pair of the modeled volatility threshold and three standard deviations support at 7,820.66)
Target 1 (T1): 7,859 (3.25 beneath the 7,862.25 published target price)
Target 2 (T2): 7,879 (0.56 beneath one standard deviation resistance at 7,879.56)
Target 3 (T3, extended): 7,899 (1.50 above the 7,897.50 one-month high)
Risk-to-Reward: Approximately 1:1 to T1, 1:2 to T2, 1:3 to T3
Invalidation: A settle beneath two standard deviations support at 7,827.52 negates the thesis. Short of that, the edge is removed by acceptance beneath the 7,833.70 source pair of the modeled volatility threshold rather than by a touch, defined as two consecutive 30-minute closes beneath 7,833.70.
Macro override: Weak bank results, a further slide in chip shares, or a Gulf escalation that lifts the dollar would invalidate the long in real time. In that scenario a move through the 7,819 stop removes the setup, and Pivot S3 at 7,799.75 and the 7,755.70 gamma-flip pair become the references within one 14-day average true range of 72.92 points.
Sources and methodology
This outlook is built from our session review of the December E-mini S&P 500 contract, the December ’26 contract, prepared after Monday's close on October 12, 2026 for the Tuesday, October 13, 2026 session. Monday's completed extremes are the inputs behind the published pivot ladder: Pivot R3 at 7,922.00 less Pivot S3 at 7,799.75, divided by three, and Pivot R2 at 7,904.50 less Pivot S2 at 7,823.00, divided by two, both return 40.75, and three times the 7,863.75 Pivot Point less the settle gives a high-plus-low sum of 15,733.25, which the pair of 7,887.00 and 7,846.25 reproduces. The provider's settlement row, the chart's completed Monday daily bar and the extremes of the Monday 30-minute bars carry the same high and low. Those figures and the review's own statements are the only evidence used to grade Monday's card. No complete intraday series was preserved, so no claim is made about when the high or the low printed. Friday's volume now reads 1,130,030 contracts on the revised 2026-10-09 row, which replaces the 1,077,892 carried in Monday's outlook; that post was not changed.
The moving averages were computed from the provider's 259-session daily settlement series through Monday; the oscillators are cited as published for the Tuesday session, read after the 6:00 PM ET reopen, and that page can substitute the live Globex price for the settle. The desk note used is the 5:22 PM ET edition for Monday, October 12; its reference column carries Friday's closes and its futures column a fixed 48.70 point translation, so cash equivalents here use the 50.76 point basis measured on Monday, settlement against cash close. The note's implied one-day high and low pair does not reconcile with either the reference or the close and is excluded. The console's 7,807.55 current-price field is a post-close indicative quote, and its high and low volatility point fields are excluded as low-confidence. After the settle, the 4:30 PM ET bar closed at 7,857.00, a post-settlement quote that is not used as the settlement, and the provider's 7,855.50 open, 7,860.50 high and 7,855.25 low belong to the new session dated Tuesday. Scenario ranges are analyst judgment. Items marked unconfirmed come from the news-feed calendar or press reports, and every catalyst whose release time had passed at the time of writing is recorded as completed.
Monday’s outlook for this contract is here, and the Nasdaq-100 contract’s Monday outlook covers the index that fell 0.71 percent in cash on Monday. Outlooks for ES, NQ, GC and CL are collected on the market outlook page, and our forward trading record is on the performance statement.



