
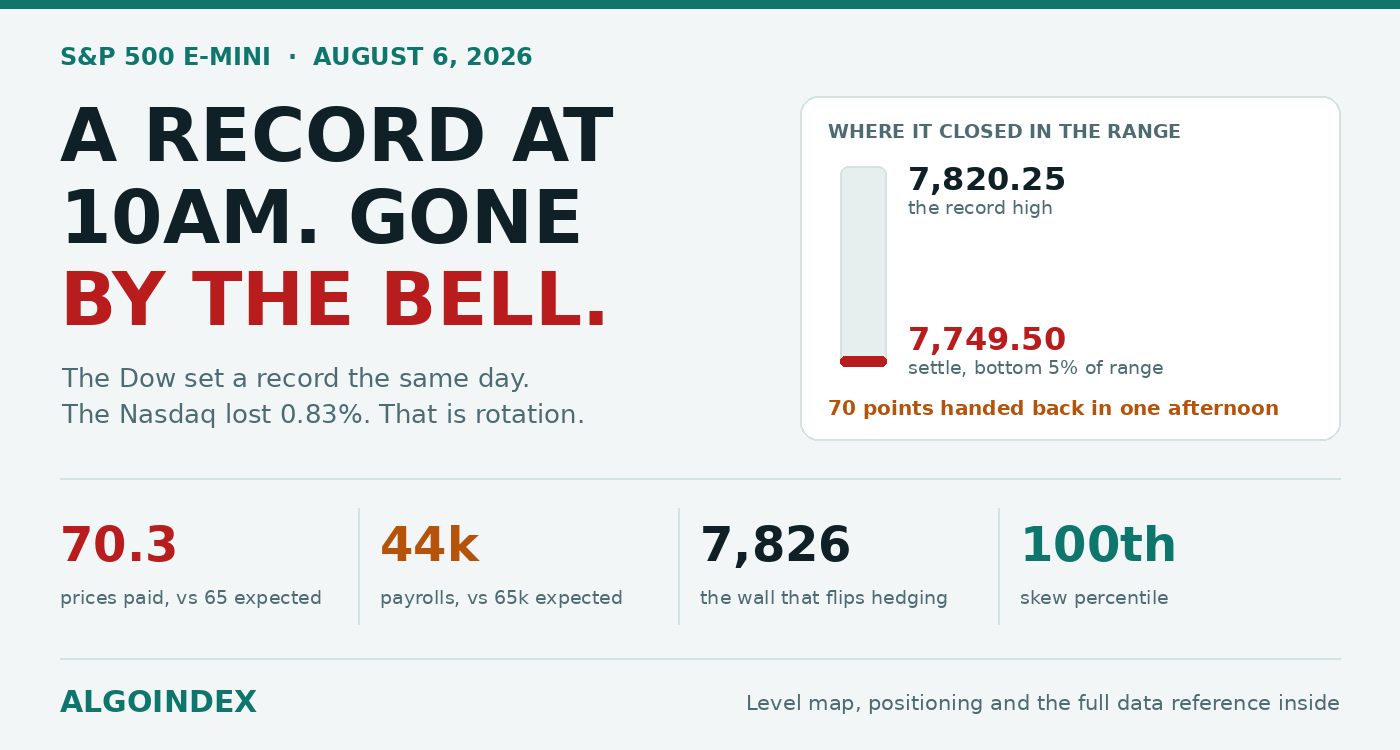
The E-mini printed an all-time high of 7,820.25 on Wednesday morning and finished the day 70 points beneath it, settling 7,749.50. That same session, the Dow finished at a record of its own. The Nasdaq lost 0.83 per cent. Three indices, three completely different afternoons.
That spread is the story, and it decides how much weight Wednesday's rejection actually deserves.
The number that decided it
Yesterday the entire constructive case rested on one line: the services prices-paid figure, forecast at 65 after 67.7.
It printed 70.3, five and a half points hot.
Alongside it, private payrolls printed 44,000 against a 65,000 forecast and 98,000 had come before. The services employment sub-index fell to 47.4, into outright contraction, against 51.2 expected. The headline services index, though, stayed in expansion at 54.1, and both composite and services purchasing surveys beat.
Growth holding, hiring failing, input costs climbing again. Markets have no comfortable way to price that combination.
Then at 16:05 a sitting governor put inflation threats above job-market concerns, and that room to postpone disinflation is running out. The same remarks were explicitly two-sided, allowing that a rate increase might still prove unnecessary, that policy has not cost significant jobs, that the labour market is holding up. Quote only the hawkish half and you overstate it. What genuinely changed is that further tightening stopped being unthinkable, which follows a July vote already carrying three dissents for a 25 basis-point increase.
Rotation, not retreat
Here is why the bearish read has a ceiling. The Dow gained 0.49 per cent to a record. The broad benchmark lost 0.17. The Nasdaq lost 0.83. Spread those apart and you get 1.32 percentage points in a single session, which is money moving rather than money leaving.
Capital walked out of long-duration technology and got redeployed elsewhere. A chip designer fell roughly 7 per cent after third-quarter sales guidance came in under what the AI capital-expenditure crowd had assumed. Semiconductors followed it down. An aerospace and satellite name lost more than 13 per cent on projected AI spending.
Meanwhile a travel-booking platform gained over 6 per cent on gross bookings, and an e-commerce marketplace beat on every line, 1.60 against 1.51 on earnings, revenue of 3.13 billion where 3.02 billion was expected, with guidance above consensus.
In a real risk-off session, the Dow doesn't set a record. So the E-mini, carrying far less technology than the Nasdaq and far more than the Dow, sat between them: damaged, then cushioned by where the money went. Extending the downside from here requires the selling to spread past semiconductors. If technology steadies on Thursday while the Dow holds, this index reverts higher almost mechanically.
A poor close is not a broken structure
Wednesday settled in the bottom 5 per cent of its range, three and three-quarter points off the low. Supply did not just appear at the highs, it stayed all afternoon.
One qualification changes the reading materially. That 7,745.75 low came in a full 116.75 points clear of where Tuesday bottomed. So Wednesday delivered a higher high, a low above the last one, and an ugly finish, not an outside day and not an engulfing reversal. The swing sequence running from the 29 July low at 7,324.00 is undamaged.
For that to change you would need 7,745.75 broken decisively, and then acceptance under 7,706.70, the point at which dealer hedging goes mildly pro-cyclical. Until both of those happen, Wednesday reads as one distribution bar inside an uptrend.
The run into it was remarkable, incidentally: 496.25 points, 6.78 per cent, in five sessions off the July low, and not one down day arrived until Wednesday.
Stretched, and no longer accelerating
Price sits 195.16 points above the 20-day, about 2.58 per cent, call it two average daily ranges apart. Stretches like that resolve by pausing sideways, or by reverting. They don't often add another leg without resting.
Every lookback shows stochastics deeply overbought, and on the 9-day the %K has crossed under %D at 89.69 versus 91.27, the run's first negative cross. Nine-day relative strength at 70.04 sits right on the conventional threshold and fell 1.32 points on the session.
None of that's a sell signal by itself. Overbought stays overbought inside a strong trend. It does say the momentum tailwind has stopped strengthening.
And the trend measure argues for restraint on the short side. Nine-day directional strength reads 34.02, positive direction 31.19 against negative 12.82. Selling into a reading above 30 makes the trade counter-trend by definition. Size it that way, and manage it that way.
The volatility configuration
This is the most informative thing in tonight's data. Implied volatility rank sits at 20.05 per cent, near the bottom of its annual range. Skew rank sits at 100.00, the very top.
September options carry 13.94 per cent implied at 43 days. One-month implied on cash reads 13.45 where realised over the same window is 14.47, so protection costs less than the index has been delivering. Call skew in the major proxies sits at the 98th percentile, a product of the recent price-up-and-volatility-up stretch.
Traders bidding up convexity on the upside at a record high, while holding outright volatility on the cheap, is a setup that has historically pointed toward reversion rather than acceleration.
One further detail. The volatility index fell about 4 per cent to near 15.8 on a session where the underlying reversed off its record. Falling volatility into that kind of session is not a warning, it confirms that Wednesday got treated as rotation and not as the opening of a drawdown.
What sits above and below
The band that matters overhead runs 7,798 to 7,826.70. Inside it sit an options magnet at 7,801.70 carrying 99.41 probability, a first computed resistance of 7,797.92, Wednesday's record and rejection at 7,820.25, the single highest-probability magnet on the entire board at 7,824.70, and the call-side dealer wall at 7,826.70.
That wall is the number to watch. Above it, dealer hedging stops suppressing rallies and starts chasing them.
Beneath, that first shelf is a tight one. An options magnet at 7,755.70, the settle at 7,749.50, the modelled move's lower bound sitting on 7,747, and 7,745.75 for Wednesday's low. Four references inside ten points. Wednesday's low already defended that modelled boundary once, holding it to within two points, so the modelling has stayed properly calibrated right through this move. A second successful defence would favour continuation strongly.
Deeper, 7,721 to 7,726.70 packs four independent methods into six points and is the natural first objective for any short. Then 7,706.70, the structural line, where a corrective pullback would get reclassified as something more serious.
How to trade it
Fade strength, don't short weakness. Scale into 7,798 to 7,826 rather than committing everything the first time 7,798 trades. The best fill comes from a push up into 7,820 or 7,826 that fails and cannot stay above the wall.
Stop 7,849, sitting clear of the magnet at 7,848.70 and of 7,846.33 where a second computed resistance sits, so invalidation lands beyond the next real supply layer rather than at some arbitrary distance. Average in at 7,812 and you are risking 37 points. Take a third at 7,749.50, a third at 7,723.42 inside the confluence, and and run the last third at 7,697.33, valid only on a morning that trends instead of chopping. Roughly 1.7, 2.4 and 3.1 to one.
The breakout trade is the mirror. Acceptance above 7,826.70 inverts the hedging to pro-cyclical, and the long entry is a retest of 7,827 to 7,842 with a stop at 7,796, targeting 7,846.33, then 7,872.42, then 7,881.48.
Two things to respect. As of 28 July, fast-money accounts carried 297,476 contracts net short and had already cut it by 16,259 that week, so covering was under way before the advance even accelerated. A short that size under a market making records is fuel. And a signed Hormuz agreement would invalidate a short position instantly regardless of what the chart says, just as and a visible collapse in those talks pulls the foundation out from under the whole five-session advance.
Why Thursday is quiet, and why that matters
There isn't a first-order American release. Claims at 08:30 carry more weight than usual after Wednesday's payroll miss and the contraction in services employment, because a third consecutive labour disappointment would harden the cooling narrative directly into Friday.
The under-appreciated line is unit labour costs, forecast 2.1 per cent against 1.8. After Wednesday's prices-paid acceleration, an upside surprise there extends precisely the rate repricing that pushed money out of duration. A soft print removes it.
Beyond that, Thursday is about positioning into Friday's payrolls, forecast 80,000 after 57,000. Sessions like that compress ranges and drag price into heavy options concentration instead of trending. The pinning strike at 7,778.70 is where that gravity points.
A record given back in one afternoon looks decisive on a chart. Wednesday still made a higher high, and its low held above Tuesday's. Trade the band, not the narrative.
Yesterday this index closed at a record and the whole case rested on one number. That number came in hot: ES / S&P 500: a record on loan.The complete data picture
Every number behind Friday’s plan, charted first; the full numeric reference follows underneath.
Full numeric reference , every remaining figure from the review
Full data reference
Every figure behind the analysis above. ES September contract, session of Wednesday 5 August 2026, prepared for Thursday 6 August. Futures points unless marked.
| Reference | Value |
|---|---|
| Contract | September 2026 S&P 500 E-mini, ESU26 |
| Settlement | 7,749.50, down 16.00 or 0.21 per cent |
| Open | 7,772.00, a 6.50-point gap above Tuesday's settle |
| All-time high | 7,820.25, exceeding Tuesday's 7,786.00 by 34.25 |
| Session low | 7,745.75 |
| Total range | 74.50 points |
| Closing range | 5.0 per cent, settle 3.75 off the low |
| Range against the 14-day average | roughly 76 per cent of 98.86 |
| Cash benchmark | down 0.17 per cent near 7,724 |
| Dow | up 0.49 per cent, a record |
| Nasdaq-100 | down 0.83 per cent at 29,543.78 |
| Dow to Nasdaq spread | 1.32 percentage points |
| Open interest | 2,078,301 contracts |
| Basis to cash | approximately 26.7 points |
| Reference | Value |
|---|---|
| Reopen | 7,756.75, held as the low |
| High | 7,770.75 |
| Trading near | 7,769.00 |
| Volume | roughly 4,150 contracts |
| Position | above the settle, pressing the computed pivot |
| Session | Open / high / low / close |
|---|---|
| Wed 5 Aug | open 7,772.00, high 7,820.25, low 7,745.75, close 7,749.50, minus 16.00 or 0.21 per cent |
| Tue 4 Aug | open 7,631.00, high 7,786.00, low 7,629.00, close 7,765.50, plus 137.25 or 1.80 per cent |
| Mon 3 Aug | open 7,550.00, high 7,637.75, low 7,542.75, close 7,628.25, plus 109.00 or 1.45 per cent |
| Fri 31 Jul | open 7,479.50, high 7,541.00, low 7,427.50, close 7,519.25, plus 46.75 or 0.63 per cent |
| Thu 30 Jul | open 7,338.00, high 7,498.00, low 7,331.00, close 7,472.50, plus 121.25 or 1.65 per cent |
| Wed 29 Jul | open 7,464.00, high 7,501.00, low 7,324.00, close 7,351.25, minus 114.00 or 1.53 per cent |
| Advance off the 29 July low | 496.25 points, 6.78 per cent, in five sessions |
| Reference | Value |
|---|---|
| 5-day | plus 287.00 or 3.84 per cent |
| One-month | plus 168.00 or 2.21 per cent |
| Year-to-date | plus 766.50 or 10.96 per cent |
| 52-week | plus 1,184.00 or 18.01 per cent |
| 52-week high | 7,820.25, set Wednesday |
| 52-week low | 6,401.75, from 31 March |
| Above the annual low | 21.05 per cent |
| Below the annual high | 0.90 per cent |
| New 52-week highs in a year | 49, four in the past five sessions |
| One-month low | 7,324.00 |
| 13-week low | 7,292.25 |
| Reference | Value |
|---|---|
| Computed pivot | 7,771.83 |
| Options magnet, 99.33 | 7,778.70, cash 7,752 |
| 1st computed resistance | 7,797.92 |
| Options magnet, 99.41 | 7,801.70, cash 7,775 |
| Record high and rejection | 7,820.25 |
| Options magnet, 99.87 | 7,824.70, cash 7,798, the highest on the board |
| Call-side dealer wall | 7,826.70, cash 7,800 |
| Computed target price | 7,841.47 |
| 2nd computed resistance | 7,846.33 |
| Options magnet, 99.32 | 7,848.70, cash 7,822 |
| Top of the modelled move | 7,870.00 |
| 3rd computed resistance | 7,872.42 |
| Options magnet, 99.08 | 7,879.70, cash 7,853 |
| 1 deviation | 7,881.48 |
| Where 14-day strength reaches 70 | 7,894.27 |
| Options magnet, 99.73 | 7,925.70, cash 7,899 |
| 2 deviations | 7,936.14 |
| Reference | Value |
|---|---|
| Options magnet, 97.43 | 7,755.70, cash 7,729 |
| Wednesday settlement | 7,749.50 |
| Lower bound of the modelled move | 7,747 |
| Wednesday's low | 7,745.75 |
| First desk support equivalent | 7,726.70, cash 7,700 |
| Options magnet, 97.89 | 7,724.70, cash 7,698 |
| 1st computed support | 7,723.42 |
| 14-3 day stochastic 80 level | 7,721.00 |
| The structural line | 7,706.70, cash 7,680 |
| Beneath the line | 7,701.70, cash 7,675 |
| 2nd computed support | 7,697.33 |
| 5-day average | 7,684.40 |
| 14-3 day stochastic 70 level | 7,671.38 |
| 3rd computed support | 7,648.92 |
| 14-day %K stall | 7,632.05 |
| 38.2 per cent off the 4-week high | 7,630.68 |
| Deepest desk support | 7,626.70, cash 7,600 |
| 38.2 per cent off the 13-week high | 7,618.55 |
| 1 deviation of support | 7,617.52 |
| Volatility inflection | 7,546.70, cash 7,520 |
| Weekly low | 7,542.75 |
| Dealer gamma flip | 7,489.70, cash 7,463 |
| Put-side dealer wall | 7,426.70, cash 7,400 |
| Reference | Value |
|---|---|
| 5-day | 7,684.40, spot 65.10 above |
| 20-day | 7,554.34, spot 195.16 above, 2.58 per cent |
| 50-day | 7,544.55, spot 204.95 above |
| 100-day | 7,318.61, spot 430.89 above |
| 200-day | 7,155.42, spot 594.08 above |
| Year-to-date | 7,214.49, spot 535.01 above |
| 20-day to 50-day gap | 9.79 points |
| 9-day crossing | 7,549.97 |
| 18-day crossing | 7,537.88 |
| 40-day crossing | 7,525.94 |
| Reference | Value |
|---|---|
| 9-day | raw 87.76 per cent, %K 89.69, %D 91.27, strength 70.04 |
| 14-day | raw 87.76 per cent, %K 89.69, %D 89.25, strength 64.56 |
| 20-day | raw 87.76 per cent, %K 89.69, %D 89.25, strength 61.48 |
| 50-day | raw 88.49 per cent, %K 90.31, %D 85.91, strength 57.81 |
| 100-day | raw 95.72 per cent, %K 96.42, %D 95.29, strength 56.34 |
| Relative strength change | down 1.32 on the session |
| Reference | Value |
|---|---|
| 9-day | index 34.02, positive 31.19, negative 12.82, historic volatility 15.36 per cent |
| 14-day | index 23.73, positive 25.59, negative 15.24, historic volatility 14.79 per cent |
| 20-day | index 17.33, positive 22.75, negative 16.68, historic volatility 13.83 per cent |
| 50-day | index 9.24, positive 20.41, negative 19.51, historic volatility 14.37 per cent |
| Multi-indicator composite | 100 per cent buy, all thirteen components aligned |
| Composite yesterday | 100 per cent buy |
| Composite one week ago | 32 per cent sell |
| Composite one month ago | 48 per cent buy |
| Reference | Value |
|---|---|
| 9-day true range | 97.66, 1.26 per cent; daily range 107.28, 1.38 per cent |
| 14-day true range | 97.89, 1.26 per cent; daily range 98.86, 1.27 per cent |
| 20-day true range | 97.90, 1.26 per cent; daily range 92.53, 1.19 per cent |
| 50-day true range | 95.68, 1.23 per cent; daily range 99.17, 1.28 per cent |
| One-ATR band | 7,651.61 to 7,847.39 |
| Modelled one-day move | 0.79 per cent, roughly 61 points, band 7,689 to 7,810 |
| September options implied volatility | 13.94 per cent at 43 days |
| One-month implied, cash | 13.45 per cent |
| One-month realised, cash | 14.47 per cent |
| Implied volatility rank | 20.05 per cent |
| Skew rank | 100.00 per cent |
| Call skew in the proxies | 98th percentile |
| Volatility index | near 15.8, down about 4 per cent |
| Volatility-of-volatility index | near 90.4, down about 2 per cent |
| Fixed-strike implied | down roughly 0.2 to 1.5 points across most strikes |
| Reference | Value |
|---|---|
| Private payrolls | 44,000 against 65,000 expected and 98,000 prior |
| Services employment sub-index | 47.4 against 51.2 expected |
| Services prices paid | 70.3 against 65 expected and 67.7 prior |
| Services headline | 54.1 against 54.5 expected |
| Composite purchasing survey | 54.5 |
| Services purchasing survey | 54.6 |
| Crude inventories | build 2.479 million against an expected 1.5 million draw, prior 7.167 million draw |
| Gold | up 4 per cent, around 4,247 |
| Silver proxy | up 4 per cent |
| Dollar-yen | recovered toward its 200-day near 158 |
| Reference | Value |
|---|---|
| Commercials | long 1,429,304 (+41,781), short 1,525,233 (+30,791), net short 95,929 |
| Non-commercials | long 257,703 (+1,553), short 274,899 (+1,965), net short 17,196 |
| Dealers and intermediaries | long 166,101 (+17,117), short 923,295 (+41,446), net short 757,194 |
| Asset managers | long 1,159,241 (+15,518), short 214,471 (-93), net long 944,770 |
| Fast-money funds | long 155,964 (+9,130), short 453,440 (-16,259), net short 297,476 |
| Other reportables | long 49,486 (-2,788), short 52,711 (+3,305), net short 3,225 |
| Path | Probability and description |
|---|---|
| Path A, fade and rotate lower | 45 per cent. Tests 7,798 to 7,826, fails above the wall, rotates through the pivot to the 7,745 to 7,749 shelf with extension into 7,721 to 7,726. Settles 7,720 to 7,760 |
| Path B, range and chop | 30 per cent. Neither 7,798 nor 7,745 resolves, the 7,778.70 strike pins the action. Settles 7,755 to 7,790 |
| Path C, breakout and new record | 25 per cent. Through 7,826.70 with acceptance, hedging inverts, extends to 7,841 and 7,846 with 7,872 available. Settles above 7,830 |
| Reference | Value |
|---|---|
| Entry zone | 7,798 to 7,826, scaling in |
| Preferred fill | a failed push into 7,820 to 7,826 |
| Stop | 7,849 |
| Risk from a 7,812 average | 37 points |
| Target 1 | 7,749.50, 62.5 points, roughly 1:1.7, take one third |
| Target 2 | 7,723.42, 88.6 points, roughly 1:2.4, take one third |
| Target 3 | 7,697.33, 114.7 points, roughly 1:3.1, runner |
| Reference | Value |
|---|---|
| Trigger | acceptance above 7,826.70 |
| Entry zone | 7,827 to 7,842 on the retest |
| Stop | 7,796 |
| Targets | 7,846.33, then 7,872.42, then 7,881.48 |
| Time | Event |
|---|---|
| 02:00 | German industrial orders, 0.5 per cent against 1.9 prior |
| 03:00 | Swiss unemployment adjusted, 3.1 per cent against 3.1 |
| 04:00 | Italian industrial production, 0.3 per cent against minus 0.3 |
| 04:30 | UK construction survey, 40 against 38.4 |
| 05:00 | Eurozone retail sales, 1 per cent annual against 1.6; 0.1 per cent monthly against 0.2 |
| 08:30 | Initial claims 205,000 against 197,000 |
| 08:30 | Continued claims 1.7895 million against 1.782 million |
| 08:30 | Productivity preliminary 0.6 per cent against 0.3 |
| 08:30 | Unit labour costs preliminary 2.1 per cent against 1.8 |
| 10:00 | Wholesale inventories revised, 0.3 per cent against 0.3 |
| 17:30 | A Federal Reserve speaker, after the close |
| 19:30 | Japanese household spending, 0.9 per cent annual against minus 0.4 |
| Reference | Value |
|---|---|
| Friday 08:30 | Payrolls 80,000 against 57,000 prior |
| Friday 08:30 | Private payrolls 80,000 against 49,000 prior |
| Friday 08:30 | Unemployment unchanged at 4.2 per cent |
| Friday 08:30 | Average earnings 3.5 per cent annual, 0.3 per cent monthly |
| Bank preview | payrolls at 80,000, private payrolls at 95,000 |
| Thursday after the close | no significant mega-cap earnings scheduled |
| Residual item | a storage manufacturer down roughly 4 per cent inside a 13 per cent implied move |
| Reference | Value |
|---|---|
| Chip designer | down roughly 7 per cent on third-quarter sales guidance |
| Aerospace and satellite name | down more than 13 per cent, target cut to 235 from 255 |
| Travel-booking platform | up more than 6 per cent on gross bookings |
| E-commerce marketplace | adjusted earnings 1.60 against 1.51; revenue 3.13 billion against 3.02 billion; merchandise volume 22.4 billion against 21.57 billion |
| Hyperscaler disclosure | a single model developer is roughly 70 per cent of its AI revenue, 24.1 billion in fiscal 2026 |
| Storage manufacturer | customer short-put positioning flagged in the 1,000 to 1,300 area |
| Polysilicon policy | tariffs and price supports discussed at a level of at least 15 per cent |
| Reference | Value |
|---|---|
| Call-side wall | cash 7,800, E-mini 7,826.70 |
| Primary gamma concentration strike | cash 8,000, E-mini 8,026.70 |
| Modelled one-day move high | cash 7,843.33, E-mini approximately 7,870 |
| Modelled one-day move low | cash 7,720.37, E-mini approximately 7,747 |
| Risk pivot | cash 7,680, E-mini 7,706.70, raised Wednesday |
| Volatility inflection | cash 7,520, E-mini 7,546.70 |
| Dealer gamma flip | cash 7,463, E-mini 7,489.70 |
| Put-side wall | cash 7,400, E-mini 7,426.70 |
| Aggregate state | net long, still dampening realised movement |
| Total notional, cash index | 1.347 billion |
| Positioning tilt | 1.566 |
| Composite positioning index | 5.56 |
| Call-side positioning | 1.06 billion |
| Put-side positioning | negative 7.71 billion |
| Put to call open interest | 1.26 |
| Modelled option-implied move | 65.69 index points |
| Modelled five-day move | 1.56 per cent |
| Heaviest positioning expiry | Wednesday itself |
| Heaviest delta expiry | February 2027 |
| One-month correlation | back below 8, where hedging becomes attractive |
| Desk guidance | flatten some longs, consider short-dated downside at cash 7,775, E-mini about 7,801.70 |
| Desk edition published | 17:23 ET, 5 August |
| Reference | Value |
|---|---|
| Broad index customer delta | roughly positive 2 billion |
| Composition | about 5 billion of put selling against 3 billion of call selling |
| Dominant expiry | same-day contracts, premium harvesting |
| Technology index | roughly negative 3 billion, mostly longer-dated call selling |
| Discrete event | an approximately 15,000-lot customer long same-day 7,850-strike call closed near 12:00 ET |
| Options magnets nearest price | 7,824.70 (99.87), 7,801.70 (99.41), 7,848.70 (99.32), 7,778.70 (99.33), 7,879.70 (99.08), 7,755.70 (97.43), 7,724.70 (97.89) |
| Dense strike zone | between 7,778 and 7,850, resistance by attraction |
| Reference | Value |
|---|---|
| Claims threshold | stand aside on a print above 235,000 or below 180,000 |
| Fast-money short base | nearly 300,000 contracts, squeeze fuel |
| Paired average band | the 7,544 to 7,554 zone reached together on any real pullback |
| Entry band lower boundary | around 7,799 where the desk referenced trimming longs |
| Swiss policy guidance | rate held at zero through the end of 2027 |
| Realistic full-session envelope | 7,700 to 7,830, with the middle 60 per cent inside 7,745 to 7,800 |
| Realised range stability | near 97 to 98 points, or 1.26 per cent, across every lookback |
| AI governance item | a chief scientist of 27 years departing one mega-cap platform to found a company |
| Data capture window | 18:35 to 19:00 ET, all ten required sources verified |



