Of all the numbers on gold's screen this morning, one matters more than the rest: 4,497.6. That is the 200-day moving average, the single most important longer-term reference on the board, and the front-month contract is trading almost exactly on top of it near 4,496 to 4,500. Overnight, price probed down to 4,450.1, reversed firmly to tag 4,511.2, and settled back onto the line into the pre-open, up roughly 0.65 percent from the 4,466.9 settle. Bulls are defending the last major structural level beneath price. Bears still own every shorter average overhead.
That is the entire session in one sentence, and it comes after a bruising stretch: the five-day change is still negative at about 0.84 percent and the trailing twenty-day window is down close to five percent, so today's strength is a relief move off support, not a fresh trend leg. A softer United States core inflation print, 0.4 percent monthly against a 0.5 percent expectation, eases the rate pressure on a non-yielding asset, and Middle East headlines keep an uneven safe-haven undertone beneath the metal. But the deciding input arrives tomorrow morning, when the monthly employment report sets the dollar and real-yield path that gold ultimately trades against.
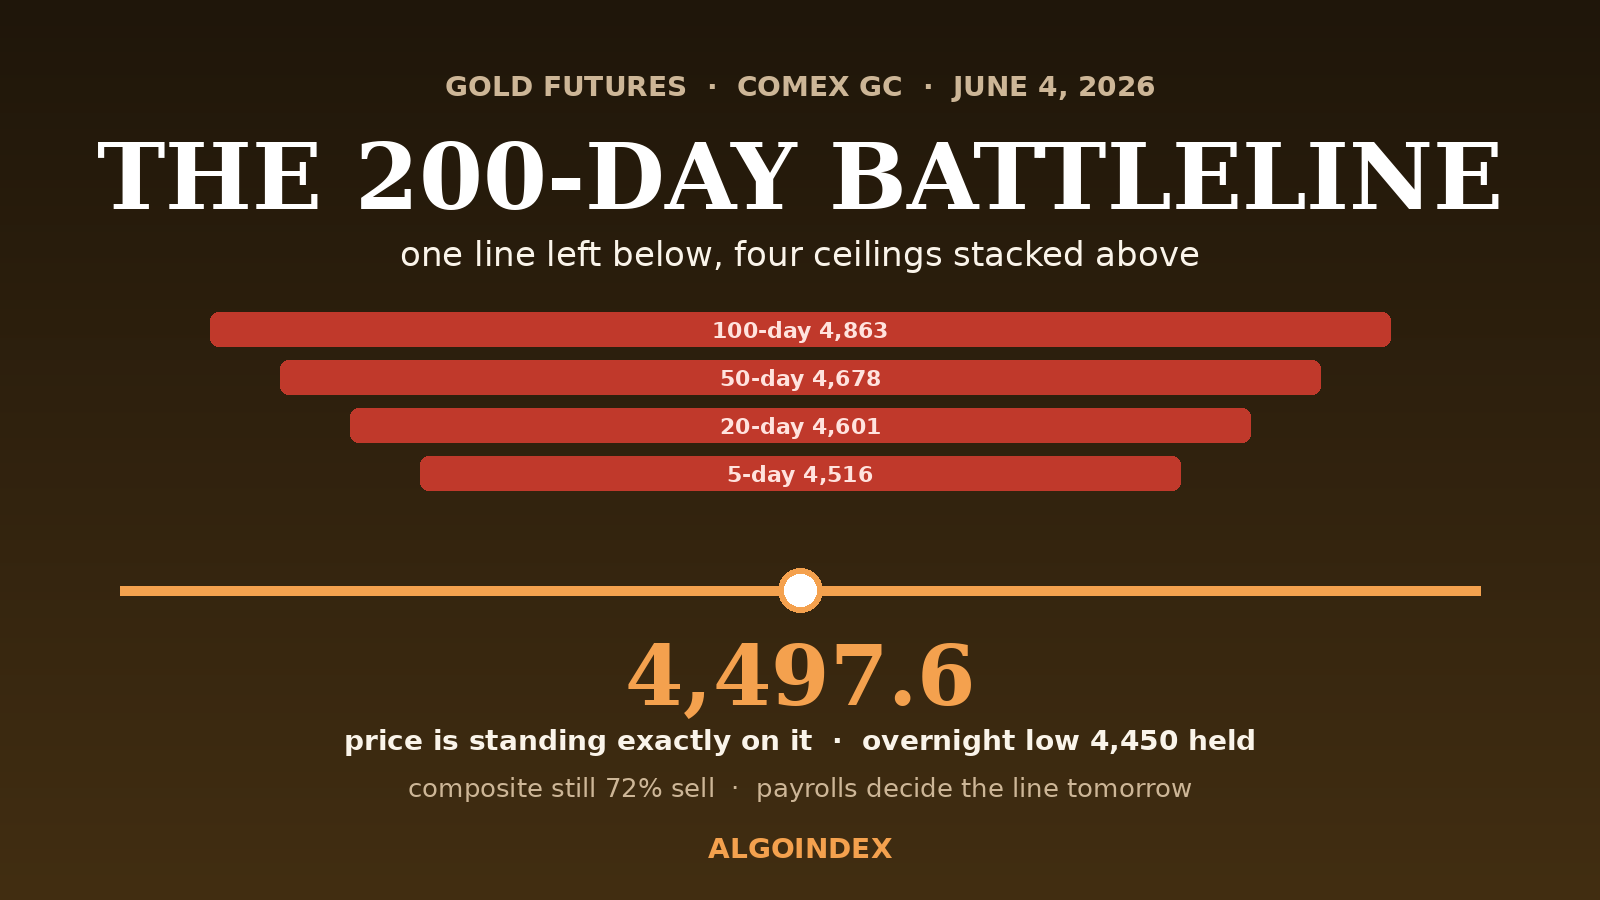
The Battleline at 4,497.6
Location is the morning's whole technical argument. Every shorter average sits stacked overhead like a ceiling: the 5-day at 4,516.1, the 20-day at 4,601.2, the 50-day at 4,678.5, the 100-day at 4,863.1, with the year-to-date mean at 4,845.3 far above. Beneath price there is exactly one structural line left, and price is standing on it. Holding the 200-day separates a routine pullback inside a multi-year uptrend from a deeper unwind; losing it, along with the 4,482 daily pivot just below, hands the bears the last reference the bulls own.
Two Horizons, Two Different Markets
Zoom out and gold is still a strong multi-year uptrend in a pullback: the 52-week high at 5,706 sits about 21 percent overhead, the 52-week low at 3,439.5 roughly 31 percent below, and official-sector accumulation remains the slow structural tailwind under the whole arc. Zoom in and the picture is plainly defensive: the multi-indicator composite reads a decisive 72 percent sell, the 14-day directional index shows downside in control at 23.5 over 12.5, and the twenty-day window has shed close to five percent. The honest description is a long-term bull market whose intermediate trend is corrective, which is why today's long is framed as a bounce off a major support base and not a trend trade against the bearish composite.
The Oversold Spring Beneath the Bounce
Momentum is the bull's near-term ally. Relative strength sits below the midline across every horizon, 39.6 on the 9-day, 40.3 on the 14-day, 41.7 on the 20-day, weak but not yet at washed-out extremes, while the 14-day stochastic has compressed into the high-20s-to-low-30s zone from which short-term bounces typically launch, and it is curling. Positioning has cooled along with price: a weighted-alpha reading near 21 and relative strength in the low 40s describe a market that has worked off its prior overbought froth. Sentiment is cautious rather than capitulatory, which leaves genuine room for a short-covering bounce if support holds, and just as much room for renewed selling if the line gives way.
What the Macro Scale Is Weighing
The macro inputs split almost evenly, which is why the metal is balancing on a line instead of trending away from it. Supporting the bounce: the softer monthly core inflation print at 0.4 percent trims the immediate pressure on yields, the dollar tone it implies is the cleanest cross-asset support on the board, and the Middle East delivers a steady defensive undertone, with a tentative United States and Iran framework, a possible Lebanon ceasefire within roughly a day, and continued ground activity keeping the picture unresolved. Weighing on it: one-year consumer inflation expectations ticked up to 4.8 percent against 4.6 expected, keeping sticky-expectations concerns alive, the official-sector story offers no fresh intraday catalyst, and the dealer-positioning read from the gold-fund proxy shows put-side gamma dominant with no tight pin at current levels, meaning positioning leaves room for movement in either direction rather than holding price here. Everything nets out to a market waiting on tomorrow's jobs print.
The Climb Overhead, Rung by Rung
If the base holds, the recovery has to earn each level. First the 4,510 to 4,511 daily resistance and overnight high, reinforced by the one-standard-deviation band at 4,514. Then the real test of seller control, the 5-day average and 9-day crossover zone at 4,516 to 4,524. Beyond it, 4,533.7 at two standard deviations, 4,553.1 at the second daily resistance, and the 4,576 to 4,589 average-stall band ahead of 4,581 and the 4,607 half-retracement of the four-week range. Below, the map is just as explicit: the 4,482 pivot and 4,466.9 prior close first, the 4,450.1 overnight low and 4,438.9 shelf next, then the 4,420 to 4,411 layer and the one-month low at 4,395.6, beneath which the corrective extension toward 4,367.8 opens. The 14-day true range of about 105 points frames a broad envelope of roughly 4,391 to 4,601, with most of the day expected to compress well inside it ahead of the data.
The recovery ladder is read bottom-up: each rung must be reclaimed and held before the next is in play.
Paths and the Trade
The base case, roughly 50 percent, holds the 4,482 to 4,497 support base after the open and grinds toward 4,510 then 4,533, capped by positioning caution into the jobs data. The bear case, about 30 percent, loses the 4,466.9 prior close and the 4,450 overnight low and slides into the 4,438 then 4,420 to 4,411 layer. And about 20 percent of the distribution belongs to a headline, a Middle East or rate-path surprise that throws price outside the 4,438 to 4,533 envelope in either direction. The trade follows the structure: a confirmed post-9:45 hold and reclaim of 4,490 to 4,500, ideally with the opening range accepting above the 200-day, buys the bounce with a structural stop beneath 4,448 under the overnight low, targeting 4,510 to 4,516, then 4,533, then 4,553, about one-to-one out to one-to-two-point-one. The mirror short triggers only on a clean rejection of the 4,510 to 4,516 band followed by a loss of 4,466.9. Skip the churn inside 4,470 to 4,500 without confirmation, skip an indecisive opening range around the line, and stand aside into tomorrow's report.
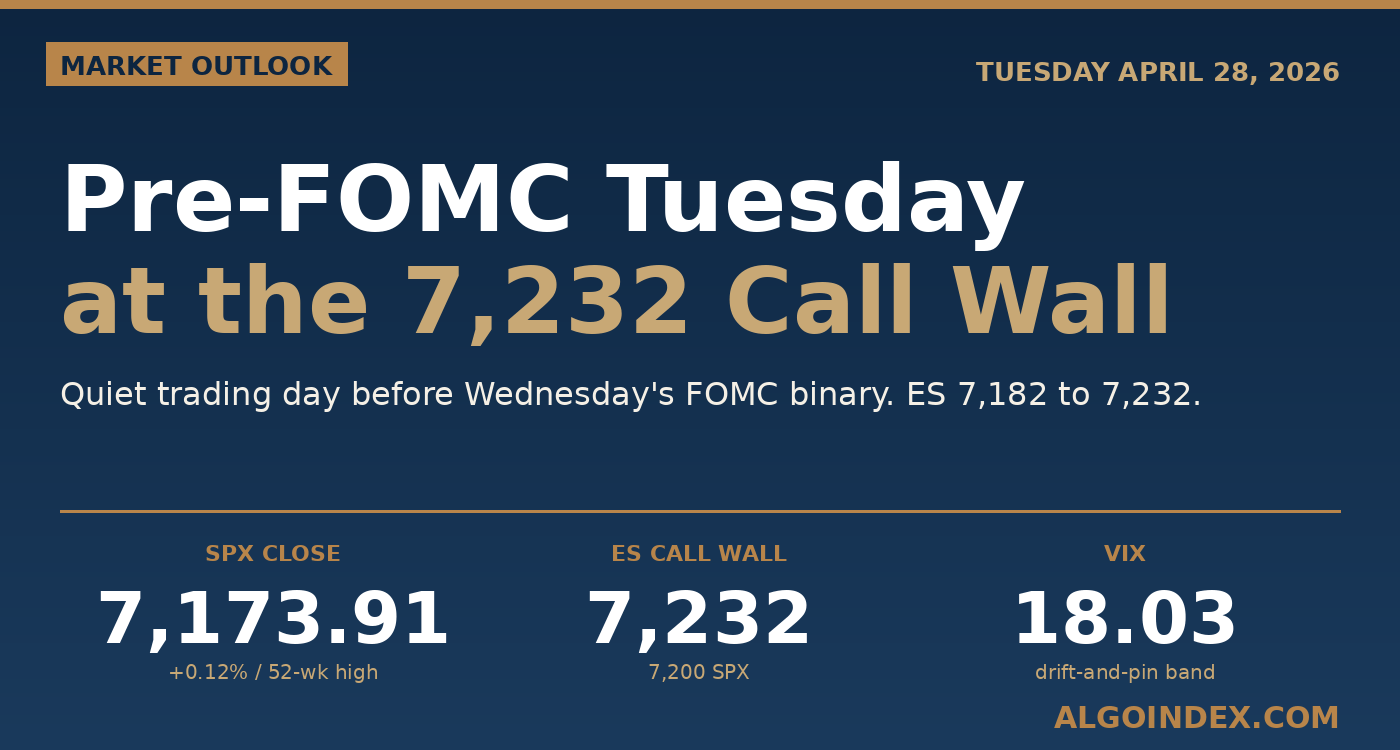
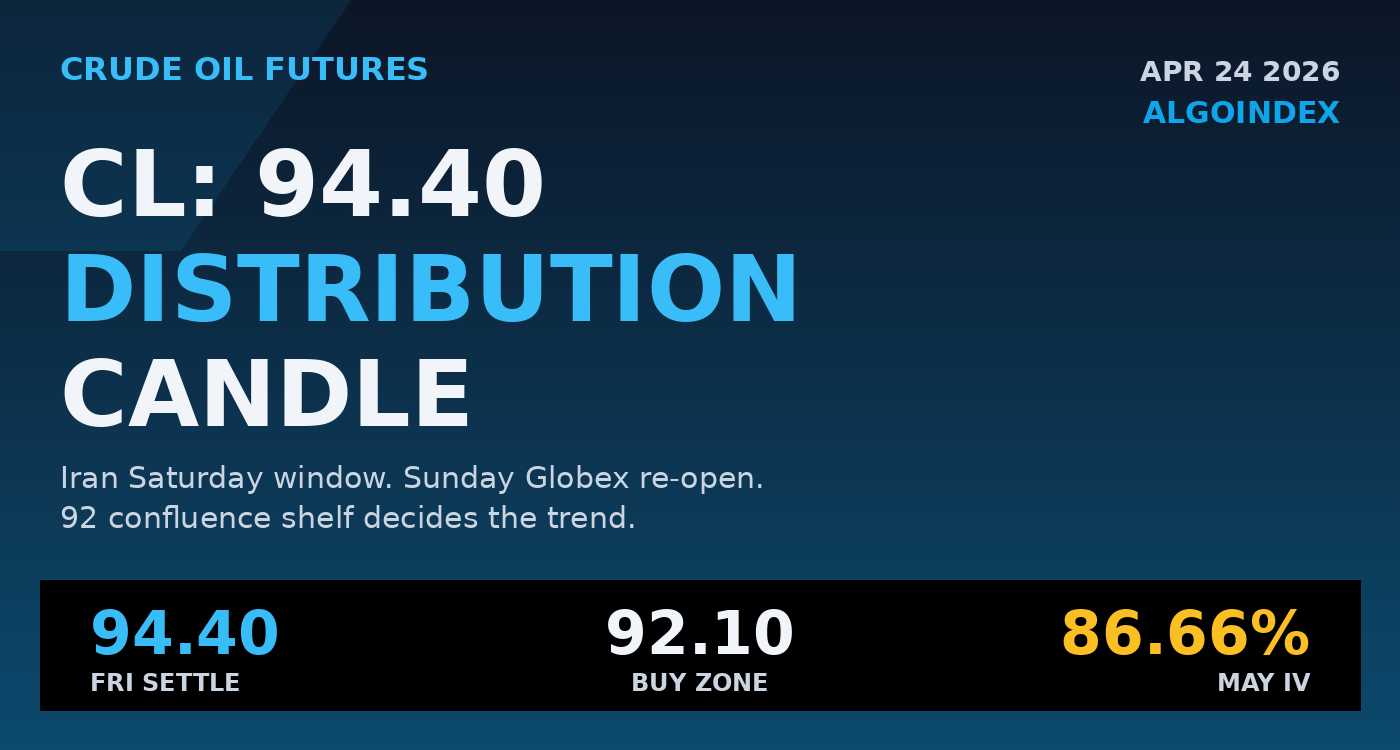
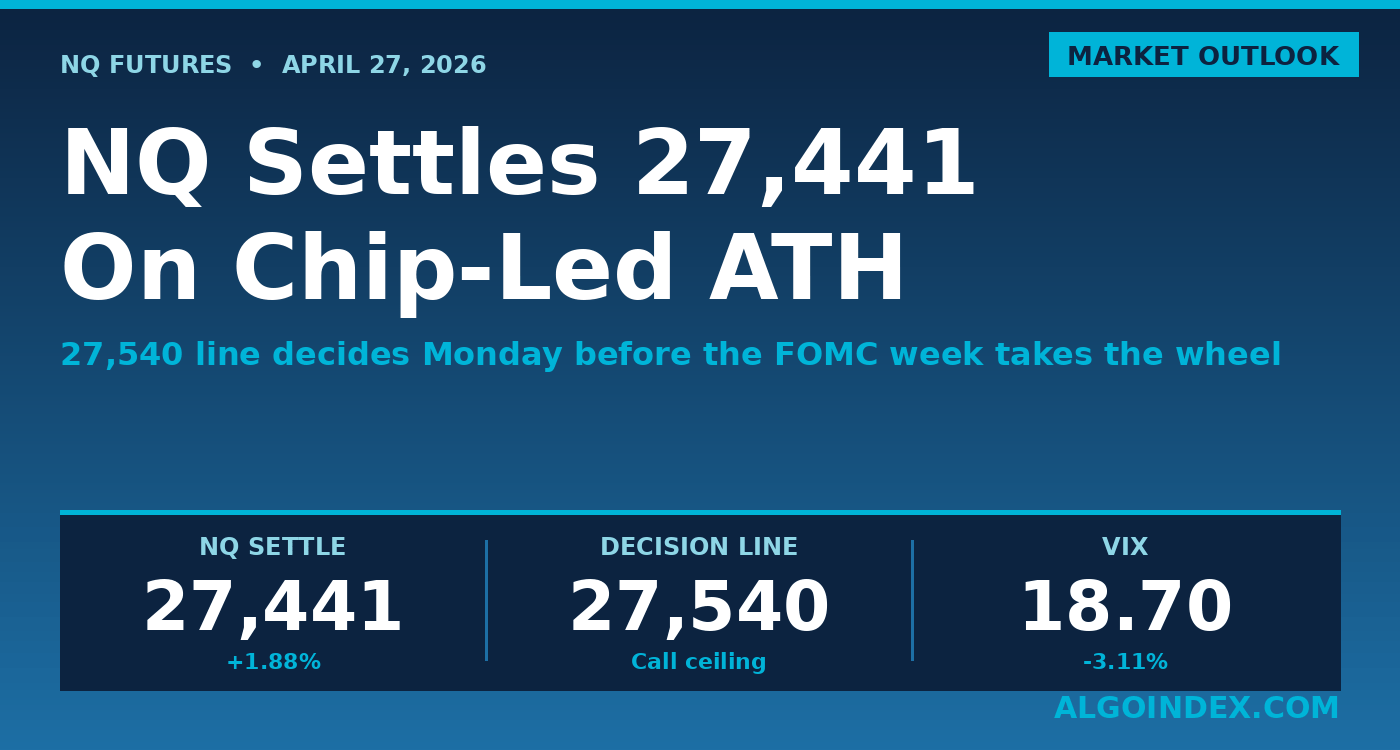
We publish our performance methodology openly so every read can be measured against what it claimed. Today's companion reads cover the dealer cushion under the S&P, the Nasdaq's crowded-trade unwind, and crude's fading war premium, and our framework for reading support and resistance explains why a 200-day defense carries the weight it does.
Markets hand you a clean line like 4,497.6 only a few times a year. Tomorrow's payrolls decide which side of it gold wakes up on.
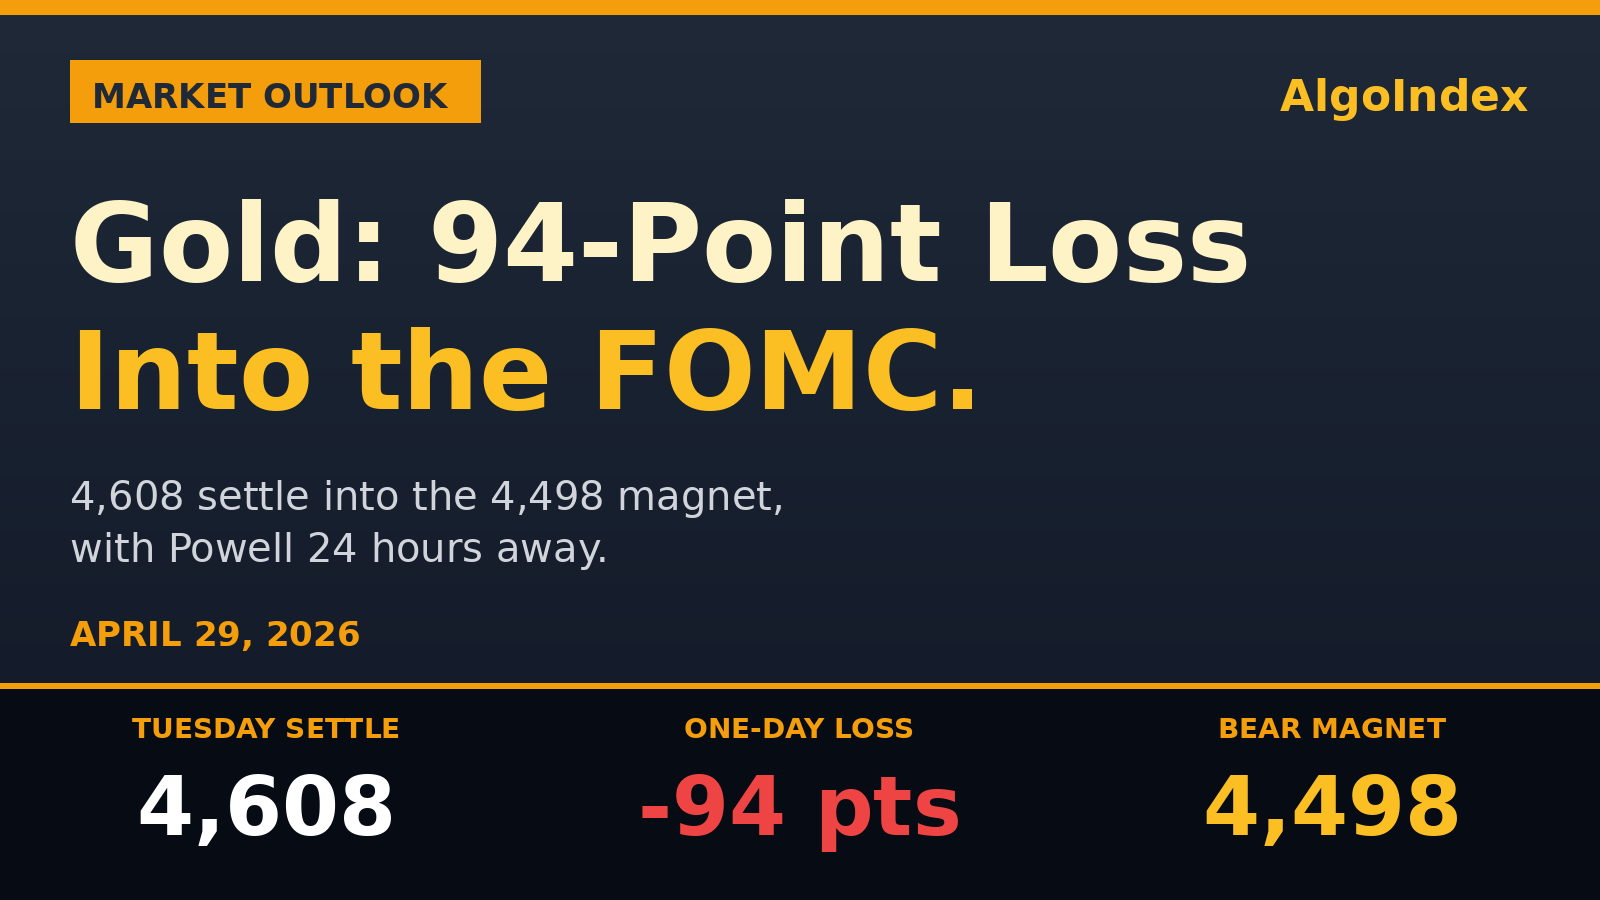
The sequel: by Friday morning, gold was trading under the line.
See how AlgoIndex turns this kind of read into a disciplined daily signal.
View pricing →