At 4,050.2, Friday's high stopped 49.8 points short of 4,100, the bottom of the short band we set for the session. December gold never came near 4,100 to 4,110. It kept falling. The contract marked a low of 3,989.1 and settled at 4,007.9, down 52.5 points or 1.29 percent from Thursday's 4,060.4. The daily bar cannot show which extreme came first.
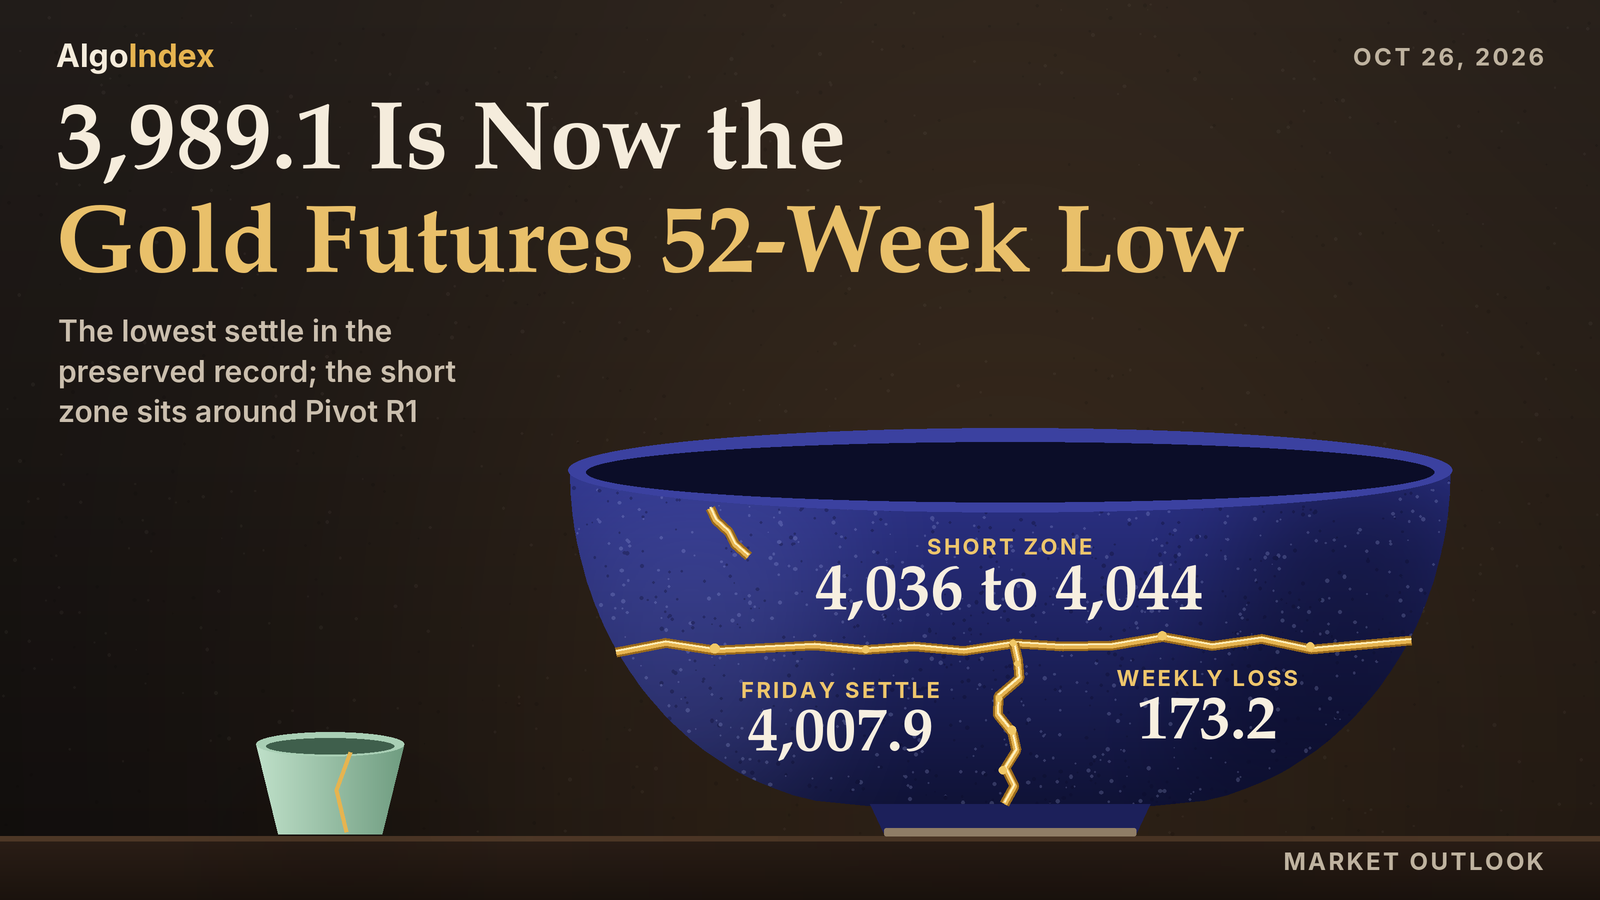
This time the dollar and yields ran with the decline. The dollar index rose to 101.81 from 101.61 and the ten-year yield index to 4.99 percent from 4.95 percent, a combination that in the review's reading weighs on gold. The 3,989.1 low and the 4,007.9 settle are the lowest low and the lowest settle in the provider's record back to 10/13/25. Over the week the contract lost 173.2 points, or 4.14 percent. Monday's primary setup is another short, from 4,036 to 4,044, a band that holds Pivot R1 at 4,042.4. The settle sits 28.1 points beneath it.
December gold settled at 4,007.9, 7.8 points beneath the 4,015.7 Pivot Point and 26.6 above Pivot S1 at 3,981.3. Every settlement average sits above it, from the 5-day at 4,104.2 to the 200-day at 4,609.4. The primary setup for Monday is a short from 4,036 to 4,044, with Pivot R1 at 4,042.4 inside the band, stop 4,062 above Thursday's 4,060.4 settle, targets 4,018, 3,996 and an extended 3,974. The band sits above the market. Target 1 sits 10.1 points above the settle and Target 2 11.9 points beneath it. Negative direction leads on both directional windows and the composite reads "88% SELL". Globex reopens at 6:00 PM ET on Sunday, after a weekend of headline exposure.
Friday's 4,050.2 high stayed 49.8 points beneath the 4,100 to 4,110 short band
In Friday’s outlook we set a short from 4,100 to 4,110, stop 4,128, with targets at 4,082, 4,059 and an extended 4,036. Its status line put the contract at 4,060.4 at the Thursday settle. That left 39.6 points to the band. Friday's bar, from the review and the dated 2026-10-23 row of the provider's daily record, opened at 4,042.2 at the Thursday 6:00 PM ET reopen, 18.2 beneath Thursday's settle. Our Friday outlook had reported the same 4,042.2 open from the provider's overview after the reopen. The bar marked a high of 4,050.2 and a low of 3,989.1 and settled at 4,007.9. The band never traded.
Just under fifty points. That was the gap. The high stopped 49.8 beneath 4,100, 59.8 beneath the band top and 77.8 beneath the 4,128 stop. With the band never reached, the card's acceptance test, two consecutive 30-minute closes above 4,110, never came into play. The settle finished 117.8 points beneath its invalidation line, a settle above two standard deviations resistance at 4,125.7. No fill and no result is asserted.
Two of the card's targets never printed. The whole bar sat beneath them. The 4,050.2 high stopped 31.8 points under the 4,082 first target and 8.8 under the 4,059 second. Only the extended 4,036 traded. It sits between the 4,042.2 open and the 3,989.1 low, and the low went 46.9 beneath it. With the band untouched, that print carries no result for the card. The settle finished 28.1 points beneath the extended target.
Order is the missing piece. No intraday series was kept for Friday. The daily bar fixes the open, the two extremes and the settle, and nothing more. It cannot show whether the high or the low came first, or when either printed, so we make no claim about the path between them.
The path call held its bounds. Our Friday outlook weighted a hold between Pivot S2 at 3,959.7 and Pivot R1 at 4,137.5, with a rebound toward the band that fails beneath two standard deviations resistance at 4,125.7 weighted slightly above a recovery. Both extremes stayed inside. The high sat 87.3 beneath Pivot R1 and the low 29.4 above Pivot S2. Prices never got near the band. The high stopped 37.0 points beneath the 4,087.2 Pivot Point. The outlook's alternative, a renewed safe-haven bid or a further fall in the dollar and yields carrying the contract above Pivot R1 toward Thursday's 4,164.3 high, did not come about.
The range work gave way at the bottom in places. The low went 20.9 points through the 4,010 bottom of the low-range case and 5.9 through the 3,995 bottom of the most likely case. The 3,960 bottom of the high-range case held by 29.1. The tops sat far away. The high stayed 39.8 inside the 4,090 top of the low-range case and 74.8 inside the 4,125 top of the most likely case. Among the published bands, the low went 25.1 through one deviation support at 4,014.2 and 6.0 through two deviations at 3,995.1. Three deviations at 3,980.4 held by 8.7, and the 3,980.5 bottom of the average-true-range envelope by 8.6. The high stayed 56.4 under one deviation resistance at 4,106.6. The four session bands cannot be scored. Each depends on when a price printed, and the daily bar does not say.
The low also went 20.9 points through Pivot S1 at 4,010.0, 41.8 through the published target price at 4,030.9 and 26.5 through the 4,015.6 52-week low that our Friday outlook listed. The macro override named a renewed safe-haven bid on Gulf escalation, or a sharp further fall in the dollar. The dollar index rose instead. The stop never traded. We grade the card as written.
One row anchors the score. The dated 2026-10-23 row of the provider's daily record reads 4,042.2, 4,050.2, 3,989.1 and 4,007.9 on 173,280 contracts. The review states the same prices and volume. Friday's open interest was not yet reported. Thursday's 2026-10-22 row was revised. It now carries 214,607 contracts against the preliminary 202,885 our Friday outlook carried, and open interest of 307,330, which that outlook listed as not yet reported. The review cites the same 214,607 and 307,330 for Thursday.
The 4,036 to 4,044 band, Pivot R1 at 4,042.4 and the 4,015.7 Pivot Point
Resistance starts close. The Pivot Point sits at 4,015.7, 7.8 points above the settle. Thursday's 4,036.8 low sits 0.8 above the band bottom, and the published projection at 4,039.7 sits 0.3 beneath the 4,040 midpoint.
Then the band. Pivot R1 at 4,042.4 sits 2.4 above the midpoint and 1.6 beneath the 4,044 top, with Friday's 4,042.2 open 1.8 beneath that top. Friday's 4,050.2 high sits 6.2 above the band and 11.8 beneath the 4,062 stop. Thursday's 4,060.4 settle sits 1.6 beneath the stop, and the published stochastic projection at 4,065.1 sits 3.1 above it.
Beyond the stop the list thickens. One standard deviation resistance at 4,074.8 and Pivot R2 at 4,076.8 sit 12.8 and 14.8 beyond it. One 14-day average true range above the settle reaches 4,087.1. The published stall projection at 4,098.8, two standard deviations resistance at 4,102.5 and Pivot R3 at 4,103.5 come next, then the 5-day average at 4,104.2 and the 10/14 settle of 4,107.9. A tight knot follows. The 10/21 low of 4,122.3, the 9-day crossing price at 4,122.5 and three standard deviations resistance at 4,123.7 sit within 1.4 points. The 38.2 percent retracement from the four-week low at 4,127.6 sits 119.7 above the settle, with the 9-day average at 4,128.6 just over it. Then the list spreads out. Higher up come the 10/20 low of 4,130.1, the 10/20 settle of 4,142.6, the 10/21 settle of 4,150.0, the 18-day crossing price at 4,151.2, the 20-day average at 4,155.3, the 10/19 low of 4,155.6, the 10/19 settle of 4,160.1, the 10/21 high of 4,160.6 and Thursday's 4,164.3 high. Next sit the 10/16 low of 4,167.5, the 10/15 settle of 4,170.1, the 50 percent retracement of the four-week range at 4,170.4, the 10/20 high of 4,174.9, the 10/13 settle of 4,177.3, the 10/16 settle of 4,181.1, the 10/12 settle of 4,190.6, the 10/19 high of 4,211.2, the 38.2 percent retracement from the four-week high at 4,213.1 and the 10/16 high of 4,220.4. The rest is distant. It takes in the 40-day crossing at 4,275.0, the 38.2 percent retracement from the 13-week low at 4,281.7, the 100-day at 4,286.3, the 09/25 settle of 4,321.2, the 50-day at 4,341.9 and the 4,351.6 one-month high, 343.7 above the settle. Then the 200-day at 4,609.4, the 4,755.0 13-week high and the 5,781.8 52-week high.
Support is close too. The 14-day relative strength projection at 30 percent, 3,996.8, sits 11.1 down. Friday's 3,989.1 low comes next, 18.8 down, and it is also the one-month, 13-week and 52-week low. Nothing in the review sits between that low and Pivot S1 at 3,981.3, 26.6 beneath the settle. A second band follows. The 3-10 day crossover stall level at 3,965.0, the published target price at 3,963.4 and Pivot S2 at 3,954.6, 53.3 down, sit within 10.4 points of each other. One standard deviation support at 3,941.0 and the 3,928.7 average-true-range mark sit beneath. Pivot S3 at 3,920.2, two standard deviations support at 3,913.3 and three standard deviations support at 3,892.1 are the extended band.
Every average sits above the settle. The gaps run 96.3 points to the 5-day at 4,104.2, 120.7 to the 9-day at 4,128.6, 147.4 to the 20-day at 4,155.3, 334.0 to the 50-day at 4,341.9, 278.4 to the 100-day at 4,286.3 and 601.5 to the 200-day at 4,609.4. The 5-day fell 34.6 from 4,138.8. The 10/16 settle of 4,181.1 left its window and Friday's 4,007.9 replaced it. The 20-day fell from 4,170.9 to 4,155.3 as the 09/25 settle of 4,321.2 dropped out, and the 50-day eased from 4,350.1 to 4,341.9. Older settlements explain the order. The 30 older ones in the 50-day window averaged 4,466.3, the 50 older ones in the 100-day window 4,230.8 and the 100 older ones in the 200-day window 4,932.4. Monday's crossing prices are 4,122.5 for the 9-day, 4,151.2 for the 18-day and 4,275.0 for the 40-day.
Momentum sits near the bottom of its scale. Relative strength reads 25.61 on the 9-day, 30.67 on the 14-day and 34.75 on the 20-day. The raw stochastics read 7.98 percent on the 9-day and 7.42 percent on the 14-day. The 14-day %K at 17.98 percent sits beneath %D at 26.43 percent. Sellers lead on direction. On the 9-day, negative direction at 35.27 leads positive at 8.42 with the ADX at 32.77; on the 14-day, 30.04 leads 10.52 with the ADX at 24.63. The 9-day ADX reads above the 14-day. Historic volatility reads 16.19 percent on the 9-day and 16.63 percent on the 14-day. These are the provider's published readings, taken at about 6:21 PM ET on Friday with no session open, so they reflect the Friday settle.
The composite read published for Monday reads "88% SELL", strength "Strong", direction "Strongest", composite indicator "SELL". The short-term and medium-term groups both read "Average: 100% SELL" and the long-term "Average: 33% SELL". History: "88% SELL" yesterday, "48% SELL" last week and "48% SELL" last month. The sell share held.
Friday's range was narrower than Thursday's. Its 61.1 points were 0.87 times the 14-day average daily range of 70.2. The high sat 114.1 beneath Thursday's 4,164.3 and the low 47.7 beneath Thursday's 4,036.8, a lower high and a lower low. The settle at 30.8 percent of the range left a body of 34.3 points beneath the open, an upper shadow of 8.0 above the open and a lower shadow of 18.8 beneath the settle, which sat 42.3 beneath the high. It was a second consecutive lower settle. Session highs over six sessions ran 4,220.4, 4,211.2, 4,174.9, 4,160.6, 4,164.3 and 4,050.2, and session lows 4,167.5, 4,155.6, 4,130.1, 4,122.3, 4,036.8 and 3,989.1.
The 14-day average true range stands at 79.2 points. The 9-day figures are 74.8 for average true range and 67.8 for average daily range, and the 20-day 83.9 and 75.5. One average true range either side of the settle spans 3,928.7 to 4,087.1. The deviation bands are tighter. Built from five settlements, they run 3,941.0 to 4,074.8, 3,913.3 to 4,102.5 and 3,892.1 to 4,123.7. They describe settlement dispersion only, and a weekend headline gap can open outside any of them. Daily ranges over ten sessions ran 64.2, 55.1, 98.5, 76.8, 52.9, 55.6, 44.8, 38.3, 127.5 and 61.1 points. Settlements ran 4,190.6, 4,177.3, 4,107.9, 4,170.1, 4,181.1, 4,160.1, 4,142.6, 4,150.0, 4,060.4 and 4,007.9. Changes ran minus 25.7, minus 13.3, minus 69.4, plus 62.2, plus 11.0, minus 21.0, minus 17.5, plus 7.4, minus 89.6 and minus 52.5. The upper side is far off. The one-month high of 4,351.6, the 13-week high of 4,755.0 and the 52-week high of 5,781.8 frame it. No prior-quarter high or low was captured, so the 13-week extremes serve as the quarterly reference.
A firmer dollar, higher yields and a 1.29 percent fall in gold
Pressure came from the usual places. The dollar index closed at 101.81 in the provider's daily record, up 0.20 from Thursday's 101.61, after trading between 101.85 and 101.49. Yields rose too. The ten-year yield index climbed to 4.99 percent from 4.95 percent and the thirty-year to 5.32 percent from 5.28 percent. In the review's reading a firmer dollar and higher nominal yields both weigh on gold, and Friday's decline ran with both, unlike Thursday's.
Commentary filled in a story. News-feed commentary at 2:30 PM ET described gold falling below 4,000 dollars as an oil surge deepened a weekly rout ahead of the Fed. That is the commentary's account. No intraday series was kept, so this outlook places no price in time. Afternoon news-feed commentary described the British pound faltering near 1.3400 as US business strength lifted the dollar, and an investment-bank currency note carried by the news feed described the dollar as firmer after a rough session for risk sentiment. The review treats those items as commentary, not as measured flows.
The Fed meets this week. The US flash purchasing managers' composite printed 57.6 against a 57.6 forecast and 58.4 previously, with services at 57.9 and manufacturing at 56.0, per the news-feed calendar and unconfirmed. Sentiment came next. The final University of Michigan sentiment survey printed 48.0 against a 46.3 forecast, with one-year inflation expectations at 4.7 percent and five-year expectations at 3.5 percent, per the news-feed calendar and unconfirmed. A note published after the close put the priced probability of an unchanged rate at the next meeting at 90 percent. The news feed carried an effective federal funds rate of 3.88 percent for October 22. The FOMC meeting begins on Tuesday, October 27, 2026, and the statement is scheduled for 2:00 PM ET on Wednesday, October 28, 2026, followed by the press conference at 2:30 PM ET, as the calendar lists them.
Gulf statements ran through the day. At 10:56 AM ET the news feed carried the President saying the US could end the Iran war very quickly. At 11:06 AM ET it carried a maritime security report of a tanker hit by an unknown projectile in the Strait of Hormuz near Oman. More came late. At 3:32 PM ET the feed carried an Iranian Revolutionary Guards statement, via state media, that two tankers struck naval mines south of the Strait, and at 3:36 PM ET the President saying the US may do another operation against Iran.
Russia-Ukraine items came from the same feed. At 9:18 AM ET it carried a localized ceasefire around Oleshky, which a White House statement placed from October 29, and at 3:40 PM ET the President saying he hoped the US was close to ending the Russia-Ukraine war. These are statements carried by the news feed rather than events confirmed for this review.
Escalation of this kind has at times supported gold, in the review's account; on Friday the commentary carried by the news feed linked gold's decline to the oil surge and the coming Fed decision instead. No causal link to the gold price is asserted.
No structural demand figure was available. No central-bank purchase figure, Chinese import figure or exchange-traded fund holdings figure was captured, so no structural-demand change is asserted. At 2:49 AM ET the news feed carried a Chinese pledge of action after US curbs on research ties. The review records it without assessing any effect on gold demand.
Energy surged. December WTI settled at 103.27, up 3.82 percent, and Brent's December contract at 116.72, up 3.14 percent. December silver fell 1.058 to 53.949, down 1.92 percent, with news-feed commentary describing a fresh yearly low. Copper went the other way. December copper rose 1.71 percent to 6.5075. The gold-to-silver ratio rose to 74.29 from 73.82. Stocks slipped. The S&P 500 cash index closed at 7,623.68, down 0.52 percent, the Nasdaq-100 cash index closed little changed, and the volatility index rose to 19.45 from 19.03.
In the review's interpretation, gold traded Friday as an asset pressured by higher yields and a firmer dollar in an energy-driven inflation scare, not as a haven; that reading is inference, not a measured flow. These items coincided with the session. No intraday series was kept, so no move is attributed to any one of them.
Positioning data arrived this time. The weekly positioning report dated October 20 puts managed-money long positions at 120,970 contracts, down 3,777 on the week, and managed-money short positions at 16,764, down 894. That leaves a net long of 104,206 against 107,089 a week earlier, a decline of 2,883. Commercial long positions rose 5,112 to 59,531 and commercial short positions fell 1,837 to 295,113. The report predates Thursday's and Friday's declines. Open interest on the December contract stands at 307,330 for Thursday in the provider's record. Friday's open interest had not been reported. Friday's December volume was 173,280 contracts against 214,607 on Thursday, down 41,327 or 19.3 percent, so Friday's decline came on lower volume than Thursday's.
The fund console comes next. The gold fund's options console was read at about 6:23 PM ET on Friday, after the settle, with a page date of 2026-10-23; every figure below is that evening read. The fund is a proxy, used qualitatively only and never translated into futures prices; it tracks bullion at a different scale with a fee drag and has no clean basis to the December contract. Strikes come first. The console shows its largest gamma concentration and its hedge level at the 380 strike, a call side ceiling at 450 and a put side support base at 365, against a previous close of 369.02 shown on the console and a 52-week low of 360.12.
Modeled call gamma reads minus 388.21 million against put gamma of minus 527.59 million on the proxy. Aggregate gamma is negative on both sides and larger on the put side. Call volume of 160.03 thousand against put volume of 222.32 thousand and a put-to-call open-interest ratio of 0.5 show puts outnumbering calls in the day's volume while calls still dominate open interest, an observation only. Options volume says nothing about direction or demand. Then volatility. One-month implied volatility reads 21.83 percent against realised volatility of 21.70 percent, with an implied-volatility rank of 15.44 percent and a skew rank of 25.20 percent. The options-implied move is 5.08 dollars, about 1.38 percent of the 369.02 previous close.
These are readings taken at about 6:23 PM ET. In the review's interpretation, implied volatility at that read sat in line with realised volatility, with a low implied-volatility rank, so at that read time the fund's options market was not pricing volatility far above what had recently been realised. Negative aggregate gamma at the same read is, in the review's interpretation, consistent with hedging that can extend moves rather than damp them. The fund's previous close sits between the put side support base and the largest gamma concentration. Modeled gamma on a proxy stays a non-directional lens. The console's live price field and its high and low volatility point fields are excluded, and no fund figure sets a futures level here.
The trade map for Monday
The primary setup is a short. Its band runs 4,036 to 4,044, around Pivot R1 at 4,042.4. The settle sits beneath every settlement average from the 5-day to the 200-day, and negative direction leads on the 9-day and 14-day directional systems. The composite reads "88% SELL", and the dollar and yields both rose on Friday. The band sits 28.1 to 36.1 points above the settle. Three anchors sit inside the band. Thursday's 4,036.8 low sits 0.8 above its bottom, the published projection at 4,039.7 sits 0.3 beneath the 4,040 midpoint, and Pivot R1 sits 1.6 beneath the top. Risk sits above Thursday's settle. The 4,062 stop clears Thursday's 4,060.4 settle by 1.6 and sits 3.1 beneath the published stochastic projection at 4,065.1. Targets step down to 4,018, 2.3 above the Pivot Point and 10.1 above the settle, then 3,996, 0.8 beneath the 3,996.8 relative strength projection and 6.9 above Friday's low. The extended 3,974 sits 7.3 beneath Pivot S1 at 3,981.3 and 9.0 above the 3,965.0 crossover stall level. The first target sits above the settle. The review flags the evidence against the trade. The 9-day relative strength at 25.61 describes an oversold market, in the review's words, and two days of weekend headline exposure leave room for a gap in either direction. So the review calls this an analyst judgment that rallies are sold while the dollar and yields stay firm, with no measured edge behind it.
Globex reopens at 6:00 PM ET on Sunday, October 25, 2026, after two days of weekend headline exposure. Friday's session ended with electronic trade until the 5:00 PM ET halt, and the last 30-minute bar, a post-settlement quote, closed at 4,010.0, 2.1 above the settle. Post-settlement quotes are not settlements. In the review's night outlook, a gap above Pivot R1 at 4,042.4 would put Thursday's 4,060.4 settle and one standard deviation resistance at 4,074.8 in reach, and a gap beneath Friday's 3,989.1 low would expose Pivot S1 at 3,981.3 and Pivot S2 at 3,954.6. Its night bias is lower beneath the Pivot Point at 4,015.7, with an expected band of roughly 3,975 to 4,045 absent a headline gap.
London runs from 3:00 AM to 8:00 AM ET on Monday. The German business climate survey is listed at 5:00 AM ET, and the UK distributive trades survey and results from a large US telecommunications company at 7:00 AM ET, all per the news-feed calendar and unconfirmed. The review's London band runs roughly 3,965 to 4,050, with a lower bias. Beneath the 3,989.1 low, Pivot S1 at 3,981.3 is the next listed support. Above the Pivot Point at 4,015.7, the published projection at 4,039.7 sits beneath Pivot R1 at 4,042.4. The cash equity open at 9:30 AM ET is, in the review's reading, the session's first directional test for the dollar and yields. The calendars carry no first-order US economic release for Monday morning. The morning band runs roughly 3,955 to 4,065, with Pivot S2 at 3,954.6 just beneath its bottom and Thursday's 4,060.4 settle 4.6 inside its top.
Afternoon comes next. The US two-year note auction is listed at 1:00 PM ET on Monday, per the news-feed calendar and unconfirmed, and gold settles at 1:30 PM ET. The afternoon band runs roughly 3,940 to 4,075, with its edges near one standard deviation support at 3,941.0 and one standard deviation resistance at 4,074.8. Then the evening. Globex reopens at 6:00 PM ET on Monday after the 5:00 PM ET halt, and Japan's services producer prices are listed at 7:50 PM ET, per the news-feed calendar and unconfirmed. For the full session the review sets a low-range case of 3,975 to 4,045, a mid-range case, the most likely, of 3,955 to 4,065 and a high-range case of 3,928 to 4,087.
The week's first-order events come later. The FOMC statement is scheduled for 2:00 PM ET on Wednesday, October 28, 2026, and the advance estimate of third-quarter GDP and the September personal income and outlays report for 8:30 AM ET on Thursday, October 29, 2026, as the calendar lists them. The calendar lists no entry for Monday, October 26, 2026. In the review's judgment the first-order influence for gold on Monday is the path of the dollar and yields after a weekend of Gulf headlines, with no first-order scheduled release on the calendars for the day.
One path is weighted. In the review's analyst judgment the most probable path holds the contract between Pivot S2 at 3,954.6 and Pivot R2 at 4,076.8. A rebound toward the 4,036 to 4,044 band that fails beneath Thursday's 4,060.4 settle is weighted slightly above a recovery. No measured frequency backs it. The alternative that would invalidate this reading is a renewed safe-haven bid on weekend Gulf escalation, or a reversal lower in the dollar and in yields. Either could carry the contract back above Thursday's 4,060.4 settle toward one standard deviation resistance at 4,074.8. In the review's reading, the 9-day relative strength at 25.61 and the 14-day raw stochastic at 7.42 percent describe an oversold market, so a rebound before any extension is a live alternative.
Friday's high stopped 49.8 points under one short band, and its settle finished 28.1 points beneath the next.
The complete data picture
Every number behind Monday’s plan, charted first, then the full level lists, then the complete numeric reference underneath.
Full numeric reference, every remaining figure from the session review
1. Executive Summary
The December gold contract settled at 4,007.9 on Friday, down 52.5 or 1.29 percent from Thursday's settle of 4,060.4, after trading between 4,050.2 and 3,989.1, a 61.1 point daily range. The settle finished at 30.8 percent of the range, and the 61.1 point range was 0.87 times the published 14-day average daily range of 70.2 points. Friday printed a lower high and a lower low against Thursday and made a second consecutive lower settle. The 4,007.9 settle and the 3,989.1 low are the lowest settle and the lowest low in the provider's record back to 10/13/25, and the 3,989.1 low is now the provider's published 52-week, 13-week and one-month low.
Over the week the contract lost 173.2 points or 4.14 percent from the 4,181.1 settle of 10/16. The dollar index rose to 101.81 from 101.61 and the ten-year yield index to 4.99 percent from 4.95 percent, a combination that, in this review's reading, weighs on gold. News-feed commentary at 2:30 PM ET described gold falling below 4,000 dollars as an oil surge deepened a weekly rout ahead of the Fed. December WTI settled at 103.27, up 3.82 percent, and Brent's December contract at 116.72, up 3.14 percent.
Silver's December contract fell 1.92 percent to 53.949, with news-feed commentary describing a fresh yearly low, while copper's December contract rose 1.71 percent. The gold-to-silver ratio rose to 74.29 from 73.82. The S&P 500 cash index fell 0.52 percent and the volatility index closed at 19.45 against 19.03. These items coincided with the session; no intraday series was kept, so no move is attributed to any one of them.
The settle sits beneath every settlement average from the 5-day to the 200-day, negative direction leads on both directional systems, and the composite multi-indicator read is "88% SELL", unchanged from the prior session's snapshot. The published 14-day average true range is 79.2 points. The gold fund proxy shows negative aggregate gamma, used qualitatively only. The Primary Setup below is a short from the 4,036 to 4,044 band around Pivot R1 at 4,042.4, stopped at 4,062 above Thursday's 4,060.4 settle, with objectives at 4,018, 3,996 and an extended 3,974. A weekend separates Friday's settle from the Sunday reopen, and two days of headline exposure make a gap in either direction a live risk.
2. Price Action & Technical Structure
2.1 Intraday and Session Review
The Friday session opened at 4,042.2 at the Thursday 6:00 PM ET reopen, 18.2 points beneath Thursday's settle, marked a daily high of 4,050.2 and a daily low of 3,989.1, and settled at 4,007.9. No intraday series was kept for this session, so this review does not describe the order in which the high and the low printed, and no timed price path is asserted; the daily bar alone fixes the open, the extremes and the settle.
This review records only that the 4,050.2 high and the 3,989.1 low both belong to Friday's completed session and that the settle sits 18.8 points above the low and 42.3 points beneath the high.
No Globex session is open on a Friday evening, so the open, high and low shown on the provider's overview page, 4,042.2, 4,050.2 and 3,989.1, belong to Friday's completed session and match the settlement row. The chart's 30-minute bars after the settle show electronic trade until the 5:00 PM ET halt, with a last 30-minute bar closing at 4,010.0; these are post-settlement quotes, not settlements, and they do not form a kept intraday series.
Friday's completed-session extremes are also the completed-session inputs behind the published pivot ladder rather than an independently read bar. Pivot R3 at 4,103.5 minus Pivot S3 at 3,920.2, divided by three, returns 61.1, and Pivot R2 at 4,076.8 minus Pivot S2 at 3,954.6, divided by two, returns the same 61.1. Three times the Pivot Point of 4,015.7 less the 4,007.9 settle gives a high plus low sum of 8,039.2, which the pair of 4,050.2 and 3,989.1 reproduces to the published rounding at 8,039.3, and that pair reproduces all seven published rungs.
Independent corroboration: the provider's settlement row and the chart's completed daily bar for the continuous contract carry the same 4,042.2 open, 4,050.2 high, 3,989.1 low and 4,007.9 settle, and the provider's one-month, 13-week and 52-week lows all read 3,989.1, equal to Friday's low.
2.2 Daily Structure
Friday's 4,050.2 high sits 114.1 points beneath Thursday's 4,164.3, and the 3,989.1 low sits 47.7 points beneath Thursday's 4,036.8, so the session printed a lower high and a lower low. The settle beneath the 4,042.2 open leaves a body of 34.3 points, an upper shadow of 8.0 points above the open and a lower shadow of 18.8 points beneath the settle.
Settlements over the last ten sessions ran 4,190.6, 4,177.3, 4,107.9, 4,170.1, 4,181.1, 4,160.1, 4,142.6, 4,150.0 and 4,060.4 before Friday's 4,007.9, so Friday made a second consecutive lower settle and printed the lowest settle in the provider's record, which begins on 10/13/25. The sequence of session highs over the last six sessions reads 4,220.4, 4,211.2, 4,174.9, 4,160.6, 4,164.3 and 4,050.2, and the sequence of session lows reads 4,167.5, 4,155.6, 4,130.1, 4,122.3, 4,036.8 and 3,989.1.
The one-month, 13-week and 52-week lows now all sit at Friday's 3,989.1. The one-month high of 4,351.6, the 13-week high of 4,755.0 and the 52-week high of 5,781.8 frame the upper side. No prior-quarter high or low was captured for this review, so the 13-week extremes serve as the available quarterly reference.
2.3 4-Hour and Swing Structure
Daily ranges for the last ten sessions ran 64.2, 55.1, 98.5, 76.8, 52.9, 55.6, 44.8, 38.3, 127.5 and 61.1. The settlement changes over the same ten sessions read minus 25.7, minus 13.3, minus 69.4, plus 62.2, plus 11.0, minus 21.0, minus 17.5, plus 7.4, minus 89.6 and minus 52.5.
The retracement grid published for Monday places the 38.2 percent retracement from the four-week low at 4,127.6, 119.7 points above the settle, the 50 percent retracement of the four-week range at 4,170.4 and the 38.2 percent retracement from the four-week high at 4,213.1. Further above, the 38.2 percent retracement from the 13-week low sits at 4,281.7. No four-hour series was captured for this review, so swing structure here rests on daily bars only.
2.4 Moving Averages
The averages cited in this subsection were computed for this review from the provider's daily settlement series for the December contract, which holds 260 completed sessions through Friday; no partial row was present because no Globex session is open on a Friday evening. Rounded once to the contract's 0.1 tick, the 5-day average stands at 4,104.2, the 9-day at 4,128.6, the 20-day at 4,155.3, the 50-day at 4,341.9, the 100-day at 4,286.3 and the 200-day at 4,609.4.
The 4,007.9 settle sits 96.3 points beneath the 5-day average, 120.7 points beneath the 9-day, 147.4 points beneath the 20-day, 334.0 points beneath the 50-day, 278.4 points beneath the 100-day and 601.5 points beneath the 200-day. The 5-day average fell 34.6 from Thursday's 4,138.8, because the 10/16 settle of 4,181.1 left the window and was replaced by 4,007.9. The 20-day fell from 4,170.9 to 4,155.3, because the 09/25 settle of 4,321.2 left that window, and the 50-day fell from 4,350.1 to 4,341.9.
The 20-day average sits beneath the 50-day because the last 20 settlements averaged less than the full 50, which means the 30 older settlements in the 50-day window averaged higher, at 4,466.3. The 50-day sits above the 100-day because the 50 older settlements in the 100-day window averaged lower, at 4,230.8, and the 100-day sits beneath the 200-day because the 100 older settlements in the 200-day window averaged higher, at 4,932.4. The projection grid gives the prices at which each average would be crossed on Monday: 4,122.5 for the 9-day, 4,151.2 for the 18-day and 4,275.0 for the 40-day.
2.5 Oscillator and Trend Readings
The oscillator figures below are as published on the provider's technical page, read at about 6:21 PM ET on Friday with no Globex session open, so they reflect the Friday settle; they are the provider's published readings, not computations made for this review. The 9-day relative strength reads 25.61, the 14-day relative strength 30.67 and the 20-day relative strength 34.75.
The 9-day raw stochastic reads 7.98 percent and the 14-day raw stochastic 7.42 percent, while the 14-day stochastic %K reads 17.98 percent and the 14-day stochastic %D 26.43 percent, so %K sits beneath %D near the bottom of the range.
The 9-day directional index ADX reads 32.77 with the 9-day +DI at 8.42 and the 9-day -DI at 35.27; the 14-day directional index ADX reads 24.63 with the 14-day +DI at 10.52 and the 14-day -DI at 30.04, so negative direction leads on both and the 9-day ADX reads above the 14-day. The 9-day historic volatility reads 16.19 percent and the 14-day historic volatility 16.63 percent.
The composite multi-indicator read published for the Monday session, quoted verbatim, is an Overall Average of "88% SELL", with Current Strength "Strong" and Current Direction "Strongest", and the Composite Indicator reads "SELL". The short-term group reads "Average: 100% SELL", the medium-term group "Average: 100% SELL" and the long-term group "Average: 33% SELL". The snapshot history reads "88% SELL" for yesterday, "48% SELL" for last week and "48% SELL" for last month, so the sell reading held at the prior session's level and stands above the week-ago and month-ago snapshots.
2.6 Volatility and Expected Range
The published 14-day average true range stands at 79.2 points and the 14-day average daily range at 70.2 points; the 9-day average true range is 74.8 with a 9-day average daily range of 67.8, and the 20-day average true range is 83.9 with a 20-day average daily range of 75.5. Friday's 61.1 point range was 0.87 times the 14-day average daily range.
Adding and subtracting the 14-day average true range of 79.2 points from the 4,007.9 settle frames Monday between 3,928.7 and 4,087.1. The published standard-deviation bands are built from five settlements: one deviation spans 3,941.0 to 4,074.8, two spans 3,913.3 to 4,102.5 and three spans 3,892.1 to 4,123.7. These bands describe settlement dispersion, not intraday reach, and a weekend headline gap can open outside any of them.
3. Key Levels
3.1 Resistance
Above the 4,007.9 settle, the first listed overhead reference is the Pivot Point at 4,015.7, followed by the published projection at 4,039.7 and Pivot R1 at 4,042.4. Friday's 4,050.2 high, Thursday's 4,060.4 settle and the published projection at 4,065.1 form the next band, with one standard deviation resistance at 4,074.8 and Pivot R2 at 4,076.8 above. The published stall projection at 4,098.8, two standard deviations resistance at 4,102.5 and Pivot R3 at 4,103.5 come next, with the 9-day average crossing price at 4,122.5 and three standard deviations resistance at 4,123.7 the extended references.
3.2 Support
Beneath the settle sits the 14-day relative strength projection at 30 percent, 3,996.8, then Friday's 3,989.1 low, which is also the one-month, 13-week and 52-week low, and Pivot S1 at 3,981.3. The 3-10 day crossover stall level at 3,965.0, the published target price at 3,963.4 and Pivot S2 at 3,954.6 form the next band, with one standard deviation support at 3,941.0 beneath. Pivot S3 at 3,920.2, two standard deviations support at 3,913.3 and three standard deviations support at 3,892.1 form the extended band.
4. Macro Drivers
4.1 Dollar and Real Yields
The dollar index closed at 101.81 in the provider's daily record, up 0.20 from Thursday's 101.61, after trading between 101.85 and 101.49. The ten-year yield index rose to 4.99 percent from 4.95 percent and the thirty-year to 5.32 percent from 5.28 percent. In this review's reading, a firmer dollar and higher nominal yields both weigh on gold, and Friday's decline ran with both, unlike Thursday's.
News-feed commentary carried in the afternoon described the British pound faltering near 1.3400 as US business strength lifted the dollar, and an investment-bank currency note carried by the news feed described the dollar as firmer after a rough session for risk sentiment. This review treats those items as commentary, not as measured flows.
4.2 Fed and Monetary Policy
The US flash purchasing managers' composite printed 57.6 against a 57.6 forecast and 58.4 previously, with services at 57.9 and manufacturing at 56.0, and the final University of Michigan sentiment survey printed 48.0 against a 46.3 forecast with one-year inflation expectations at 4.7 percent and five-year expectations at 3.5 percent, all per the news-feed calendar and unconfirmed. A note published after the close put the priced probability of an unchanged rate at the next meeting at 90 percent.
The FOMC statement is scheduled for 2:00 PM ET on Wednesday, October 28, 2026, as the calendar lists it, followed by the press conference at 2:30 PM ET on Wednesday, October 28, 2026, as the calendar lists it. The effective federal funds rate printed 3.88 percent for October 22 on the news feed.
4.3 Geopolitical Backdrop
The news feed carried at 10:56 AM ET the President saying the US could end the Iran war very quickly, at 11:06 AM ET a maritime security report of a tanker hit by an unknown projectile in the Strait of Hormuz near Oman, at 3:32 PM ET an Iranian Revolutionary Guards statement, via state media, that two tankers struck naval mines south of the Strait, and at 3:36 PM ET the President saying the US may do another operation against Iran.
On the Russia-Ukraine side, the feed carried at 9:18 AM ET a localized ceasefire around Oleshky, which a White House statement placed from October 29, and at 3:40 PM ET the President saying he hoped the US was close to ending the Russia-Ukraine war. Escalation of this kind has at times supported gold; on Friday the commentary carried by the news feed linked gold's decline to the oil surge and the coming Fed decision instead. These are statements carried by the news feed rather than events confirmed for this review.
4.4 China and Structural Demand (Central Bank Buying, PBOC, ETF Flows)
No central-bank purchase figure, Chinese import figure or exchange-traded fund holdings figure was captured for this review, so no structural-demand change is asserted. The news feed carried at 2:49 AM ET a Chinese pledge of action after US curbs on research ties, which this review records without assessing any effect on gold demand.
4.5 Energy and Cross-Asset
December WTI settled at 103.27, up 3.82 percent, and Brent's December contract at 116.72, up 3.14 percent. Silver's December contract fell 1.058 to 53.949, down 1.92 percent, and copper's December contract rose 1.71 percent to 6.5075. The gold-to-silver ratio rose to 74.29 from 73.82.
The S&P 500 cash index closed at 7,623.68, down 0.52 percent, the Nasdaq-100 cash index closed little changed, and the volatility index rose to 19.45 from 19.03. In this review's interpretation, gold traded Friday as an asset pressured by higher yields and a firmer dollar in an energy-driven inflation scare, not as a haven; that reading is inference, not a measured flow.
4.6 Institutional Positioning (COT, ETF Holdings, Speculator Length)
The weekly positioning report dated October 20, shown on the provider's overview, puts managed-money long positions at 120,970 contracts, down 3,777 on the week, and managed-money short positions at 16,764, down 894, for a net long of 104,206 against 107,089 a week earlier. Commercial long positions rose 5,112 to 59,531 and commercial short positions fell 1,837 to 295,113. The report predates Thursday's and Friday's declines.
Open interest on the December contract is shown at 307,330 for Thursday in the provider's record, and Friday's open interest had not yet been reported; Friday's December volume was 173,280 contracts against 214,607 on Thursday, so Friday's decline came on lower volume than Thursday's.
5. Gold Fund Options Context (Proxy)
The gold fund's options console was read at about 6:23 PM ET on Friday, after the settle, with a page date of 2026-10-23; every figure in this section is that evening read. The fund proxy is used qualitatively only and is never translated into futures prices; the fund tracks bullion at a different scale with a fee drag and has no clean basis to the December contract.
The console shows the largest gamma concentration and the hedge level at the 380 strike, the call side ceiling at 450 and the put side support base at 365, against a previous close of 369.02 shown on the console and a 52-week low of 360.12. Modeled call gamma reads minus 388.21 million against put gamma of minus 527.59 million, so aggregate gamma is negative on both sides and larger on the put side. Call volume of 160.03 thousand against put volume of 222.32 thousand and a put-to-call open-interest ratio of 0.5 show puts outnumbering calls in the day's volume while calls still dominate open interest.
One-month implied volatility reads 21.83 percent against realised volatility of 21.70 percent, the implied-volatility rank 15.44 percent and the skew rank 25.20 percent, with an options-implied move of 5.08 dollars. The console's live price field and its high and low volatility point fields are excluded.
In this review's interpretation, the 6:23 PM ET snapshot shows implied volatility in line with realised volatility and a low implied-volatility rank, so at that read time the fund's options market was not pricing volatility far above what had recently been realised. Negative aggregate gamma at the same read is, in this review's interpretation, consistent with hedging that can extend moves rather than damp them, and the fund's previous close sits between the put side support base and the largest gamma concentration. Nothing in this section is used to set a futures level; every level in this review originates in published pivot arithmetic, published standard-deviation bands, published retracement and moving-average projections, settlement averages computed from the provider's daily record, or the completed-session extremes described in section 2.1.
6. Forecast
6.1 Night Session (6:00 PM ET Sunday to 3:00 AM ET Monday, Globex/Asia)
Globex reopens at 6:00 PM ET on Sunday, October 25, 2026 after two days of weekend headline exposure that separate Friday's settle from the open. A gap above Pivot R1 at 4,042.4 would put Thursday's 4,060.4 settle and one standard deviation resistance at 4,074.8 in reach, and a gap beneath Friday's 3,989.1 low would expose Pivot S1 at 3,981.3 and Pivot S2 at 3,954.6. Bias lower beneath the Pivot Point at 4,015.7, expected band roughly 3,975 to 4,045 absent a headline gap.
6.2 London Session (3:00 AM to 8:00 AM ET Monday)
The German business climate survey is listed at 5:00 AM ET and the UK distributive trades survey at 7:00 AM ET on Monday, October 26, 2026, both per the news-feed calendar and unconfirmed. Bias lower, expected band roughly 3,965 to 4,050, with Pivot S1 at 3,981.3 the next listed support beneath the 3,989.1 low and Pivot R1 at 4,042.4 above the Pivot Point at 4,015.7 and the 4,039.7 projection.
6.3 Morning Session (9:30 AM to 12:00 PM ET Monday, US Open)
The cash equity open at 9:30 AM ET on Monday is the session's first directional test for the dollar and yields, and the calendars carry no first-order US economic release for Monday morning. Expected band roughly 3,955 to 4,065, with Pivot S2 at 3,954.6 just beneath its bottom and Thursday's 4,060.4 settle 4.6 inside its top.
6.4 Afternoon Session (12:00 PM to 4:00 PM ET Monday)
The US two-year note auction is listed at 1:00 PM ET on Monday, October 26, 2026, per the news-feed calendar and unconfirmed, and gold settles at 1:30 PM ET. Expected band roughly 3,940 to 4,075, with the outer edges near one standard deviation support at 3,941.0 and one standard deviation resistance at 4,074.8.
6.5 Night Session Forward (6:00 PM ET Monday)
Globex reopens at 6:00 PM ET on Monday after the 5:00 PM ET halt, and Japan's services producer prices are listed at 7:50 PM ET on Monday, October 26, 2026, per the news-feed calendar and unconfirmed. The FOMC statement is scheduled for 2:00 PM ET on Wednesday, October 28, 2026, as the calendar lists it, and the advance estimate of third-quarter GDP and the September personal income and outlays report for 8:30 AM ET on Thursday, October 29, 2026, as the calendar lists them, so the forward window carries the week's first-order events.
6.6 Expected Range (Monday Full Session)
Low-range scenario: 3,975 to 4,045
Mid-range scenario (most likely): 3,955 to 4,065
High-range scenario: 3,928 to 4,087
6.7 Most Likely Path
In this review's analyst judgment the most probable path holds the contract between Pivot S2 at 3,954.6 and Pivot R2 at 4,076.8, with a rebound toward the 4,036 to 4,044 band that fails beneath Thursday's 4,060.4 settle weighted slightly above a recovery. The settle sits beneath every settlement average from the 5-day to the 200-day, negative direction leads on both directional systems, the composite reads "88% SELL" with direction "Strongest", and the dollar and yields both rose.
The alternative that would invalidate this reading is a renewed safe-haven bid on weekend Gulf escalation, or a reversal lower in the dollar and in yields, either of which could carry the contract back above Thursday's 4,060.4 settle toward one standard deviation resistance at 4,074.8. In this review's reading, the 9-day relative strength at 25.61 and the 14-day raw stochastic at 7.42 percent describe an oversold market, so a rebound before any extension is a live alternative.
7. Monday Economic Calendar
Friday's releases are complete. The US flash purchasing managers' surveys printed a composite of 57.6, services at 57.9 and manufacturing at 56.0, and the final University of Michigan sentiment survey printed 48.0 with one-year inflation expectations at 4.7 percent, all per the news-feed calendar and unconfirmed. Gold settled at 1:30 PM ET, and the news feed carried at 4:48 PM ET a rating agency statement that France's rating remains Aa3.
On Monday, October 26, 2026 the German business climate survey is listed at 5:00 AM ET, the UK distributive trades survey at 7:00 AM ET and results from a large US telecommunications company at 7:00 AM ET, all per the news-feed calendar and unconfirmed. The US two-year note auction is listed at 1:00 PM ET and Japan's services producer prices at 7:50 PM ET, both per the news-feed calendar and unconfirmed. The calendar lists no entry for Monday, October 26, 2026.
Later in the week, the FOMC meeting begins on Tuesday, October 27, 2026, as the calendar lists it, the FOMC statement is scheduled for 2:00 PM ET on Wednesday, October 28, 2026, as the calendar lists it, and the advance estimate of third-quarter GDP and the September personal income and outlays report for 8:30 AM ET on Thursday, October 29, 2026, as the calendar lists them. In this review's judgment the first-order influence for gold on Monday is the path of the dollar and yields after a weekend of Gulf headlines, with no first-order scheduled release on the calendars for the day.
8. Primary Trade Setup
Direction: Short
Rationale: The settle sits beneath every settlement average from the 5-day to the 200-day, negative direction leads on the 9-day and 14-day directional systems, the composite reads "88% SELL", and the dollar and yields both rose on Friday. A rebound into the 4,036 to 4,044 band around Pivot R1 at 4,042.4 offers a short with a defined risk point above Thursday's 4,060.4 settle. The 9-day relative strength at 25.61 describes an oversold market and two days of weekend headline exposure leave room for a gap in either direction, so the setup is an analyst judgment that rallies are sold while the dollar and yields stay firm, not a measured edge.
Entry Zone: 4,036 to 4,044
Stop Loss: 4,062 (above Thursday's 4,060.4 settle and beneath the 4,065.1 stochastic projection)
Target 1 (T1): 4,018 (just above the Pivot Point at 4,015.7)
Target 2 (T2): 3,996 (just beneath the 3,996.8 relative strength projection and above Friday's 3,989.1 low)
Target 3 (T3, extended): 3,974 (beneath Pivot S1 at 3,981.3 and above the 3,965.0 crossover stall level)
Risk-to-Reward: Approximately 1:1 to T1, 1:2 to T2, 1:3 to T3
Invalidation: A settle above Thursday's 4,060.4 settle negates the thesis. Short of that, the edge is removed by acceptance above the entry band rather than by a touch, defined as two consecutive 30-minute closes above 4,044.
Macro override: A renewed safe-haven bid on Gulf escalation over the weekend, or a sharp reversal lower in the dollar and yields, would undercut the short. In that scenario a move through the 4,062 stop invalidates the setup before the targets, and one standard deviation resistance at 4,074.8 and Pivot R2 at 4,076.8 become the references, 12.8 and 14.8 points beyond the stop and inside one 14-day average true range of 79.2 points.
Sources and methodology
This outlook is built from our session review of the December gold contract, the December ’26 contract, prepared after Friday's close on October 23, 2026 for the Monday, October 26, 2026 session. Friday's completed extremes are the inputs behind the published pivot ladder for Monday: Pivot R3 at 4,103.5 less Pivot S3 at 3,920.2, divided by three, and Pivot R2 at 4,076.8 less Pivot S2 at 3,954.6, divided by two, both return 61.1, and three times the 4,015.7 Pivot Point less the settle gives 8,039.2, which the 4,050.2 high and the 3,989.1 low reproduce to the published rounding at 8,039.3. The provider's settlement row and the chart's completed Friday bar carry the same open, extremes and settle, and the provider's one-month, 13-week and 52-week lows all read 3,989.1. Only those figures, the dated 2026-10-23 row of the provider's daily record and the review's statements are used to grade Friday's card. No intraday series was kept for Friday, so no statement here places the high or the low in time. Friday's session opened at the Thursday 6:00 PM ET reopen. No session is open on a Friday evening, so the open, high and low shown on the provider's overview belong to Friday's completed session, and the 30-minute bars after the settle are post-settlement quotes. Monday's session opens at the Sunday 6:00 PM ET reopen.
Thursday's 2026-10-22 row has been revised since our Friday outlook: volume now reads 214,607 contracts against the preliminary 202,885, and open interest 307,330, which that outlook listed as not yet reported; Thursday's prices are unchanged. Friday's open interest was not yet reported. The moving averages were computed from the provider's daily settlement series of 260 completed sessions through Friday and rounded once to the 0.1 tick; the oscillators are cited as published, read at about 6:21 PM ET on Friday with no session open, and the composite strings are quoted verbatim. The gold fund is a proxy used qualitatively; its gamma figures are modeled, its live price field and its high and low volatility point fields were not used, and no fund level is translated into a futures price. The percent changes for the dollar index and silver, the gold-to-silver ratios, the managed-money net change and the fund's implied move as a percent are computed from the stated figures. Scenario ranges are analyst judgment, and items marked unconfirmed come from the news-feed calendar or the news feed.
Friday’s outlook for this contract is here, and the crude oil contract’s Friday outlook covers the December WTI contract, which settled at 103.27 on Friday, up 3.82 percent. Outlooks for ES, NQ, GC and CL are collected on the market outlook page, and our forward trading record is on the performance statement.