
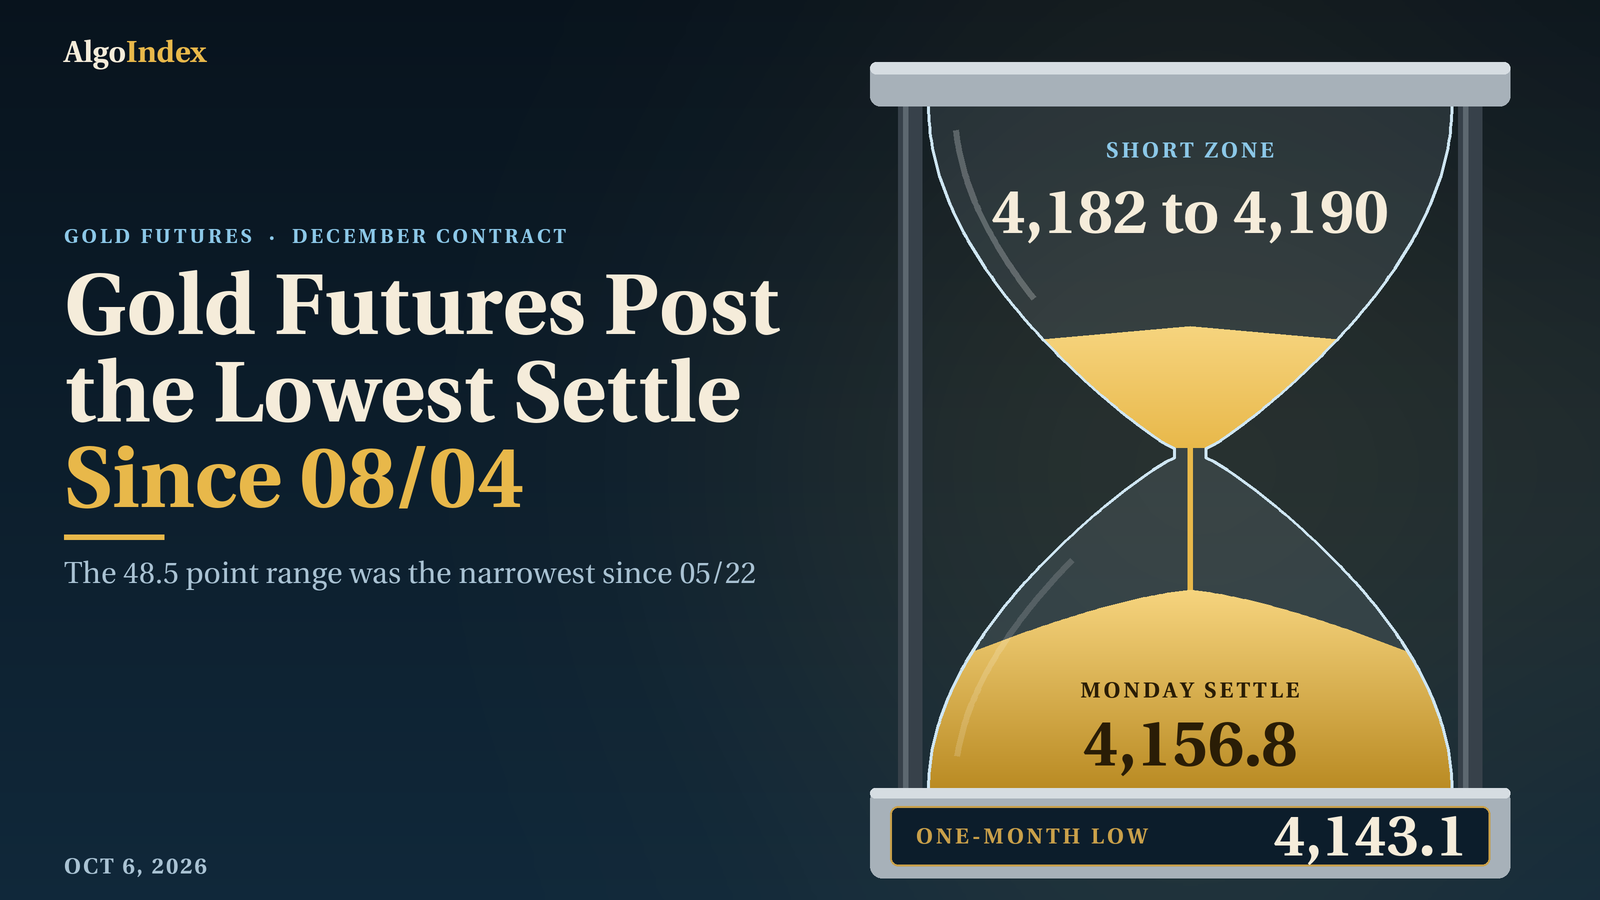
Gold climbed through the night and gave it all back by late morning. December gold reached 4,198.9 in the 4:00 AM ET bar on Monday, then fell to 4,150.4 in the 11:00 AM ET bar. The decline covered the full 48.5 point range. The contract settled at 4,156.8 at 1:30 PM ET, down 5.5 points, or 0.13 percent, from Friday's 4,162.3.
Provider commentary said the dollar index rallied to a 1.5-year high and the ten-year Treasury yield touched a 24-year high during the session. The dollar index closed 0.24 percent higher at 102.17. The services survey printed 54.9 against a 55.0 forecast, per the news-feed calendar. Tuesday's primary setup is a short from 4,182 to 4,190, around Pivot R1 at 4,187.0.
December gold settled at 4,156.8, 6.4 points above the 4,150.4 low and 42.1 points beneath the 4,198.9 high. That is 13.2 percent of the range. The 48.5 point range was the narrowest since 05/22, and the settle the lowest since 08/04. Monday printed a lower high and a lower low against Friday. The contract sits beneath all six settlement averages, from the 5-day at 4,177.6 to the 200-day at 4,639.7, and the composite reads "80% SELL". The primary setup is a short from 4,182 to 4,190, stop 4,212, targets 4,160, 4,134 and 4,108. Tuesday's first-order event is the 1:00 PM ET three-year note auction, per the news-feed calendar and unconfirmed.
Monday's short, scored against the bar
Our Monday outlook set a short from 4,196 to 4,206, stop 4,236, with targets at 4,166, 4,131 and 4,096. Monday's completed bar ran from 4,150.4 to 4,198.9. The band traded, by 2.9 points. The 4,198.9 high held 37.1 points beneath the 4,236 stop, which never traded.
The order comes from the preserved 30-minute provider series. The 3:30 AM ET bar reached 4,194.9, 1.1 points short of the band. The 4:00 AM ET bar then printed 4,198.9, inside its bottom. The 4:30 AM ET, 5:00 AM ET and 7:30 AM ET bars traded there again, at 4,198.6, 4,198.7 and 4,197.1. No bar reached the 4,206 top of the band.
The first target came later. The 9:30 AM ET bar fell to 4,159.1, 6.9 points beneath the 4,166 first target, five and a half hours after the band first traded. The 4,150.4 low in the 11:00 AM ET bar held 19.4 points above the 4,131 second target. The 4,096 third target never traded. The settle sits 9.2 points beneath the first target. The series records prints only. It shows no fills.
Earlier prints sit outside the scoring. The 6:00 PM ET reopen bar dipped to 4,160.0, and the bars from 11:00 PM ET through 2:00 AM ET traded beneath the first target, down to 4,152.3 in the 12:00 AM ET bar. All of that came before any trade inside the band. It carries no result for the card.
The exit lines held. The card named a settle above Pivot R1 at 4,229.6 as its invalidation, and Monday settled 72.8 points beneath it. Its second test was two consecutive 30-minute closes above 4,226. The highest 30-minute close was 4,195.7, in the 4:30 AM ET bar, 30.3 points beneath that line.
The path call was mixed. It held the reopened contract beneath the 4,191.7 Pivot Point, with the 4,143.1 one-month low as the first downside test. The 3:30 AM ET bar took the contract above that pivot, and the high cleared it by 7.2 points. The settle came back 34.9 points beneath it. The low held 7.3 points above the one-month low, which went untested.
The session bands fared better. The night session ran from 4,152.3 to 4,191.0, inside the 4,135 to 4,195 Globex band. London ran from 4,177.9 to 4,198.9, inside 4,130 to 4,200. The United States morning stayed inside 4,120 to 4,210, and the afternoon inside 4,130 to 4,200. The low-range case of 4,140 to 4,195 missed the high by 3.9 points. The mid-range case of 4,115 to 4,215 held the whole day. Its macro override named a sharp fall in yields after the services survey. The ten-year yield index closed four basis points higher.
The scoring uses the dated 2026-10-05 row of the provider's daily record. It reads 4,169.4, 4,198.9, 4,150.4 and 4,156.8 on 109,640 contracts, with open interest not yet reported. Tonight's review states the same open, high, low and settle. Friday's row changed. It now carries 169,001 contracts and open interest of 324,063. Our Monday outlook carried a preliminary 164,881 contracts for Friday, with open interest not yet reported. The 324,063 figure is up 365 from Thursday's 323,698.
Monday opened at 4,169.4 at the Sunday 6:00 PM ET reopen, 7.1 points above Friday's settle. The Asian hours were two-sided. The contract rose to 4,191.0 in the 10:00 PM ET bar and fell to 4,167.3 in the 10:30 PM ET bar. It traded down to 4,152.3 in the 12:00 AM ET bar before closing at 4,153.9. The 2:00 AM ET bar recovered to 4,184.1.
Europe carried it higher. The 4:00 AM ET bar printed the 4,198.9 session high. From the 4:30 AM ET bar through the 8:30 AM ET bar the contract held between 4,179.1 and 4,198.7.
The decline began in the United States morning. The 9:00 AM ET bar traded down to 4,174.8. The 9:30 AM ET bar fell to 4,159.1 and closed at 4,163.4. The 10:00 AM ET bar, which contained the services survey, traded between 4,162.9 and 4,175.1. Then the 11:00 AM ET bar printed the 4,150.4 low and closed at 4,167.2. The 12:00 PM ET bar traded down to 4,153.6. The 1:00 PM ET bar held between 4,152.9 and 4,160.0 ahead of the 1:30 PM ET settlement at 4,156.8.
After the settle, electronic trade held between 4,154.7 and 4,171.6 through the 4:30 PM ET bar, which closed at 4,167.6. Those are post-settlement prints, and none is used as the settlement. The preserved series holds 46 bars. The Tuesday session reopened at 6:00 PM ET Monday. The provider's day open, high and low of 4,169.2, 4,172.0 and 4,168.5, shown when the review was written, belong to that new session.
Those extremes carry a provenance note. They are the completed-session inputs behind the published pivot ladder, back-solved from its outer pairs. The third resistance point at 4,235.5 less the third support point at 4,090.0, divided by three, returns 48.5. The second pair, 4,217.2 less 4,120.2, divided by two, returns the same 48.5. Three times the 4,168.7 Pivot Point less the 4,156.8 settle gives a high-plus-low sum of 8,349.3. The pair of 4,198.9 and 4,150.4 then reproduces all seven published rungs. The provider's settlement row, the chart's completed Monday daily bar and the highest and lowest 30-minute bars carry the same high and low.
Lower high, lower low. Monday's 4,198.9 high sits 60.1 points beneath Friday's 4,259.0, and its 4,150.4 low sits 3.4 points beneath Friday's 4,153.8. The low was the lowest since the 4,145.2 low of 09/29. The 48.5 point range was 0.55 times the published 14-day average daily range of 87.8 points, the narrowest session since the 47.1 point range of 05/22.
A narrow session, every average overhead
Monday was the second consecutive lower settle. The 4,156.8 settle was the lowest since the 4,152.6 settle of 08/04. Eight settlements frame the slide. From 09/24 they run 4,298.0, 4,321.2, 4,168.4, 4,179.7, 4,186.7, 4,202.3, 4,162.3 and 4,156.8. Daily ranges for the last seven sessions ran 62.4, 172.7, 72.9, 73.0, 53.4, 105.2 and 48.5.
Monday's high was the lowest of the six. Session highs over the last six sessions read 4,315.8, 4,218.1, 4,251.2, 4,222.8, 4,259.0 and 4,198.9. The lows read 4,143.1, 4,145.2, 4,178.2, 4,169.4, 4,153.8 and 4,150.4. The prior week, September 28 through October 2, spanned 4,315.8 to 4,143.1. Monday traded inside it.
The lows are close by. The one-month low of 4,143.1 from 09/28 sits 13.7 points beneath the settle. The one-month high of 4,488.8 from 09/08 sits 332.0 points above it. Deeper references are the 13-week low at 4,019.0 and the 52-week low at 4,015.6. No prior-quarter high or low is available, so the 13-week extremes serve as the quarterly reference.
Overhead, the retracement grid published for Tuesday places the 38.2 percent retracement from the four-week low at 4,275.2. The 50 percent retracement of the four-week range sits at 4,316.0, and the 38.2 percent retracement from the four-week high at 4,356.7. The 38.2 percent retracement from the 13-week low is 4,300.2. No four-hour series is available. The 30-minute series is the only intraday evidence used.
Every average is overhead. The figures were computed from the provider's daily settlement series for the December contract, 259 completed sessions through Monday. The 5-day average stands at 4,177.6, the 9-day at 4,221.5, the 20-day at 4,318.3, the 50-day at 4,372.8, the 100-day at 4,355.7 and the 200-day at 4,639.7. The settle sits 20.8 points beneath the 5-day, 64.7 beneath the 9-day and 161.5 beneath the 20-day. It sits 216.0 beneath the 50-day, 198.9 beneath the 100-day and 482.9 beneath the 200-day.
The 9-day fell hardest. It dropped 24.4 points from 4,245.9 as the 09/22 settle of 4,376.4 left its window. The 20-day fell 16.0 points from 4,334.3 as the 09/04 settle of 4,476.6 left. The 5-day slipped only 2.3 points from Friday's 4,179.9, because the 09/28 settle of 4,168.4 left the window and was replaced by 4,156.8. The 50-day sits 17.1 points above the 100-day. The 50 settlements before the latest 50 averaged 4,338.7, lower than the latest 50. That is why the shorter average sits higher. The projection grid puts Tuesday's crossing prices at 4,209.4 for the 9-day, 4,297.6 for the 18-day and 4,419.8 for the 40-day.
The oscillators sit at the bottom. They are published figures from the provider's technical page dated for the Tuesday session, read after the 6:00 PM ET reopen. The page may carry the live Globex price, so they are quoted as published. Relative strength reads 27.55 on the 9-day, 33.63 on the 14-day and 38.31 on the 20-day. The 9-day raw stochastic reads 5.18 percent and the 14-day 4.62 percent. The 14-day %K reads 10.35 percent and %D 13.02 percent. The published grid places the 14-3 day raw stochastic 20 percent threshold at 4,202.4 and the 14-day relative-strength 30 percent line at 4,097.1.
Negative direction leads on both horizons. On the 9-day the directional index reads 28.61, with negative direction at 21.19 against positive direction at 12.91. The 14-day reads 19.80, negative 21.05 over positive 13.81. The composite multi-indicator snapshot, quoted verbatim, reads overall "80% SELL", current strength "Average", current direction "Strengthening" and composite indicator "SELL". The short-term group reads "Average: 100% SELL", the medium-term "Average: 100% SELL" and the long-term "Average: HOLD". Yesterday it read "80% SELL". Last week, "64% SELL". Last month, "24% BUY".
Monday's range fell well short of the averages. The published 14-day average true range stands at 93.3 points, 2.20 percent as published, and the 14-day average daily range at 87.8 points. The 9-day figures are 88.0 and 82.7, the 20-day 96.7 and 91.5. Historic volatility reads 18.86 percent on the 9-day and 17.94 percent on the 14-day. One 14-day average true range from the 4,156.8 settle frames Tuesday between 4,063.5 and 4,250.1. The published standard-deviation bands are narrower because they are built from five settlements. One deviation spans 4,138.3 to 4,175.3, two span 4,130.7 to 4,182.9 and three span 4,124.8 to 4,188.8. Those bands describe settlement dispersion, not intraday reach.
A firmer dollar, a higher yield
The dollar led the commentary. The dollar index closed at 102.17, up 0.24 points or 0.24 percent, after a session range of 101.86 to 102.54, per the provider's quote. Provider commentary described the close as a 1.5-year high driven by political turmoil in France and Spain weighing on the euro. A news-feed article at 11:45 AM ET tied the move to French debt concerns.
Yields rose too. The ten-year yield index closed at 5.31 percent, up four basis points. Provider commentary said the ten-year yield touched a 24-year high during the session. No real-yield series is available, so the nominal yield is the measured channel.
The services survey landed close to forecast. The survey from the purchasing managers' institute, released at 10:00 AM ET, printed 54.9 against a 55.0 forecast and 55.4 previously. Its employment component came in at 50.1 against 48.8, per the news-feed calendar. Provider commentary said the prices-paid component rose 1.4 points to 74.0, a four-year high, and called it hawkish for policy. It described the dollar rally and the yield high the same way.
Other commentary leaned softer. A news-feed article at 3:00 PM ET described gold as stalling below 4,150 dollars as rising yields offset relief from softer policy expectations. Investment-bank commentary on the news feed said the September employment data point to less urgency for further hikes. The calendar lists the minutes of the September policy meeting for 2:00 PM ET on October 7, 2026.
Headlines arrived after the settle. At 3:38 PM ET the news feed carried a Treasury notice that foreign banks may be sanctioned for business with Iran. At 4:12 PM ET it carried a Houthi statement claiming three military operations in Saudi Arabia. There was no Saudi confirmation. Between 3:21 PM ET and 3:31 PM ET the President said he was always open to direct talks with Iran. He also said a specific threat had prompted bombers to be withdrawn from a base in the United Kingdom. These are statements carried by the news feed and unconfirmed beyond it. None of them preceded the 1:30 PM ET settle.
Structural demand stays unmeasured. No central bank purchase figure, Chinese import figure or fund holdings series is available, so none is asserted. The gold fund closed at 379.55, down 0.16 percent, per the provider's quote. That is a price. It says nothing about holdings.
The rest of the board split. November crude settled at 89.43, down 1.84 percent, and Brent's December contract at 100.32, down 1.89 percent. Provider commentary said the crude decline eased inflation expectations and limited the dollar's gain. Silver's December contract settled at 61.300, up 0.885 or 1.46 percent. The gold-to-silver ratio fell to 67.81 from 68.90. The S&P 500 cash index closed at 7,773.95, up 0.66 percent, and the volatility index at 15.52.
Positioning is a week old. The latest positioning report on the provider's overview is as of September 29, 2026. Managed money held 131,711 long contracts against 11,393 short, a net long of 120,318. Commercials held 58,831 long against 309,798 short. The overview still shows that report as its latest, so no change in positioning is asserted for Monday. Open interest on the December contract reads 324,063, Friday's figure on the dated 10/02 row. Monday's had not been reported.
The gold fund is read qualitatively only. Its positioning console, read at about 6:21 PM ET, showed 379.55 against a 380.18 previous close. The provider's quote has the fund at 379.55, down 0.16 percent, against a 380.14 previous close. The console's summary panel, marked as updated 2026-10-03, still carried a 382.78 previous close from Thursday. The console row shows call gamma of minus 229 million against put gamma of 158 million. It attributes 3.76 percent of the fund's gamma and 0.42 percent of its delta to the nearest expiration. Only a small share of positioning rolls off at the next expiry, and in our review's interpretation no expiry-driven pinning is inferred for Tuesday. Tonight's desk note carried no commentary on the fund. The high and low volatility point fields are excluded as low-confidence. No fund level is translated into a futures price.
The trade map for Tuesday
The setup leans on Monday's weak close. The contract settled at 13.2 percent of its range, at the lowest settle since 08/04. It sits beneath every settlement average from the 5-day to the 200-day. The composite reads "80% SELL" with direction "Strengthening". A rally into Pivot R1 offers a short with a defined risk point above the Monday high. The entry zone runs 4,182 to 4,190, 25.2 to 33.2 points above the settle. Its top sits 1.2 points above three standard deviations resistance at 4,188.8. The stop at 4,212 sits 13.1 points above the 4,198.9 Monday high, 9.6 above the stochastic line and 5.2 beneath Pivot R2 at 4,217.2. From the 4,186 entry midpoint the stop sits 26 points away. The 14-day average true range is 93.3 points. Oscillators are already at the bottom of their ranges. The setup is therefore an analyst judgment that the dollar and yield channel outweighs oversold readings.
Fresh headlines preceded the reopen. The Tuesday session reopened at 6:00 PM ET Monday, with the Iran sanctions notice and the Houthi claim both arriving after the settle. German industrial orders are listed at 2:00 AM ET, per the news-feed calendar and unconfirmed. Monday's Asian hours ranged between 4,152.3 and 4,191.0, so the overnight window has shown two-way swings. Bias neutral to lower beneath the 4,168.7 Pivot Point. Expected Globex band roughly 4,140 to 4,185.
London runs from 3:00 AM to 8:00 AM ET. The United Kingdom construction survey is listed at 4:30 AM ET and euro area retail sales at 5:00 AM ET, both per the news-feed calendar and unconfirmed. Monday's high printed in the 4:00 AM ET bar, so the London window carries the most recent evidence of buying. The euro's direction after Monday's French debt concerns is the cross-read through the dollar. Bias neutral. Expected band roughly 4,145 to 4,190.
Then the United States morning, 9:30 AM to 12:00 PM ET. The calendar lists the trade balance at 8:30 AM ET and the Vice Chair for Supervision at 10:45 AM ET. A regional Federal Reserve president is listed at 9:05 AM ET, per the news-feed calendar and unconfirmed. Monday's decline ran from the 9:00 AM ET bar to the 11:00 AM ET bar. In our review's reading, the morning is where the yield channel last reached gold. Expected band roughly 4,135 to 4,185, with the 4,138.3 to 4,143.1 band the first support.
The afternoon, 12:00 PM to 4:00 PM ET, holds the auction. A three-year note auction is listed at 1:00 PM ET and a regional Federal Reserve president at 1:15 PM ET, both per the news-feed calendar and unconfirmed. Gold settles at 1:30 PM ET. The auction's reception reaches gold through yields. Expected band roughly 4,135 to 4,180.
Further out, another regional Federal Reserve president is listed at 7:00 PM ET Tuesday, per the news-feed calendar and unconfirmed. Two dates follow. The calendar lists the short-term energy outlook at 12:00 PM ET Tuesday and the minutes of the September policy meeting at 2:00 PM ET on October 7, 2026.
The single first-order event for gold on Tuesday, in our review's judgment, is the 1:00 PM ET three-year note auction, per the news-feed calendar and unconfirmed. The reason is yields. The ten-year yield closed near a 24-year high, per provider commentary, and in the review's reading the yield channel drove Monday's decline. Three scenario bands frame the full session. The low-range case runs 4,140 to 4,185. The mid-range case, the most likely, runs 4,125 to 4,200, and the high-range case 4,090 to 4,235.
In our review's analyst judgment, the most probable path keeps the contract beneath the 4,168.7 Pivot Point and the 4,177.6 5-day average. It weights a test of the 4,143.1 one-month low and the 4,138.3 to 4,138.5 pairing of one standard deviation support and Pivot S1 above a recovery through Pivot R1 at 4,187.0. Why? The settle sits beneath every settlement average. The composite reads "80% SELL" with direction "Strengthening", and negative direction leads on the directional system. The dollar sits at a 1.5-year high, per provider commentary. The alternative that would invalidate this reading is a fall in yields after the 1:00 PM ET auction or a Gulf escalation that carries the contract through the 4,198.9 Monday high.
Gold spent Monday night climbing to 4,198.9 and Monday morning handing all 48.5 points back.
The complete data picture
Every number behind Tuesday’s plan, charted first, then the full level lists, then the complete numeric reference underneath.
Full numeric reference, every remaining figure from the session review
Carried below in the review's own order: the level notes behind sections 3.1 and 3.2, the executive summary from section 1, sections 2.1 to 2.6, sections 4.1 to 4.6, the fund options context from section 5, the session-by-session forecast from section 6, the Tuesday calendar from section 7 and the primary setup from section 8.
Level notes (3.1 Resistance and 3.2 Support)
The settle at 4,156.8 sits 11.9 points beneath the Pivot Point at 4,168.7. One standard deviation resistance at 4,175.3, the 5-day settlement average at 4,177.6 and two standard deviations resistance at 4,182.9 come next. Pivot R1 at 4,187.0 sits 1.8 points beneath three standard deviations resistance at 4,188.8, and the 4,198.9 Monday high follows.
The stochastic 20 percent threshold at 4,202.4 and the 9-day average crossing price at 4,209.4 follow, with Pivot R2 at 4,217.2 and the 9-day settlement average at 4,221.5 above them. Pivot R3 at 4,235.5 sits beneath Friday's 4,259.0 high, and the 38.2 percent retracement from the four-week low at 4,275.2 is the extended reference.
Beneath the settle, the 4,150.4 Monday low in the 11:00 AM ET bar is the first reference, followed by the 4,145.2 low of 09/29 and the 4,143.1 one-month low. Pivot S1 at 4,138.5 and one standard deviation support at 4,138.3 sit two tenths apart, with two standard deviations support at 4,130.7 and three standard deviations support at 4,124.8 beneath them.
Pivot S2 at 4,120.2 comes next, then the 14-day relative-strength 30 percent line at 4,097.1, the 3-10 day average crossover stall price at 4,096.3 and Pivot S3 at 4,090.0. The 13-week low at 4,019.0 and the 52-week low at 4,015.6 are the deeper references.
1. Executive Summary
The December gold contract settled at 4,156.8 on Monday, down 5.5 points or 0.13 percent from Friday's 4,162.3 settle, after trading between 4,198.9 and 4,150.4, a 48.5 point daily range. The settle finished at 13.2 percent of the range, and the 48.5 point range was 0.55 times the published 14-day average daily range of 87.8 points, the narrowest session since the 47.1 point range of 05/22. The settle was the lowest since the 4,152.6 settle of 08/04, and Monday was the second consecutive lower settle. Against Friday, Monday printed a lower high and a lower low.
The preserved 30-minute series fixes the order. The contract rose through the Asian and European hours to the 4,198.9 session high in the 4:00 AM ET bar, held above 4,179.1 through the 8:30 AM ET bar, and then fell to the 4,150.4 session low in the 11:00 AM ET bar, a decline equal to the full 48.5 point range. The 1:30 PM ET settle came at 4,156.8. Provider commentary said the dollar index rallied to a 1.5-year high, the ten-year Treasury yield touched a 24-year high during the session, and the prices-paid component of the services survey rose to a four-year high of 74.0, all of which it described as hawkish for policy.
The services survey from the purchasing managers' institute, released at 10:00 AM ET, printed 54.9 against a 55.0 forecast, per the news-feed calendar. The dollar index closed 0.24 percent higher at 102.17 and the ten-year yield index four basis points higher at 5.31 percent, while silver's December contract rose 1.46 percent and November crude fell 1.84 percent. The composite multi-indicator snapshot reads "80% SELL", unchanged from the prior session.
The contract sits beneath every settlement average from the 5-day to the 200-day. The primary setup is a short from the 4,182 to 4,190 band around Pivot R1 at 4,187.0, stopped at 4,212 above the 4,198.9 Monday high, with objectives at 4,160, 4,134 and an extended 4,108.
2.1 Intraday and Session Review
The Monday session opened at 4,169.4 at the Sunday 6:00 PM ET reopen, 7.1 points above Friday's settle, marked a daily high of 4,198.9 and a daily low of 4,150.4, and settled at 4,156.8 at 1:30 PM ET. The preserved 30-minute provider series, 46 bars from the reopen through the 4:30 PM ET bar, places the high in the 4:00 AM ET bar and the low in the 11:00 AM ET bar.
The Asian hours were two-sided. The contract rose to 4,191.0 in the 10:00 PM ET bar, fell to 4,167.3 in the 10:30 PM ET bar, and traded down to 4,152.3 in the 12:00 AM ET bar before closing at 4,153.9. The 2:00 AM ET bar recovered to 4,184.1, and the European morning carried the contract to the 4,198.9 session high in the 4:00 AM ET bar. From the 4:30 AM ET bar through the 8:30 AM ET bar the contract held between 4,179.1 and 4,198.7.
The decline began in the United States morning. The 9:00 AM ET bar traded down to 4,174.8, and the 9:30 AM ET bar fell to 4,159.1 and closed at 4,163.4. The 10:00 AM ET bar, which contained the services survey, traded between 4,162.9 and 4,175.1, and the 11:00 AM ET bar printed the 4,150.4 session low before closing at 4,167.2. The 12:00 PM ET bar traded down to 4,153.6 and the 1:00 PM ET bar held between 4,152.9 and 4,160.0. The settlement at 1:30 PM ET was 4,156.8.
After the 1:30 PM ET settlement, electronic trade held between 4,154.7 and 4,171.6 from the 1:30 PM ET bar through the 4:30 PM ET bar, which closed at 4,167.6. These post-settlement prints come after the settle and are not used as the settlement anywhere in this outlook. The Tuesday session reopened at 6:00 PM ET Monday; the provider's day open, high and low of 4,169.2, 4,172.0 and 4,168.5 shown at the time of writing belong to that new session, not to Monday.
The session extremes used here are the completed-session inputs behind the published pivot ladder, back-solved from the outer pivot pairs and verified against every rung. The third resistance point at 4,235.5 minus the third support point at 4,090.0, divided by three, returns 48.5, and the second resistance point at 4,217.2 minus the second support point at 4,120.2, divided by two, returns the same 48.5. Three times the Pivot Point of 4,168.7 less the 4,156.8 settle gives a high plus low sum of 8,349.3, and the pair of 4,198.9 and 4,150.4 reproduces all seven published rungs. The provider's settlement row, the chart's completed Monday daily bar and the highest and lowest bars of the 30-minute series carry the same 4,198.9 high and 4,150.4 low.
2.2 Daily Structure
Monday printed a lower high and a lower low against Friday: the 4,198.9 high sits 60.1 points beneath Friday's 4,259.0, and the 4,150.4 low sits 3.4 points beneath Friday's 4,153.8. The low was the lowest since the 4,145.2 low of 09/29. The sequence of session highs over the last six sessions reads 4,315.8, 4,218.1, 4,251.2, 4,222.8, 4,259.0 and 4,198.9, and the sequence of session lows reads 4,143.1, 4,145.2, 4,178.2, 4,169.4, 4,153.8 and 4,150.4.
The prior week, September 28 through October 2, spanned 4,315.8 to 4,143.1, and Monday traded inside it. The one-month low of 4,143.1 from 09/28 sits 13.7 points beneath the settle, and the one-month high of 4,488.8 from 09/08 sits 332.0 points above it. The 52-week low of 4,015.6 and the 13-week low of 4,019.0 are the deeper references. No prior-quarter high or low is available, so the 13-week extremes serve as the available quarterly reference.
2.3 4-Hour and Swing Structure
Settlements over the last seven sessions ran 4,321.2, 4,168.4, 4,179.7, 4,186.7, 4,202.3, 4,162.3 and 4,156.8, after 4,298.0 on 09/24. Daily ranges for the last seven sessions ran 62.4, 172.7, 72.9, 73.0, 53.4, 105.2 and 48.5.
The retracement grid published for Tuesday places the 38.2 percent retracement from the four-week low at 4,275.2, the 50 percent retracement of the four-week range at 4,316.0 and the 38.2 percent retracement from the four-week high at 4,356.7. The 38.2 percent retracement from the 13-week low sits at 4,300.2. No four-hour series is available; the 30-minute series in section 2.1 is the only intraday evidence used.
2.4 Moving Averages
The averages cited here were computed from the provider's daily settlement series for the December contract, which holds 259 completed sessions through Monday. The 5-day average stands at 4,177.6, the 9-day at 4,221.5, the 20-day at 4,318.3, the 50-day at 4,372.8, the 100-day at 4,355.7 and the 200-day at 4,639.7.
The 4,156.8 settle sits 20.8 points beneath the 5-day average, 64.7 beneath the 9-day, 161.5 beneath the 20-day, 216.0 beneath the 50-day, 198.9 beneath the 100-day and 482.9 beneath the 200-day. The 5-day average fell 2.3 points from Friday's 4,179.9, because the 09/28 settle of 4,168.4 left the window and was replaced by 4,156.8. The 9-day fell 24.4 points from 4,245.9 as the 09/22 settle of 4,376.4 left its window, and the 20-day fell 16.0 points from 4,334.3 as the 09/04 settle of 4,476.6 left.
The 50-day average sits 17.1 points above the 100-day because the older 50 settlements in the 100-day window averaged 4,338.7, lower than the latest 50. The projection grid gives the prices at which each average would be crossed on Tuesday: 4,209.4 for the 9-day, 4,297.6 for the 18-day and 4,419.8 for the 40-day.
2.5 Oscillator and Trend Readings
The oscillator figures below are as published on the provider's technical page dated for the Tuesday session, read after the 6:00 PM ET reopen; the page may carry the live Globex price in place of the settle, so they are quoted as published. Relative strength reads 27.55 on the 9-day, 33.63 on the 14-day and 38.31 on the 20-day.
The stochastics sit at the bottom of their ranges. The 9-day raw stochastic reads 5.18 percent and the 14-day 4.62 percent, with the 14-day %K at 10.35 percent and %D at 13.02 percent. The published grid places the 14-3 day raw stochastic 20 percent threshold at 4,202.4 and the 14-day relative-strength 30 percent line at 4,097.1.
The directional system reads negative direction above positive direction. On the 9-day the directional index reads 28.61 with positive direction at 12.91 and negative direction at 21.19; on the 14-day it reads 19.80 with negative direction at 21.05 over positive at 13.81. Historic volatility reads 18.86 percent on the 9-day and 17.94 percent on the 14-day.
The composite multi-indicator snapshot reads, verbatim, "80% SELL" for the overall average, with current strength "Average" and current direction "Strengthening", and the composite indicator reads "SELL". The short-term group reads "Average: 100% SELL", the medium-term group "Average: 100% SELL" and the long-term group "Average: HOLD". The snapshot history reads "Yesterday 80% SELL", "Last Week 64% SELL" and "Last Month 24% BUY".
2.6 Volatility and Expected Range
The published 14-day average true range stands at 93.3 points, 2.20 percent as published, and the 14-day average daily range at 87.8 points; the 9-day figures are 88.0 and 82.7, and the 20-day figures 96.7 and 91.5. Monday's 48.5 point range was 0.55 times the 14-day average daily range.
Adding and subtracting the 14-day average true range of 93.3 points to and from the 4,156.8 settle frames Tuesday between 4,063.5 and 4,250.1. The published standard-deviation bands are narrower because they are built from five settlements: one deviation spans 4,138.3 to 4,175.3, two spans 4,130.7 to 4,182.9 and three spans 4,124.8 to 4,188.8. These bands describe settlement dispersion, and say nothing about intraday reach.
4.1 Dollar and Real Yields
The dollar index closed at 102.17, up 0.24 points or 0.24 percent, after a session range of 101.86 to 102.54, per the provider's quote, and provider commentary described the close as a 1.5-year high driven by political turmoil in France and Spain weighing on the euro. A news-feed article at 11:45 AM ET tied the move to French debt concerns. The ten-year yield index closed at 5.31 percent, up four basis points; provider commentary said the ten-year yield touched a 24-year high during the session. No real-yield series is available, so the nominal yield is the measured channel.
4.2 Fed and Monetary Policy
The services survey at 10:00 AM ET printed 54.9 against a 55.0 forecast and 55.4 previously, with its employment component at 50.1 against 48.8, per the news-feed calendar. Provider commentary said the prices-paid component rose 1.4 points to 74.0, a four-year high, and called it hawkish for policy. A news-feed article at 3:00 PM ET described gold as stalling below 4,150 dollars as rising yields offset relief from softer policy expectations. Investment-bank commentary on the news feed said the September employment data point to less urgency for further hikes. The minutes of the September policy meeting are scheduled for 2:00 PM ET on October 7, 2026, which the calendar lists.
4.3 Geopolitical Backdrop
After the settle, the news feed carried a Treasury notice at 3:38 PM ET that foreign banks may be sanctioned for business with Iran, and at 4:12 PM ET a Houthi statement claiming three military operations in Saudi Arabia, with no Saudi confirmation. Between 3:21 PM ET and 3:31 PM ET the President said he was always open to direct talks with Iran and that a specific threat had prompted bombers to be withdrawn from a base in the United Kingdom. These are statements carried by the news feed and are unconfirmed beyond it, and none of them preceded the 1:30 PM ET settle.
4.4 China and Structural Demand (Central Bank Buying, Reserve Data, Fund Flows)
No central bank purchase figure, Chinese import figure or fund holdings series is available, so none is asserted. The gold fund closed at 379.55, down 0.16 percent, per the provider's quote; that is a price figure, and it carries no holdings information.
4.5 Energy and Cross-Asset
November crude settled at 89.43, down 1.84 percent, and Brent's December contract at 100.32, down 1.89 percent; provider commentary said the crude decline eased inflation expectations and limited the dollar's gain. Silver's December contract settled at 61.300, up 0.885 or 1.46 percent, so the gold-to-silver ratio fell to 67.81 from 68.90. The S&P 500 cash index closed at 7,773.95, up 0.66 percent, and the volatility index at 15.52.
4.6 Institutional Positioning (Futures Report, Fund Holdings, Speculator Length)
The latest positioning report on the provider's overview is the one as of September 29, 2026: managed money long 131,711 contracts against short 11,393, a net long of 120,318, with commercials 58,831 long against 309,798 short. The provider overview shows that September 29 report as its latest, so no change in positioning is asserted for Monday. Open interest on the December contract reads 324,063, which is Friday's figure; Monday's had not been reported at the time of reading.
On the provider's dated daily rows, the December contract traded 109,640 contracts on 10/05, whose open interest is not yet reported, 169,001 contracts on 10/02 with open interest of 324,063, and 130,846 contracts on 10/01 with open interest of 323,698.
5. Gold Fund Options Context (Proxy)
The gold fund's positioning console, read at about 6:21 PM ET, is used qualitatively only. The fund closed at 379.55, down 0.16 percent, per the provider's quote, against a 380.14 previous close; the console row showed 379.55 and a 380.18 previous close, while the console's summary panel, marked as updated 2026-10-03, still carried a 382.78 previous close from Thursday. The console row shows call gamma of minus 229 million against put gamma of 158 million, and attributes 3.76 percent of the fund's gamma and 0.42 percent of its delta to the nearest expiration, so only a small share of positioning rolls off at the next expiry and, in the review's interpretation, no expiry-driven pinning is inferred for Tuesday.
Tonight's desk note carried no commentary on the gold fund. The console's high and low volatility point fields are treated as low-confidence and excluded, and no fund level is translated into a futures price.
The proxy caveat stands in any case: the gold fund is a proxy for the futures contract, used qualitatively only, and its levels are never translated into futures prices. The primary edge for gold is the dollar, yield and policy complex in section 4.
6. Forecast, session by session
Night Session (6:00 PM ET Monday to 3:00 AM ET Tuesday, Globex and Asia). The contract reopened at 6:00 PM ET Monday with the Iran sanctions notice and the Houthi claim both arriving after the settle. German industrial orders are listed at 2:00 AM ET, per the news-feed calendar and unconfirmed. Monday's Asian hours ranged between 4,152.3 and 4,191.0, so the overnight window has shown two-way swings. Bias neutral to lower beneath the 4,168.7 Pivot Point, expected Globex band roughly 4,140 to 4,185.
London Session (3:00 AM to 8:00 AM ET Tuesday). The United Kingdom construction survey is listed at 4:30 AM ET and euro area retail sales at 5:00 AM ET, both per the news-feed calendar and unconfirmed. Monday's high printed in the 4:00 AM ET bar, so the London window carries the most recent evidence of buying. The euro's direction after Monday's French debt concerns is the cross-read through the dollar. Bias neutral, expected band roughly 4,145 to 4,190.
Morning Session (9:30 AM to 12:00 PM ET Tuesday, US Open). The trade balance is scheduled for 8:30 AM ET, which the calendar lists. A regional Federal Reserve president is listed at 9:05 AM ET, per the news-feed calendar and unconfirmed, and the Vice Chair for Supervision speaks at 10:45 AM ET, which the calendar lists. Monday's decline ran from the 9:00 AM ET bar to the 11:00 AM ET bar, so, in the review's reading, the morning is where the yield channel last reached gold. Expected band roughly 4,135 to 4,185, with the 4,138.3 to 4,143.1 band the first support.
Afternoon Session (12:00 PM to 4:00 PM ET Tuesday). A three-year note auction is listed at 1:00 PM ET and a regional Federal Reserve president at 1:15 PM ET, both per the news-feed calendar and unconfirmed. Gold settles at 1:30 PM ET. The auction's reception reaches gold through yields. Expected band roughly 4,135 to 4,180.
Night Session Forward (6:00 PM ET Tuesday). A regional Federal Reserve president is listed at 7:00 PM ET Tuesday, per the news-feed calendar and unconfirmed. The minutes of the September policy meeting follow at 2:00 PM ET on October 7, 2026, which the calendar lists.
Expected Range (Tuesday full session). Low-range scenario 4,140 to 4,185. Mid-range scenario, the most likely, 4,125 to 4,200. High-range scenario 4,090 to 4,235.
Most Likely Path. In the review's analyst judgment the most probable path keeps the contract beneath the 4,168.7 Pivot Point and the 4,177.6 5-day average, with a test of the 4,143.1 one-month low and the 4,138.3 to 4,138.5 pairing of one standard deviation support and Pivot S1 weighted above a recovery through Pivot R1 at 4,187.0. That weighting rests on the settle beneath every settlement average, the "80% SELL" composite snapshot with direction "Strengthening", negative direction above positive on the directional system, and a dollar at a 1.5-year high per provider commentary. The alternative that would invalidate this reading is a fall in yields after the 1:00 PM ET auction or a Gulf escalation that carries the contract through the 4,198.9 Monday high.
7. Tuesday Economic Calendar
The Tuesday session reopened at 6:00 PM ET Monday. German industrial orders are listed at 2:00 AM ET, the United Kingdom construction survey at 4:30 AM ET and euro area retail sales at 5:00 AM ET, all per the news-feed calendar and unconfirmed.
The United States morning carries the trade balance at 8:30 AM ET, which the calendar lists, a regional Federal Reserve president at 9:05 AM ET, per the news-feed calendar and unconfirmed, and the Vice Chair for Supervision at 10:45 AM ET, which the calendar lists. The short-term energy outlook is scheduled for 12:00 PM ET, which the calendar lists. A three-year note auction is listed at 1:00 PM ET, a regional Federal Reserve president at 1:15 PM ET and another at 7:00 PM ET, all per the news-feed calendar and unconfirmed. Gold settles at 1:30 PM ET.
In the review's judgment the single first-order event for gold on Tuesday is the 1:00 PM ET three-year note auction, per the news-feed calendar and unconfirmed, because the ten-year yield closed near a 24-year high per provider commentary and the yield channel drove Monday's decline. The minutes of the September policy meeting follow at 2:00 PM ET on October 7, 2026, which the calendar lists.
8. Primary Trade Setup
Direction: Short
Rationale: Monday settled at 13.2 percent of its range at the lowest settle since 08/04, the contract sits beneath every settlement average from the 5-day to the 200-day, and the composite snapshot reads "80% SELL" with direction "Strengthening"; a rally into Pivot R1 offers a short with a defined risk point above the Monday high. Oscillators are already at the bottom of their ranges, so the setup is an analyst judgment that the dollar and yield channel outweighs oversold readings.
Entry Zone: 4,182 to 4,190
Stop Loss: 4,212 (above the 4,198.9 Monday high and the 4,202.4 stochastic 20 percent threshold, beneath Pivot R2 at 4,217.2)
Target 1: 4,160 (3.2 points above the 4,156.8 Monday settle)
Target 2: 4,134 (4.3 points beneath one standard deviation support at 4,138.3)
Target 3 (extended): 4,108 (10.9 points above the 4,097.1 relative-strength 30 percent line)
Risk-to-Reward: Approximately 1:1 to T1, 1:2 to T2, 1:3 to T3, measured from the 4,186 entry midpoint.
Invalidation: A settle above the 4,198.9 Monday high negates the thesis. Short of that, the edge is removed by acceptance above 4,200, defined as two consecutive 30-minute closes above 4,200.
Macro override: A sharp fall in yields after the 1:00 PM ET auction, a reversal in the dollar, or a Gulf escalation would restore gold's bid. In that scenario the short is wrong immediately, and the 4,221.5 9-day settlement average and Pivot R3 at 4,235.5 become the references within one 14-day average true range of 93.3 points.
Sources and methodology
This outlook is built from our session review of the December COMEX gold contract, GCZ26, the December '26 contract, prepared after Monday's close on October 5, 2026 for the Tuesday, October 6 session. The contract domain was checked before any level was used: the daily chart's current Tuesday bar and its stated change return a prior close of 4,156.8, equal to the provider's published previous close of 4,156.8, and the chart's completed Monday bar equals the provider's settlement row, so chart and data sit on the same December contract. The Globex session reopened at 6:00 PM ET Monday, so the day high, day low and open on the provider's overview belong to the Tuesday session and are not used as Monday's range. Data reading began at 6:18 PM ET.
Monday's extremes are the completed-session inputs behind the published pivot ladder, back-solved from its outer pairs and verified against all seven published rungs; the 30-minute series shows the 4,198.9 high in the 4:00 AM ET bar and the 4,150.4 low in the 11:00 AM ET bar. Bar times are bar starts. Every intraday ordering claim rests on the preserved 30-minute provider series, and Monday's short was scored only against the dated 10/05 row and that series. Volume and open interest are taken from the provider's dated daily rows: 109,640 contracts on the 10/05 row, whose open interest is not yet reported; 169,001 contracts and 324,063 of open interest on 10/02, a row our Monday outlook carried as a preliminary 164,881 contracts with no open interest. The settlement averages were computed from the 259 completed settlement rows, all oscillator readings are cited as published, and the composite read and its snapshot history are quoted verbatim. The volatility-index percentage change is computed from its 15.31 prior close. The gold exchange-traded fund is used qualitatively only; no level in this outlook originates in it, and its two volatility-point fields are excluded. Scenario ranges and path weightings are analyst judgment. Items marked per the news-feed calendar and unconfirmed carry that qualification exactly as the review states it. A real-yield series, a four-hour series, central bank purchase data, Chinese import data, fund holdings and a prior-quarter high and low were not available, and no figure is stated for any of them.
Monday’s outlook for this contract is here, and Monday’s crude read is here. Outlooks for ES, NQ, GC and CL are collected on the market outlook page, and our forward trading record is on the performance statement.



