
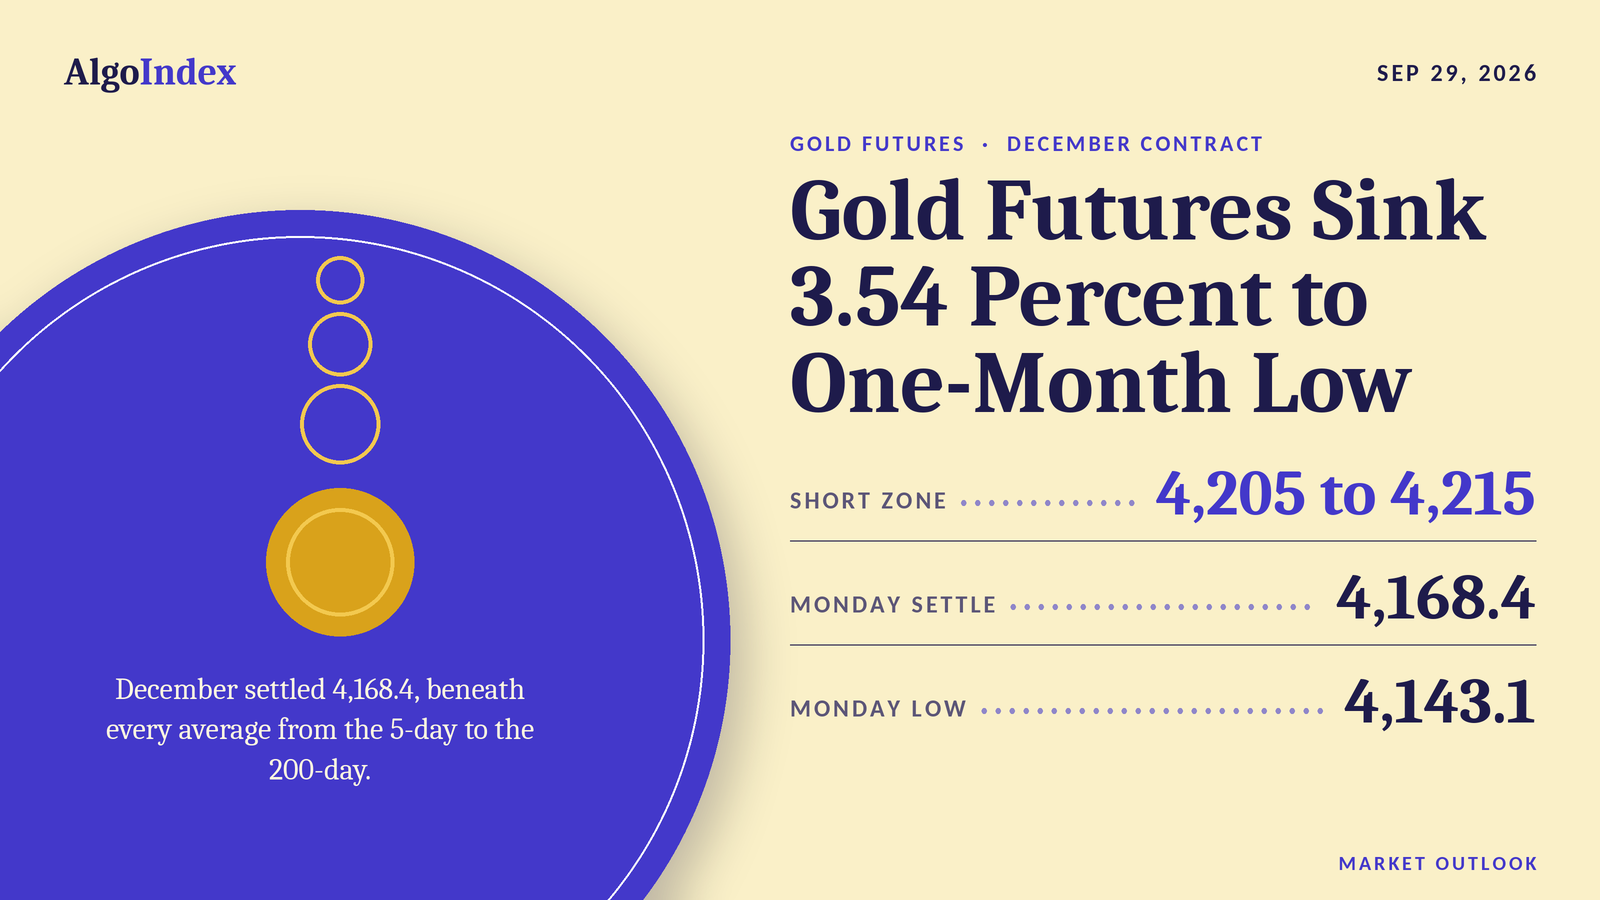
In the 30-minute bar that began at 10:30 AM ET on Monday, December gold fell 32.3 points, from 4,175.4 to 4,143.1. That was the low of a 172.5 point session. The contract settled at 4,168.4 at 1:30 PM ET, down 152.8 points or 3.54 percent from Friday's 4,321.2. It was the largest one-day loss since the 155.1 point drop of 06/10, and the lowest settle since the 4,152.6 settle of 08/04. The settle finished at 14.7 percent of the range. The 4,143.1 low equals the one-month low the provider dates to 09/28/26.
The move ran with rates and the dollar. The ten-year yield index closed at 5.24 percent, up 6 basis points, after a 5.27 percent high that provider commentary described as a 19-year high. The dollar index rose 0.23 percent to 101.20. Provider commentary cited market pricing of a 70 percent chance of a quarter-point increase at the October 27 to 28 policy meeting. Those moves coincided with gold's decline across the day. No time-stamped yield series was captured, so no causal ordering between them is claimed. Monday's range was 1.77 times the published 14-day average daily range of 97.7 points, and the widest since the 193.0 point session of 08/28. Tuesday's primary setup is a short from 4,205 to 4,215, in the band around the 4,209.0 Pivot Point.
December gold settled at 4,168.4, 25.3 points above Monday's 4,143.1 low. The first overhead references are the Pivot Point at 4,209.0 and the 4,210.5 threshold for a 20 percent stochastic reading, 40.6 and 42.1 points above the settle, with the 4,221.2 stall point for the 14-day %k just above them. The settle sits beneath every settlement average, from the 5-day at 4,296.5 to the 200-day at 4,646.7. The composite reads "64% SELL", with Current Direction "Strengthening". The 14-day raw stochastic reads 7.51 percent. The primary setup is a short from 4,205 to 4,215, stop 4,265, targets 4,155, 4,100 and 4,045. Tuesday's first-order event is the job openings report at 10:00 AM ET, per the verified forward calendar.
Friday's short, scored against the bar
Our Friday outlook set a short from 4,324 to 4,336, stop 4,368, with targets at 4,292, 4,254 and 4,216. Friday's completed bar ran from 4,289.2 to 4,351.6. That range covered the whole entry band. The high cleared the top of the band by 15.6 points, and the low sat 34.8 points beneath its bottom. The session opened at 4,309.5, 14.5 points beneath the band. The 4,368 stop stayed 16.4 points above the high. It was never reached.
The targets split. The 4,289.2 low went 2.8 points through the 4,292 first target. The second target at 4,254 stayed 35.2 points beneath the low, and the third, at 4,216, stayed 73.2 points beneath it. A daily bar does not record whether its low came before or after its high. So it cannot show whether the first-target print followed a trade inside the band, and that print carries no result for the card. Friday settled at 4,321.2, 2.8 points beneath the band and 46.8 points beneath 4,368, the settle line the card named as its invalidation. The card's second test was two consecutive 30-minute closes above Thursday's 4,338.0 high. Friday's high went 13.6 points beyond that line. Tonight's review carries no Friday 30-minute series. The bar alone cannot settle that test.
The scoring uses the dated 2026-09-25 row of the provider's daily record. It reads 4,309.5, 4,351.6, 4,289.2 and 4,321.2, on 140,092 contracts, with open interest of 322,500. Tonight's review states the same high, low, settle and open interest. Friday rose 23.2 points on the day, the only higher settle in six sessions. No outlook was published for Monday's session.
Monday started at the top. The contract opened at 4,315.0 at the Sunday 6:00 PM ET reopen, 6.2 points beneath Friday's settle. The first 30-minute bar marked the session high of 4,315.6, and nothing after it traded higher. By the close of the 8:30 PM ET bar the contract traded at 4,264.6, by the 2:00 AM ET bar at 4,202.2 and by the 4:00 AM ET bar at 4,177.0. The review's summary has it reaching 4,175.4 in that 4:00 AM ET bar. The decline was persistent, through the Asian and European hours.
Then the contract held a band. From the 4:00 AM ET bar through the 9:00 AM ET bar it traded between 4,172.7 and 4,203.8. The 9:30 AM ET bar ranged from 4,168.0 to 4,193.2. The break came in the 10:30 AM ET bar. A rebound reached 4,181.0 in the 12:00 PM ET bar and faded into the 1:30 PM ET settle at 4,168.4. After the settle, the 3:30 PM to 4:30 PM ET bars traded between 4,144.2 and 4,168.7, so post-settlement trade held above the session low. It drifted to 4,148.5 by the close of the 4:30 PM ET bar. The preserved provider series holds 46 bars, from the reopen through that 4:30 PM ET bar.
Those extremes carry a provenance note. They are the completed-session inputs behind the published pivot ladder, back-solved from its outer pairs and verified against every rung. The third resistance point at 4,447.5 less the third support point at 3,930.0, divided by three, returns 172.5. The second pair, 4,381.5 less 4,036.5, divided by two, returns the same 172.5. Three times the 4,209.0 Pivot Point less the 4,168.4 settle gives a high-plus-low sum of 8,458.6. The pair of 4,315.6 and 4,143.1 then reproduces all seven published rungs. The chart's completed Monday daily bar reads 4,315.0, 4,315.6, 4,143.1 and 4,168.4. The dated 2026-09-28 row of the provider's daily record carries 221,267 contracts as captured and no open-interest figure yet, so no Monday change in open interest is asserted.
The bar sits beneath Friday's on both extremes. Its 4,315.6 high is 36.0 points beneath Friday's 4,351.6 high, and its 4,143.1 low is 146.1 points beneath Friday's 4,289.2 low. The settle landed 120.8 points beneath Friday's low and 25.3 points above Monday's own low. Friday had covered 62.4 points. Thursday and Friday together covered 122.1.
Five lower settles in six sessions, and every average overhead
The prior week, September 21 through September 25, spanned 4,422.1 to 4,278.3. Monday's entire range sits beneath that week's low except for its top 37.3 points. Across five sessions the contract lost 215.5 points, or 4.92 percent, from the 4,383.9 settle of 09/21. The one-month high of 4,558.5, set on 09/03/26, sits 390.1 points above the settle. The 13-week low of 4,015.6, set on 06/30/26, sits 152.8 points beneath it. No prior-quarter high or low was captured this run, so the 13-week extremes serve as the available quarterly reference. The provider's overview lists the 13-week high at 4,755.0, set on 08/25/26. Further out, the 52-week high of 5,781.8 stands 1,613.4 points above the settle, and the 52-week low of 3,953.0 sits 215.4 points beneath it.
Read the settlements in order. After the 09/18 settle of 4,424.9 they run 4,383.9, 4,376.4, 4,318.4, 4,298.0, 4,321.2 and 4,168.4. Five lower settles in six sessions. Friday was the only higher one. Daily ranges for those six sessions ran 61.8, 86.5, 96.8, 59.7, 62.4 and 172.5.
Four retracement references now sit overhead. The grid published for Tuesday places the 38.2 percent retracement from the four-week low at 4,301.8 and the 38.2 percent retracement from the 13-week low at 4,298.1. The 50 percent retracement of the four-week range sits at 4,350.8, and the 38.2 percent retracement from the four-week high at 4,399.8. The settle sits beneath all four. No four-hour series was captured this run. The 30-minute series is the only intraday evidence used.
Every average is overhead. The figures were computed this run from the provider's daily settlement series for the December contract. That series holds 259 completed sessions through Monday. The 5-day average stands at 4,296.5, the 9-day at 4,342.0, the 20-day at 4,389.4, the 50-day at 4,368.2, the 100-day at 4,387.6 and the 200-day at 4,646.7. The settle sits 128.1 points beneath the 5-day, 221.0 beneath the 20-day, 199.8 beneath the 50-day and 478.3 beneath the 200-day. From highest to lowest the stack reads 200-day, 20-day, 100-day, 50-day, 9-day and 5-day. The 20-day sits only 1.8 points above the 100-day.
One average moved up. The 50-day rose to 4,368.2 from 4,366.3 on Friday despite Monday's loss. The settle that left its window, 4,075.8 on 07/17, was 92.6 points lower than Monday's 4,168.4, and that adds 1.9 points to a 50-session mean. The 20-day sitting above the 50-day means the latest 20 settles averaged higher than the latest 50. So the 30 settles between them, which run from 07/20 to 08/28, averaged lower than the most recent 20. The 5-day average fell 43.1 points and the 20-day 18.1. The projection grid gives Tuesday's crossing prices at 4,336.4 for the 9-day, 4,382.1 for the 18-day and 4,437.5 for the 40-day.
The oscillators sit low. The oscillator figures are as published on the provider's technical page dated for the Tuesday session. That page was read after the 6:00 PM ET reopen, so the most recent value in each may include live Globex trade in place of the settle. Relative strength reads 24.96 on the 9-day, 32.79 on the 14-day and 38.12 on the 20-day. The published grid places the 14-day relative-strength 30 percent line at 4,110.8 and its 50 percent line at 4,381.9. Stochastics sit at the bottom of their range. The 9-day raw stochastic reads 8.53 percent and the 14-day 7.51 percent. The 14-day %K sits at 13.03 percent and %D at 16.42 percent. The grid places the 14-3 day raw stochastic 20 percent threshold at 4,210.5 and its 30 percent threshold at 4,244.1.
The directional system points down. On the 9-day the directional index reads 24.00, with negative direction at 30.82 against positive direction at 9.16. The 14-day reads 16.69, negative 26.36 over positive 12.02. The composite multi-indicator snapshot, quoted verbatim, reads overall "64% SELL", Current Strength "Good", Current Direction "Strengthening" and Composite Indicator "SELL". The short-term group reads "60% SELL", the medium-term group "50% SELL" and the long-term group "67% SELL". Yesterday it read "40% SELL". Last week, "HOLD". Last month, "72% BUY". The sell reading deepened from the prior session and has moved from a buy reading a month ago.
Monday's range ran far past the averages. The published 14-day average true range stands at 103.5 points, 2.48 percent of the settle, and the 14-day average daily range at 97.7 points. The 9-day figures are 102.3 and 97.3, and the 20-day figures 104.4 and 103.3. Historic volatility reads 21.18 percent on the 9-day and 18.21 percent on the 14-day. A one-range projection from the 4,168.4 settle, using the 14-day average true range, frames Tuesday between 4,064.9 and 4,271.9. The published standard-deviation bands are built from five settlements. One deviation spans 4,091.1 to 4,245.7, two span 4,059.1 to 4,277.7 and three span 4,034.6 to 4,302.2.
Yields at a 5.27 percent high, and no haven bid
Start with the rate channel. The ten-year yield index closed at 5.24 percent, up 6 basis points from Friday's 5.18, after a 5.20 to 5.27 range. The thirty-year closed at 5.56 percent, also up 6 basis points. Provider commentary described the 5.27 percent print as a 19-year high. The dollar index closed at 101.20, up 0.23 points or 0.23 percent, after a 100.98 to 101.31 range. Provider commentary attributed the dollar's gain to wider rate differentials. No real-yield series was captured this run, so the move is described in nominal terms only.
For a non-yielding asset, rising nominal yields and a firmer dollar together are the standard headwind. In our review's interpretation, Monday's 3.54 percent decline is the largest expression of that pressure in the captured history since 06/10.
Policy pricing leaned the same way. Provider commentary cited market pricing of a 70 percent chance of a quarter-point increase at the October 27 to 28 policy meeting. The desk note carried the same 70 percent figure. Provider commentary also reported that a Federal Reserve governor said Monday that the labour market seems well positioned to handle higher interest rates. The Federal Reserve's September projections, per the news feed, showed 12 of 18 officials expecting one more quarter-point increase this year. The policy decision is scheduled for 02:00 PM ET on October 28, per the news-feed calendar and unconfirmed.
Tuesday is crowded with speakers. A vice chair speaks at 11:00 AM ET, a governor at 12:40 PM ET and another governor at 3:00 PM ET, per the verified forward calendar. Regional presidents are listed at 1:00 PM, 1:30 PM and 2:00 PM ET, per the news-feed calendar and unconfirmed.
The Iran negotiations moved in both directions on Monday. Gold did not lift. A press report at 1:11 PM ET said Iran had agreed to halt enrichment in exchange for eased sanctions. After the settle, an Iranian official denied nuclear flexibility at 3:29 PM ET. An explosion was reported at Qeshm Island at 3:56 PM ET. Iranian state television described warning shots at vessels in the Strait of Hormuz at 4:26 PM ET. Post-settlement gold trade in the 3:30 PM to 4:30 PM ET bars held between 4,144.2 and 4,168.7. No bar in that window traded more than 0.3 points above the 4,168.4 settle. The escalation reports after the settle did not produce a measured rebound in the captured bars.
Structural demand is the blind spot tonight. No central-bank purchase figure, People's Bank of China reserve data or exchange-traded fund holdings series was captured this run. The Chinese official manufacturing survey is listed at 9:30 PM ET Tuesday, with a forecast of 50.1 against 49.8, per the news-feed calendar and unconfirmed. The gold exchange-traded fund's 3.94 percent decline on the provider's record is a price, and this outlook does not use it as a holdings flow.
Crude diverged from gold. The November WTI contract settled up 0.21 percent at 92.60, and Brent's November contract rose 0.92 percent to 105.28. Silver's December contract fell 4.76 percent to 61.718, more than gold in percentage terms. The gold exchange-traded fund closed at 377.91, down 3.94 percent on the provider's record. The S&P 500 cash index closed down 0.77 percent at 7,683.69, and the Nasdaq-100 cash index fell 1.08 percent. The volatility index rose 1.20 points to 16.07. In our review's interpretation the session read as a rates-and-dollar liquidation across metals, with no flight to safety, since equities fell and the escalation headlines did not lift gold.
Then positioning. The report as of September 22, 2026 shows managed money long 135,699 contracts, down 6,695 on the week, against short 8,310, down 968. That is a net long of 127,389. Swap dealers held 14,626 long against 250,752 short, and producers held 17,719 long against 44,496 short. The report predates the entire decline since 09/22 and Monday's session. Open interest on the December contract stood at 322,500 on Friday's row, up 5,048 from Thursday's 317,452. Monday's row carries no open-interest figure yet. A managed-money book that is overwhelmingly long is, in our review's interpretation, the population most exposed to a rates-driven decline. No liquidation figure was captured.
The bullion fund is read qualitatively only. It tracks bullion with a fee drag and at a ratio that has no clean basis to the futures contract, so no level from it becomes a futures price. The positioning console for the fund, dated as updated on 2026-09-26, showed a current price of 378.07 in its watchlist row against a previous close of 393.35, on 6,672,426 shares. Call gamma read minus 321 million dollars and put gamma 191 million dollars. The console's summary header showed a previous close of 391.73, which equals Thursday's value and is treated as stale. The provider's end-of-day record shows a 377.91 close against 393.41 on Friday. That conflict is recorded and left unresolved. The console's high-volatility-point and low-volatility-point fields are excluded as low-confidence. Next-expiry gamma slipped to 5.20 percent of the total, from 5.62 percent in the prior session review, and call gamma remains negative. In our review's interpretation, the fund's options book offers little mechanical dampening of further moves.
The trade map for Tuesday
The setup follows the rate channel. Monday's 3.54 percent decline settled at 14.7 percent of a 172.5 point range, beneath every settlement average. The composite reads "64% SELL" with Current Direction "Strengthening". A rebound into the Pivot Point and stochastic threshold group offers a short with defined risk above one standard deviation resistance. The entry zone runs 4,205 to 4,215, around the Pivot Point at 4,209.0 and the 4,210.5 threshold for a 20 percent stochastic reading. It sits 36.6 to 46.6 points above the settle. The stop at 4,265 sits above one standard deviation resistance at 4,245.7 and the 4,244.1 threshold for a 30 percent stochastic reading, and beneath Pivot R1 at 4,275.0. From the 4,210 entry midpoint the stop sits 55 points away. The 14-day average true range is 103.5 points. The 14-day raw stochastic at 7.51 percent is deeply oversold, so the setup is an analyst judgment that trend pressure outweighs the stretch.
The reopen came in lower. The Tuesday session reopened at 4,150.1 at 6:00 PM ET, 18.3 points beneath the settle, extending the post-settlement drift. The provider's overview then showed a high of 4,155.9 and a low of 4,147.8 for the new session. Those values belong to Tuesday and are not used as Monday's range anywhere here. The Reserve Bank of Australia decision is listed at 12:30 AM ET, forecast 4.6 percent against 4.35 percent, per the news-feed calendar and unconfirmed. The overnight question is whether Monday's 4,143.1 low holds. The night session, 6:00 PM ET Monday to 3:00 AM ET Tuesday, carries a mildly lower bias beneath the 4,209.0 Pivot Point. Expected Globex band roughly 4,110 to 4,200.
London runs from 3:00 AM to 8:00 AM ET. Swiss business survey data prints at 3:00 AM ET and Bank of England credit data at 4:30 AM ET, both per the news-feed calendar and unconfirmed. The window matters through the dollar, which closed near its year-to-date highs per investment-bank commentary in the news feed. Bias neutral to lower. Expected band roughly 4,100 to 4,210.
Then the United States morning, 9:30 AM to 12:00 PM ET. The job openings report is scheduled for 10:00 AM ET, per the verified forward calendar. The Conference Board consumer confidence index is listed at the same 10:00 AM ET, with a forecast of 89.1 against 89.4, per the news-feed calendar and unconfirmed. A Federal Reserve vice chair's pre-recorded remarks follow at 11:00 AM ET, per the verified forward calendar. A firm labour reading that lifts yields toward Monday's 5.27 percent high would pressure the 4,102.5 to 4,091.1 group. A soft reading opens a rebound toward 4,209.0 to 4,221.2. Expected band roughly 4,090 to 4,230.
The afternoon, 12:00 PM to 4:00 PM ET, carries a Federal Reserve governor at 12:40 PM ET and another at 3:00 PM ET, per the verified forward calendar. Regional presidents are listed at 1:00 PM, 1:30 PM and 2:00 PM ET, per the news-feed calendar and unconfirmed. The COMEX settlement falls at 1:30 PM ET. Expected band roughly 4,100 to 4,220.
Tuesday evening's Globex session opens at 6:00 PM ET. It leads into Chinese manufacturing survey data at 9:30 PM ET, per the news-feed calendar and unconfirmed. The week's anchors for gold are the personal income and outlays report at 08:30 AM ET on September 30, 2026 and the employment report at 08:30 AM ET on October 2, 2026, both per the verified forward calendar.
The single first-order event for gold on Tuesday is the job openings report at 10:00 AM ET, per the verified forward calendar. It matters through its effect on the ten-year yield after Monday's 5.27 percent high. Three scenario bands frame the full session. The low-range case runs 4,120 to 4,200, the mid-range case, the most likely, 4,090 to 4,245, and the high-range case 4,035 to 4,300.
In our review's analyst judgment, the most probable path holds beneath the 4,209.0 Pivot Point overnight, tests the 4,143.1 low during the Asian or European hours, and meets the 10:00 AM ET labour data with the 4,102.5 to 4,091.1 group as the downside reference. In the same judgment, a settle between 4,091.1 and 4,221.2 is weighted above a settle outside that band. Why? Monday's decline finished at 14.7 percent of its range with the composite read strengthening on the sell side. The 14-day raw stochastic at 7.51 percent argues against an immediate second expansion as large as Monday's. The alternative that would invalidate this reading is a sharp fall in yields after the labour data, which would put the 4,244.1 to 4,277.7 band back in play.
Monday's 172.5 point range settled 25.3 points off its low, and Tuesday reopened beneath that settle with Monday's 4,143.1 low the first support under it.
The complete data picture
Every number behind Tuesday’s plan, charted first, then the full level lists, then the complete numeric reference underneath.
Full numeric reference, every remaining figure from the session review
Carried below in the review's own order: the executive summary from section 1, sections 2.1 to 2.6, the level notes behind sections 3.1 and 3.2, sections 4.1 to 4.6, the fund options context from section 5, the session-by-session forecast from section 6, the Tuesday calendar from section 7 and the primary setup from section 8.
Level notes (3.1 Resistance and 3.2 Support)
The first overhead references are the Pivot Point at 4,209.0 and the 4,210.5 threshold for a 20 percent stochastic reading, 40.6 and 42.1 points above the settle, with the 4,221.2 stall point for the 14-day %k just above them. The stochastic 30 percent threshold at 4,244.1 and one standard deviation resistance at 4,245.7 form the next pair, and Pivot R1 at 4,275.0 sits beside two standard deviations resistance at 4,277.7.
Above that sit the 38.2 percent retracements at 4,298.1 and 4,301.8, three standard deviations resistance at 4,302.2 and the 4,311.5 threshold for a 50 percent stochastic reading, all beneath Monday's 4,315.6 high. The 9-day average crossing at 4,336.4, the 4,350.8 retracement and Pivot R2 at 4,381.5 are the extended references.
Monday's 4,143.1 low is the first support, 25.3 points beneath the settle, and the published target price at 4,122.9 and the relative-strength 30 percent line at 4,110.8 follow. Pivot S1 at 4,102.5 and one standard deviation support at 4,091.1 form the next pair, with the 40-day average stall at 4,090.5 beside them.
Beneath that, the three-and-ten day crossover stall at 4,069.3, two standard deviations support at 4,059.1, Pivot S2 at 4,036.5 and three standard deviations support at 4,034.6 cover 34.7 points. The 13-week low at 4,015.6 and the 52-week low at 3,953.0 are the deeper references, with Pivot S3 at 3,930.0 beyond them.
1. Executive Summary
The December gold contract settled at 4,168.4 on Monday, down 152.8 points or 3.54 percent from Friday's 4,321.2 settle, after a 172.5 point session between 4,315.6 and 4,143.1. The settle finished at 14.7 percent of the range, and the decline was the largest one-day loss since the 155.1 point drop of 06/10. The settle is the lowest since the 4,152.6 settle of 08/04, the 172.5 point range was 1.77 times the published 14-day average daily range of 97.7 points and the widest daily range since the 193.0 point session of 08/28, and the 4,143.1 low equals the one-month low the provider dates to 09/28/26.
The preserved 30-minute series shows that the session high of 4,315.6 printed in the first bar after the Sunday 6:00 PM ET reopen and was never exceeded. The contract declined through the Asian and European hours, reached 4,175.4 in the 4:00 AM ET bar, and broke lower in the 10:30 AM ET bar, which marked the 4,143.1 low. A rebound to 4,181.0 in the 12:00 PM ET bar faded into the 1:30 PM ET settle, and post-settlement electronic trade drifted to 4,148.5 by the close of the 4:30 PM ET bar. The move ran with rates and the dollar: the ten-year yield index closed at 5.24 percent, up 6 basis points, after a 5.27 percent high that provider commentary described as a 19-year high, and the dollar index rose 0.23 percent to 101.20. Provider commentary cited market pricing of a 70 percent chance of a quarter-point increase at the October 27 to 28 policy meeting. Those moves coincided with gold's decline across the day; no time-stamped yield series was captured, so no causal ordering between them is claimed.
Silver's December contract fell 4.76 percent, more than gold in percentage terms, and the gold exchange-traded fund closed at 377.91, down 3.94 percent on the provider's record. The composite multi-indicator read published for Tuesday is "64% SELL", with Current Strength "Good" and Current Direction "Strengthening", against "Yesterday 40% SELL", "Last Week HOLD" and "Last Month 72% BUY". The settle sits beneath every settlement average from the 5-day to the 200-day.
The primary setup is a short from the 4,205 to 4,215 band around the Pivot Point, stopped above one standard deviation resistance, with objectives at 4,155, 4,100 and an extended 4,045.
2.1 Intraday and Session Review
The Monday session opened at 4,315.0 at the Sunday 6:00 PM ET reopen, 6.2 points beneath Friday's settle, marked a high of 4,315.6 and a low of 4,143.1, and settled at 4,168.4 at 1:30 PM ET. The preserved 30-minute provider series, 46 bars from the reopen through the 4:30 PM ET bar, places the high in the opening 6:00 PM ET bar and the low in the 10:30 AM ET bar.
The decline was persistent rather than a single break. By the close of the 8:30 PM ET bar the contract traded at 4,264.6, by the 2:00 AM ET bar at 4,202.2 and by the 4:00 AM ET bar at 4,177.0. From the 4:00 AM ET bar through the 9:00 AM ET bar the contract held between 4,172.7 and 4,203.8. The 9:30 AM ET bar ranged from 4,168.0 to 4,193.2, and the 10:30 AM ET bar fell 32.3 points from its 4,175.4 open to the 4,143.1 low. The 12:00 PM ET bar rebounded to 4,181.0, and the settlement at 1:30 PM ET was 4,168.4. After the settle the 3:30 PM to 4:30 PM ET bars traded between 4,144.2 and 4,168.7, so post-settlement trade held above the session low.
The session extremes used here are also the completed-session inputs behind the published pivot ladder, back-solved from the outer pivot pairs and verified against every rung. The third resistance point at 4,447.5 minus the third support point at 3,930.0, divided by three, returns 172.5, and the second resistance point at 4,381.5 minus the second support point at 4,036.5, divided by two, returns the same 172.5. Three times the Pivot Point of 4,209.0 less the 4,168.4 settle gives a high plus low sum of 8,458.6, and the resulting pair of 4,315.6 and 4,143.1 reproduces all seven published rungs. The chart's completed Monday daily bar reads 4,315.0, 4,315.6, 4,143.1 and 4,168.4, and the provider separately publishes 4,143.1 as the one-month low dated 09/28/26.
Because Globex reopened at 6:00 PM ET, the provider's overview now shows the Tuesday session, with an open of 4,150.1, a high of 4,155.9 and a low of 4,147.8; those values are not used as Monday's range anywhere in this outlook.
2.2 Daily Structure
Monday's bar sits below Friday's on both extremes: the 4,315.6 high is 36.0 points beneath Friday's 4,351.6 high, and the 4,143.1 low is 146.1 points beneath Friday's 4,289.2 low. The settle landed 120.8 points beneath Friday's low and 25.3 points above Monday's own low.
The prior week, September 21 through September 25, spanned 4,422.1 to 4,278.3, and Monday's entire range sits beneath that week's low except for its top 37.3 points. Across five sessions the contract lost 215.5 points or 4.92 percent from the 4,383.9 settle of 09/21. The one-month high of 4,558.5, set on 09/03/26, sits 390.1 points above the settle, and the 13-week low of 4,015.6, set on 06/30/26, sits 152.8 points beneath it.
No prior-quarter high or low was captured this run, so the 13-week extremes serve as the available quarterly reference.
2.3 4-Hour and Swing Structure
The daily settlement sequence after the 09/18 settle of 4,424.9 reads 4,383.9, 4,376.4, 4,318.4, 4,298.0, 4,321.2 and 4,168.4, five lower settles in six sessions with Friday the only higher one. Daily ranges for the last six sessions ran 61.8, 86.5, 96.8, 59.7, 62.4 and 172.5.
The retracement grid published for Tuesday places the 38.2 percent retracement from the four-week low at 4,301.8, the 38.2 percent retracement from the 13-week low at 4,298.1, the 50 percent retracement of the four-week range at 4,350.8 and the 38.2 percent retracement from the four-week high at 4,399.8. The settle sits beneath all four. No four-hour series was captured this run; the 30-minute series in section 2.1 is the only intraday evidence used.
2.4 Moving Averages
The averages were computed this run from the provider's daily settlement series for the December contract, which holds 259 completed sessions through Monday. The 5-day average stands at 4,296.5, the 9-day at 4,342.0, the 20-day at 4,389.4, the 50-day at 4,368.2, the 100-day at 4,387.6 and the 200-day at 4,646.7.
The 4,168.4 settle sits 128.1 points beneath the 5-day average, 221.0 points beneath the 20-day, 199.8 points beneath the 50-day and 478.3 points beneath the 200-day. From highest to lowest the stack reads 200-day, 20-day, 100-day, 50-day, 9-day and 5-day, with the 20-day only 1.8 points above the 100-day. The 20-day sitting above the 50-day means the latest 20 settles averaged higher than the latest 50, so the 30 settles between them, which run from 07/20 to 08/28, averaged lower than the most recent 20.
The 50-day average rose to 4,368.2 from 4,366.3 on Friday despite Monday's loss, because the settle that left its window, 4,075.8 on 07/17, was 92.6 points lower than Monday's 4,168.4, which adds 1.9 points to a 50-session mean. The 5-day average fell 43.1 points and the 20-day 18.1 points.
The projection grid gives the prices at which each average would be crossed on Tuesday: 4,336.4 for the 9-day, 4,382.1 for the 18-day and 4,437.5 for the 40-day.
2.5 Oscillator and Trend Readings
The oscillator figures are as published on the provider's technical page dated for the Tuesday session, which was read after the 6:00 PM ET reopen, so the most recent value in each may include live Globex trade rather than the settle. Relative strength reads 24.96 on the 9-day, 32.79 on the 14-day and 38.12 on the 20-day; the same page lists 44.88 on the 50-day and 47.67 on the 100-day. The published grid places the 14-day relative-strength 30 percent line at 4,110.8 and its 50 percent line at 4,381.9.
Stochastics sit at the bottom of their range. The 9-day raw stochastic reads 8.53 percent and the 14-day 7.51 percent, with the 14-day %K at 13.03 percent and %D at 16.42 percent; the same page lists the 20-day raw stochastic at 6.09 percent and the 9-day %K and %D at 17.38 and 23.67 percent. The published grid places the 14-3 day raw stochastic 20 percent threshold at 4,210.5 and its 30 percent threshold at 4,244.1.
The directional system points down. On the 9-day the directional index reads 24.00 with positive direction at 9.16 and negative direction at 30.82; on the 14-day it reads 16.69 with positive direction at 12.02 against negative at 26.36; the same page lists the 20-day at 13.72, with positive direction at 14.03 against negative at 24.15. Historic volatility reads 21.18 percent on the 9-day and 18.21 percent on the 14-day, and the page lists 20.51 percent on the 20-day.
The composite multi-indicator snapshot captured this run reads, verbatim: overall "64% SELL", Current Strength "Good", Current Direction "Strengthening", Composite Indicator "SELL"; short-term group "60% SELL", medium-term group "50% SELL", long-term group "67% SELL"; snapshot "Yesterday 40% SELL", "Last Week HOLD", "Last Month 72% BUY". The sell reading deepened from the prior session and has moved from a buy reading a month ago.
2.6 Volatility and Expected Range
The published 14-day average true range stands at 103.5 points, 2.48 percent of the settle, and the 14-day average daily range at 97.7 points; the 9-day figures are 102.3 and 97.3, and the 20-day figures 104.4 and 103.3. Monday's 172.5 point range was 1.77 times the 14-day average daily range.
A one-range projection using the 14-day average true range of 103.5 points frames Tuesday between 4,064.9 and 4,271.9 from the 4,168.4 settle. The published standard-deviation bands are built from five settlements: one deviation spans 4,091.1 to 4,245.7, two spans 4,059.1 to 4,277.7 and three spans 4,034.6 to 4,302.2.
4.1 Dollar and Real Yields
The dollar index closed at 101.20, up 0.23 points or 0.23 percent, after a 100.98 to 101.31 range. The ten-year yield index closed at 5.24 percent, up 6 basis points from Friday's 5.18, after a 5.20 to 5.27 range, and the thirty-year closed at 5.56 percent, also up 6 basis points. Provider commentary described the 5.27 percent print as a 19-year high and attributed the dollar's gain to wider rate differentials. No real-yield series was captured this run, so the move is described in nominal terms only.
For a non-yielding asset the combination of rising nominal yields and a firmer dollar is the standard headwind, and in the review's interpretation Monday's 3.54 percent decline is the largest expression of that pressure in the captured history since 06/10.
4.2 Fed and Monetary Policy
Provider commentary cited market pricing of a 70 percent chance of a quarter-point increase at the October 27 to 28 policy meeting. The desk note carried the same 70 percent figure. Provider commentary reported that a Federal Reserve governor said Monday that the labour market seems well positioned to handle higher interest rates. The Federal Reserve's September projections, per the news feed, showed 12 of 18 officials expecting one more quarter-point increase this year. The policy decision is scheduled for 02:00 PM ET on October 28, per the news-feed calendar and unconfirmed.
Tuesday carries a dense Federal Reserve speaker schedule: a vice chair at 11:00 AM ET, a governor at 12:40 PM ET and another governor at 3:00 PM ET, per the verified forward calendar, with regional presidents at 1:00 PM, 1:30 PM and 2:00 PM ET, per the news-feed calendar and unconfirmed.
4.3 Geopolitical Backdrop
The Iran negotiations moved in both directions on Monday and did not lift gold. A press report at 1:11 PM ET said Iran had agreed to halt enrichment in exchange for eased sanctions; after the settle an Iranian official denied nuclear flexibility at 3:29 PM ET, an explosion was reported at Qeshm Island at 3:56 PM ET and Iranian state television described warning shots at vessels in the Strait of Hormuz at 4:26 PM ET. Post-settlement gold trade in the 3:30 PM to 4:30 PM ET bars held between 4,144.2 and 4,168.7, and no bar in that window traded more than 0.3 points above the 4,168.4 settle, so the escalation reports after the settle did not produce a measured rebound in the captured bars.
4.4 China and Structural Demand (Central Bank Buying, Reserve Data, Fund Flows)
No central-bank purchase figure, People's Bank of China reserve data or exchange-traded fund holdings series was captured this run. The Chinese official manufacturing survey is listed at 9:30 PM ET Tuesday with a forecast of 50.1 against 49.8, per the news-feed calendar and unconfirmed. The gold exchange-traded fund's 3.94 percent decline on the provider's record is a price, not a holdings flow, and is not used as one.
4.5 Energy and Cross-Asset
Crude diverged from gold: the November WTI contract settled up 0.21 percent at 92.60 and Brent's November contract up 0.92 percent at 105.28. Silver's December contract fell 4.76 percent to 61.718. The S&P 500 cash index closed down 0.77 percent at 7,683.69 and the Nasdaq-100 cash index down 1.08 percent, at 30,276.81 on the provider's end-of-day record, and the volatility index rose 1.20 points to 16.07. In the review's interpretation the session read as a rates-and-dollar liquidation across metals rather than a flight to safety, since equities fell and the escalation headlines did not lift gold.
4.6 Institutional Positioning (Futures Report, Fund Holdings, Speculator Length)
The positioning report as of September 22, 2026 shows managed money long 135,699 contracts, down 6,695 on the week, against short 8,310, down 968, a net long of 127,389. Swap dealers held 14,626 long against 250,752 short, and producers held 17,719 long against 44,496 short; the provider's overview lists commercials at 57,458 long against 320,361 short. The report predates the entire decline since 09/22 and Monday's session.
Open interest on the December contract stood at 322,500 on Friday's row; Monday's row carries no open-interest figure yet, so no Monday change in open interest is asserted. Monday's row carries 221,267 contracts as captured, against 140,092 on Friday's row. A managed-money book that is overwhelmingly long is, in the review's interpretation, the population most exposed to a rates-driven decline, but no liquidation figure was captured.
5. Bullion Fund Options Flow Context (Proxy)
The gold exchange-traded fund is used here qualitatively only. It tracks bullion with a fee drag and at a ratio that has no clean basis to the futures contract, so no level from it is translated into a futures price anywhere in this outlook.
The positioning console for the fund, dated as updated on 2026-09-26, showed a current price of 378.07 in its watchlist row against a previous close of 393.35, with share volume of 6,672,426, call gamma of minus 321 million dollars and put gamma of 191 million dollars, and next-expiry gamma at 5.20 percent of the total. The console's summary header on the same page showed a previous close of 391.73, which equals Thursday's value and is treated as stale; the provider's end-of-day record shows a 377.91 close against 393.41 on Friday. The conflict is recorded rather than resolved. The console's high-volatility-point and low-volatility-point fields are excluded as low-confidence per the known defect in that pair of fields.
The qualitative read: next-expiry gamma slipped to 5.20 percent of the total from the 5.62 percent recorded in the prior session review, and call gamma remains negative, so in the review's interpretation the fund's options book offers little mechanical dampening of further moves. No gamma-derived level is used for the futures contract, and nothing in the resistance and support lists originates from this proxy.
6. Forecast, session by session
Night Session (6:00 PM ET Monday to 3:00 AM ET Tuesday, Globex and Asia). The Tuesday session reopened at 4,150.1 at 6:00 PM ET, 18.3 points beneath the settle, extending the post-settlement drift. The Reserve Bank of Australia decision is listed at 12:30 AM ET, forecast 4.6 percent against 4.35 percent, per the news-feed calendar and unconfirmed. The overnight question is whether Monday's 4,143.1 low holds. Bias mildly lower beneath the 4,209.0 Pivot Point, expected Globex band roughly 4,110 to 4,200.
London Session (3:00 AM to 8:00 AM ET Tuesday). The European morning carries Swiss business survey data at 3:00 AM ET and Bank of England credit data at 4:30 AM ET, both per the news-feed calendar and unconfirmed. The London window matters through the dollar, which closed near its year-to-date highs per investment-bank commentary in the news feed. Bias neutral to lower, expected band roughly 4,100 to 4,210.
Morning Session (9:30 AM to 12:00 PM ET Tuesday, US Open). The job openings report is scheduled for 10:00 AM ET, per the verified forward calendar, and the Conference Board consumer confidence index is listed at 10:00 AM ET with a forecast of 89.1 against 89.4, per the news-feed calendar and unconfirmed. A Federal Reserve vice chair's pre-recorded remarks follow at 11:00 AM ET, per the verified forward calendar. A firm labour reading that lifts yields toward Monday's 5.27 percent high would pressure the 4,102.5 to 4,091.1 group; a soft reading opens a rebound toward 4,209.0 to 4,221.2. Expected band roughly 4,090 to 4,230.
Afternoon Session (12:00 PM to 4:00 PM ET Tuesday). A Federal Reserve governor speaks at 12:40 PM ET and another at 3:00 PM ET, per the verified forward calendar, with regional presidents at 1:00 PM, 1:30 PM and 2:00 PM ET, per the news-feed calendar and unconfirmed. The COMEX settlement falls at 1:30 PM ET. Expected band roughly 4,100 to 4,220.
Night Session Forward (6:00 PM ET Tuesday). The Tuesday evening Globex session leads into Chinese manufacturing survey data at 9:30 PM ET, per the news-feed calendar and unconfirmed. The week's anchors for gold are the personal income and outlays report at 08:30 AM ET on September 30, 2026 and the employment report at 08:30 AM ET on October 2, 2026, both per the verified forward calendar.
Expected Range (Tuesday full session). Low-range scenario 4,120 to 4,200. Mid-range scenario, the most likely, 4,090 to 4,245. High-range scenario 4,035 to 4,300.
Most Likely Path. In the review's analyst judgment the most probable path holds beneath the 4,209.0 Pivot Point overnight, tests the 4,143.1 low during the Asian or European hours, and meets the 10:00 AM ET labour data with the 4,102.5 to 4,091.1 group as the downside reference. A settle between 4,091.1 and 4,221.2 is weighted above a settle outside that band, because Monday's decline finished at 14.7 percent of its range with the composite read strengthening on the sell side, while the 14-day raw stochastic at 7.51 percent argues against an immediate second expansion as large as Monday's. The alternative that would invalidate this reading is a sharp fall in yields after the labour data, which would put the 4,244.1 to 4,277.7 band back in play.
7. Tuesday Economic Calendar
The Tuesday session reopened at 6:00 PM ET Monday. The Reserve Bank of Australia decision is listed at 12:30 AM ET, forecast 4.6 percent against 4.35 percent, per the news-feed calendar and unconfirmed. The European morning lists Swiss business survey data at 3:00 AM ET and Bank of England consumer credit at 4:30 AM ET, per the news-feed calendar and unconfirmed.
The United States morning carries the job openings report at 10:00 AM ET, per the verified forward calendar, and the Conference Board consumer confidence index at 10:00 AM ET, forecast 89.1 against 89.4, per the news-feed calendar and unconfirmed. A Federal Reserve vice chair speaks at 11:00 AM ET, a governor at 12:40 PM ET and another governor at 3:00 PM ET, per the verified forward calendar, and regional presidents are listed at 1:00 PM, 1:30 PM and 2:00 PM ET, per the news-feed calendar and unconfirmed. Chinese manufacturing survey data follow at 9:30 PM ET, per the news-feed calendar and unconfirmed.
The single first-order event for gold on Tuesday is the job openings report at 10:00 AM ET, per the verified forward calendar, read through its effect on the ten-year yield after Monday's 5.27 percent high. The week's larger tests are the personal income and outlays report on September 30, 2026 and the employment report on October 2, 2026, both at 08:30 AM ET per the verified forward calendar.
8. Primary Trade Setup
Direction: Short
Rationale: Monday's 3.54 percent decline settled at 14.7 percent of a 172.5 point range, beneath every settlement average, with the composite read at "64% SELL" and Current Direction "Strengthening"; a rebound into the Pivot Point and stochastic threshold group offers a short with defined risk above one standard deviation resistance. The 14-day raw stochastic at 7.51 percent is deeply oversold, so the setup is an analyst judgment that trend pressure outweighs the stretch.
Entry Zone: 4,205 to 4,215
Stop Loss: 4,265 (above one standard deviation resistance at 4,245.7 and the 4,244.1 threshold for a 30 percent stochastic reading, beneath Pivot R1 at 4,275.0)
Target 1: 4,155 (11.9 points above Monday's 4,143.1 low)
Target 2: 4,100 (2.5 points beneath Pivot S1 at 4,102.5 and above one standard deviation support at 4,091.1)
Target 3 (extended): 4,045 (above Pivot S2 at 4,036.5 and three standard deviations support at 4,034.6)
Risk-to-Reward: Approximately 1:1 to T1, 1:2 to T2, 1:3 to T3, measured from the 4,210 entry midpoint.
Invalidation: A settle above Pivot R1 at 4,275.0 negates the thesis outright. Short of that, the edge is removed by acceptance above the 4,221.2 stall point for the 14-day %k rather than by a touch, defined as two consecutive 30-minute closes above 4,221.2 with the 4,244.1 threshold for a 30 percent stochastic reading also cleared.
Macro override: A sharp fall in the ten-year yield after the labour data, a reversal in the dollar or a confirmed military escalation in the Strait of Hormuz that finally draws safe-haven demand would invalidate the short in real time. In that scenario the 4,275.0 to 4,302.2 band becomes the reference, within one 14-day average true range of 103.5 points above the 4,210.0 entry midpoint.
Sources and methodology
This outlook is built from our session review of the December COMEX gold contract, GCZ26, the December '26 contract, prepared after Monday's close on September 28, 2026 for the Tuesday, September 29 session. The contract domain was checked before any level was used: the 30-minute chart title read 4,154.9 with a stated change of minus 0.32 percent, which returns 4,168.4, equal to the provider's published previous close of 4,168.4, and the chart's completed Monday daily bar equals the provider's settlement row, so chart and data sit on the same December contract. Because Globex reopened at 6:00 PM ET, the day high, day low and open on the provider's overview belong to the Tuesday session and are not presented anywhere here as Monday's range. Collection began at 6:16 PM ET, and every catalyst whose release time had passed by then is recorded as completed.
Monday's extremes are the completed-session inputs behind the published pivot ladder, back-solved from its outer pairs, verified against all seven published rungs and reproduced by the chart's daily bar and the provider's dated one-month low. Every intraday ordering claim rests on the preserved 30-minute provider series. Volume and open interest are taken from the provider's dated daily rows: 221,267 contracts on the 09/28 row as captured, whose open interest was not yet published; 140,092 contracts and 322,500 of open interest on 09/25; and 164,814 contracts and 317,452 of open interest on 09/24, a row that Friday's outlook carried as a preliminary 161,085 contracts. Friday's short was scored only against the dated 09/25 row, which agrees with the Friday high, low and settle stated in the review. The settlement averages were computed from the 259 completed settlement rows, all oscillator readings are cited as published, and the composite read and its snapshot history are quoted verbatim. The 50-day and 100-day relative strength, the 20-day raw stochastic, the 9-day %K and %D, the 20-day directional figures and the 20-day historic volatility are taken from the same published technical page, and the 52-week extremes, the 13-week high and the commercials line from the provider's overview. The bullion exchange-traded fund is used qualitatively only; no level in this outlook originates in it, and its two volatility-point fields are excluded. Scenario ranges and path weightings are analyst judgment. Items marked per the news-feed calendar and unconfirmed, or per the verified forward calendar, carry that qualification exactly as the review states it. A time-stamped yield series, a real-yield series, a four-hour series, central bank purchase data, reserve data, fund holdings and a prior-quarter high and low were not captured in this run, and no figure is stated for any of them.
Friday’s outlook for this contract is here, and Friday’s crude read is here. Outlooks for ES, NQ, GC and CL are collected on the market outlook page, and our forward trading record is on the performance statement.



