
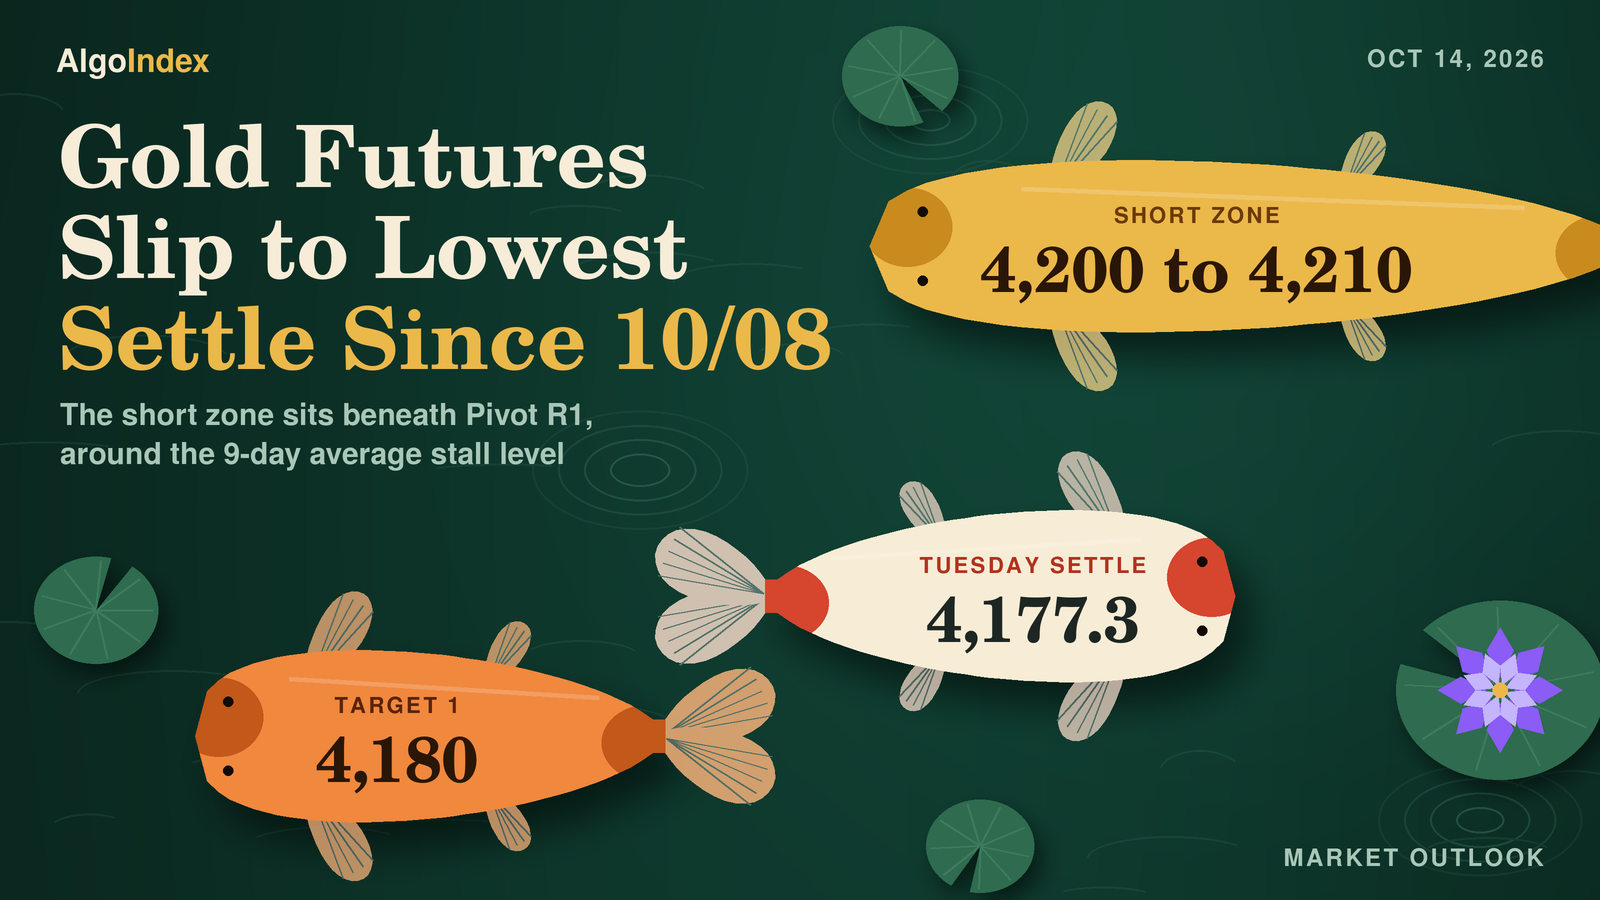
At 4,224.8, December gold's Tuesday high stopped 1.2 points beneath 4,226, the bottom of the short band we set for the session. The contract settled at 4,177.3, down 13.3 points or 0.32 percent from Monday's 4,190.6. It printed a lower high and a lower low against Monday. The settle landed at 13.8 percent of a 55.1 point range. It was the second lower settle in a row, and the lowest since the 4,157.0 settle of 10/08.
Gold fell on a day the dollar index closed at 102.18, down 0.41 from Monday's 102.59, and the ten-year yield index eased to 5.22 percent from 5.24 percent. Provider commentary said the dollar was pressured by Federal Reserve comments it described as dovish. Silver fell harder. December silver settled at 59.525, down 1.63 percent, and the gold-to-silver ratio rose to 70.18 from 69.25. Wednesday's primary setup is a short from 4,200 to 4,210, around the 9-day average stall level at 4,202.3 and one standard deviation resistance at 4,206.6.
December gold settled at 4,177.3, 13.3 points beneath the 4,190.6 Pivot Point. It sits 0.9 above the 5-day settlement average and 0.6 above the 9-day, and beneath the 20-day through 200-day. The primary setup is a short from 4,200 to 4,210, with the 9-day average stall level at 4,202.3 and one standard deviation resistance at 4,206.6 inside the band and Pivot R1 at 4,211.5 just above it, stop 4,230 above Tuesday's 4,224.8 high, targets 4,180, 4,155 and an extended 4,130. The band sits above the market. The settle is 22.7 points beneath its bottom, and the Wednesday session was quoted at 4,183.7 at 6:12 PM ET. Negative direction leads on both directional windows and the composite reads "64% SELL". The September consumer price index prints at 8:30 AM ET on Wednesday, as the calendar lists it, and gold settles at 1:30 PM ET.
Tuesday's 4,224.8 high stopped 1.2 points beneath the short band, which never traded
In Tuesday’s outlook we set a short from 4,226 to 4,236, stop 4,256, with targets at 4,206, 4,181 and an extended 4,156. Its reopen status line put the contract near 4,197.5 at 6:20 PM ET, 28.5 points beneath the band. Tuesday's bar, from the review and the dated 10/13 row of the provider's daily record, opened at 4,195.5 at the Monday 6:00 PM ET reopen, marked a high of 4,224.8 and a low of 4,169.7, and settled at 4,177.3. The band never traded. The high stopped 1.2 points short of 4,226.
Two target levels printed anyway, as price only. The 4,206 first target sat 10.5 points above the 4,195.5 open, and the low went 36.3 points beneath it. The low also went 11.3 points beneath the 4,181 second target, and the settle finished 3.7 under it. The extended 4,156 never printed. The low held 13.7 points above it. With the entry band untouched, these prints describe the bar alone. No fill and no result is asserted.
Neither exit clause came into play. The card named a settle above Monday's 4,242.3 high as its invalidation, and the 4,177.3 settle finished 65.0 points beneath it. Its acceptance test needed two consecutive 30-minute closes above the 18-day crossing at 4,239.5. The high sat 14.7 points beneath that line, so no such close could print. No gap reached the 4,256 stop either. The reopen printed 4,195.5, 60.5 points beneath it.
The path call held on its levels. Our Tuesday outlook weighted a hold between two standard deviations support at 4,148.5 and Monday's 4,242.3 high. The low held 21.2 points above the first and the high stayed 17.5 beneath the second. It also weighted a rally toward the band that fails beneath Monday's high above a sustained break higher. No break came. The high stopped 1.2 short of the band, and the settle finished 47.5 beneath the high. The daily bar cannot show whether the high or the low came first.
Our range work held. All three scenarios contained the session. The low-range case of 4,165 to 4,229 was the tightest fit, with 4.7 points to spare at the low and 4.2 at the high. The most likely case of 4,148 to 4,242 held the low 21.7 points above its bottom and the high 17.2 beneath its top. The high-range case of 4,103 to 4,278 and the 4,103.4 to 4,277.8 average-true-range envelope held it too. Two standard deviations, 4,148.5 to 4,232.7, held the day with 7.9 points to spare at the high; one deviation did not, the high 4.5 above 4,220.3.
The session bands split on what the record can show. London's 4,160 to 4,232, the morning's 4,150 to 4,240 and the afternoon's 4,145 to 4,245 each contained the whole 4,169.7 to 4,224.8 range, so they held whatever the path. The Globex band of 4,170 to 4,225 cannot be scored. Its top sat 0.2 above the high. The 4,169.7 low sits 0.3 beneath its bottom, and no record says when that low printed. The first 30-minute bar after the reopen, 4,195.4 to 4,201.7, sat inside the band.
The macro override named a Gulf escalation that revives haven demand, or a reversal lower in the dollar. The dollar did move lower. The index closed at 102.18, down 0.41 from 102.59. Gold fell on the same day, and no price leg came. The high stayed 31.2 points beneath the 4,256 stop. The news feed carried a Houthi warning at 8:40 AM ET to evacuate areas near the Saudi energy company's facilities. The news feed's reports of booms near the company's Dhahran headquarters, carried between 2:34 PM ET and 2:43 PM ET, came after the 1:30 PM ET settle. We grade the card as written.
One row anchors the score. The dated 2026-10-13 row of the provider's daily record reads 4,195.5, 4,224.8, 4,169.7 and 4,177.3 on 121,310 contracts, with open interest not yet reported. The review states the same figures. Monday's 2026-10-12 row was revised. It now carries 102,772 contracts, against the preliminary 100,244 our Tuesday outlook carried, and open interest of 318,078, down 1,095 from Friday's 319,173.
The 4,200 to 4,210 band, Pivot R1 at 4,211.5 and Tuesday's 4,224.8 high
Resistance starts 6.4 points up. The 3-10 day crossover stall level at 4,183.7 comes first, then the published target price at 4,190.2 and the Pivot Point at 4,190.6, which matches Monday's settle to the tenth. Tuesday's 4,195.5 open sits just above. Then comes the band that anchors the setup. The 9-day average stall level at 4,202.3 and one standard deviation resistance at 4,206.6 sit inside it, 4.3 points apart. Pivot R1 at 4,211.5 sits 1.5 above its top.
Next is the stop zone. Two standard deviations resistance at 4,218.8 and the momentum projection level at 4,221.4 come first. The 38.2 percent retracement from the four-week low at 4,224.4, Tuesday's 4,224.8 high and the 18-day average crossing price at 4,224.9 stack within half a point. Three standard deviations resistance at 4,228.1 sits just under the 4,230 stop, which clears Tuesday's high by 5.2. Monday's 4,242.3 high, Pivot R2 at 4,245.7, the 20-day average at 4,251.8, the 50 percent retracement of the four-week range at 4,265.5 and Pivot R3 at 4,266.6 are the extended references. Farther out sit the 100-day at 4,324.8, the 40-day crossing at 4,379.0, the 50-day at 4,380.4, the 4,439.8 one-month high, the 200-day at 4,627.5 and the 4,755.0 13-week high.
Support sits right under the settle. The 9-day average at 4,176.7 and the 5-day at 4,176.4 sit within a point of it. The 9-day crossing price at 4,173.5, the 3-10-16 day oscillator stall level at 4,170.7 and Tuesday's 4,169.7 low follow. Pivot S1 at 4,156.4 and Friday's 4,156.1 low form the next band, then one standard deviation support at 4,148.0 and the momentum projection level at 4,143.3. Two standard deviations support at 4,135.8 and Pivot S2 at 4,135.5 sit 0.3 apart. Three standard deviations support at 4,126.5 lies beneath them. Pivot S3 at 4,101.3, the 4,091.2 one-month low and the 4,019.0 13-week low complete the list.
The averages split around the settle. It sits 0.9 points above the 5-day at 4,176.4 and 0.6 above the 9-day at 4,176.7. It sits 74.5 beneath the 20-day at 4,251.8, 203.1 beneath the 50-day at 4,380.4, 147.5 beneath the 100-day at 4,324.8 and 450.2 beneath the 200-day at 4,627.5. The 5-day fell 2.0 from 4,178.3 as the 10/06 settle of 4,187.1 left the window. The 20-day fell 7.8 from 4,259.5 and the 50-day rose 1.7 from 4,378.6. The older settlements explain the order. The 30 older ones in the 50-day window averaged 4,466.1, and the 50 older ones in the 100-day window 4,269.2. Wednesday's crossing prices are 4,173.5 for the 9-day, 4,224.9 for the 18-day and 4,379.0 for the 40-day.
Momentum leans soft. Relative strength reads 40.02 on the 9-day, 40.14 on the 14-day and 41.86 on the 20-day, all beneath 50. The 9-day raw stochastic reads 51.31 percent and the 14-day 33.06 percent. The smoothed 14-day %K at 34.41 percent sits above %D at 29.57 percent, both in the lower half. Sellers lead on direction. On the 9-day, negative direction at 17.96 leads positive at 15.28 with the ADX at 23.99; on the 14-day, 19.15 leads 14.97 with the ADX at 19.64. Historic volatility reads 12.37 percent on the 9-day and 18.07 percent on the 14-day. These readings come from the page dated for the Wednesday session, read after the 6:00 PM ET reopen, which can carry the live Globex price in place of the settle.
The composite snapshot reads "64% SELL", strength "Weak", direction "Strengthening", composite indicator "SELL". The short-term group reads "Average: 80% SELL", the medium-term "Average: 75% SELL" and the long-term "Average: HOLD". History: "48% SELL" yesterday, "72% SELL" last week and "24% SELL" last month.
The 14-day average true range stands at 84.9 points, 2.03 percent of the settle, and the 14-day average daily range at 76.8. Tuesday ran 0.72 times that. The 9-day figures are 78.4 and 70.5 and the 20-day 89.7 and 82.8. One average true range either side of the settle spans 4,092.4 to 4,262.2. The deviation bands are tighter, built from five settlements: 4,148.0 to 4,206.6, 4,135.8 to 4,218.8 and 4,126.5 to 4,228.1. Daily ranges over eight sessions ran 105.2, 48.5, 81.7, 106.6, 42.6, 77.6, 64.2 and 55.1 points. Last week spanned 4,091.2 to 4,233.7, and Tuesday traded inside it. Over five sessions the contract is down 9.8 points from the 4,187.1 settle of 10/06. The one-month high of 4,439.8 sits 262.5 above the settle and the one-month low 86.1 beneath it.
A softer dollar, Federal Reserve speakers and Gulf headlines
Start with the dollar. The dollar index closed at 102.18 in the provider's daily record, down 0.41 from Monday's 102.59, after a 102.16 to 102.57 range. Yields eased too. The ten-year yield index slipped to 5.22 percent from 5.24 percent and the thirty-year to 5.56 percent from 5.59 percent. On the measured closes, gold fell on a day when both the dollar and nominal yields declined. Provider commentary said the dollar was pressured by Federal Reserve comments it described as dovish, and cited a governor's view that the rise in long-term yields is doing some of the central bank's tightening. Provider commentary also said losses in the dollar were limited after September existing home sales unexpectedly rose 1.5 percent to 3.99 million. No inflation-protected yield was captured, so the real-yield read rests on nominal yields only.
Fed speakers filled the afternoon. The news feed carried between 2:05 PM ET and 2:08 PM ET a Federal Reserve bank president's remarks that one more rate increase may be appropriate this year. He is not seeing broad price pressure outside artificial intelligence and energy, per the news feed. He added, per the news feed, that the economy is not overheating. Provider commentary cited a Federal Reserve bank president's view that one more quarter-point increase may be appropriate this year, with no reason at this time to expect more. A regional president said between 2:05 PM ET and 2:06 PM ET, per the news feed, that shocks are continuing and doing something about inflation makes sense. Then came a third voice. Between 4:00 PM ET and 4:44 PM ET a second regional president said, per the news feed, that she supported the September increase and expects inflation to stay above 2 percent because of high energy prices. She also said, per the news feed, that the central bank is not rethinking its 2 percent target. Investment-bank commentary carried by the news feed said rate futures price less than a 20 percent probability of an increase at this month's meeting. The next policy decision is listed for October 28 at 2:00 PM ET, per the news-feed calendar and unconfirmed.
Silver fell harder than gold. December silver settled at 59.525, down 0.988 or 1.63 percent, so the gold-to-silver ratio rose to 70.18 from 69.25. November WTI crude settled at 94.14, up 0.43 percent, and Brent's December contract at 105.69, down 0.90 percent. Stocks barely moved. The S&P 500 cash index closed at 7,805.45, down 0.02 percent, and the semiconductor index at 12,208.79, down 0.23 percent. The volatility index closed at 15.27, up 0.06.
The Gulf stayed loud, per the news feed. The news feed carried at 8:40 AM ET a Houthi warning to evacuate areas near the Saudi energy company's facilities, and at 11:37 AM ET the President's statement that a decision on Iran will be made very soon. Between 2:34 PM ET and 2:43 PM ET the news feed carried reports of booms near the company's Dhahran headquarters and a missile interception. Then the sea lanes. Between 3:04 PM ET and 3:08 PM ET the news feed carried maritime security reports of a container vessel and a tanker struck in the Strait of Hormuz. At 3:47 PM ET the news feed carried a press report that Israel's Prime Minister and the President discussed a possible new action on Iran. The war in Ukraine surfaced too. At 4:24 PM ET it carried, per the news feed, a statement from Ukraine's President that a Russian missile attack targeted energy infrastructure in Kyiv. None was confirmed for this review. In the review's interpretation, the session's haven demand did not offset the selling pressure on the measured settle.
Positioning data lag a week. The positioning report as of October 6, 2026 puts managed money long at 127,101 contracts, down 4,610, against short at 16,114, up 4,721. That is a net long of 110,987, against 120,318 a week earlier, a drop of 9,331. Commercials held 55,802 long against 300,329 short. Tuesday's volume was 121,310 contracts against Monday's revised 102,772. Open interest reads 318,078 for Monday, against 319,173 on Friday; Tuesday's had not been reported. The next positioning report covers the week to Tuesday, October 13. No central-bank purchase data, Chinese import figure or fund-holdings series was captured, so no structural-demand change is asserted.
The gold fund's console offers a proxy read. Read at about 6:20 PM ET with a Date Updated stamp of 2026-10-13, it shows a current-price field of 381.41 against a previous-close field of 382.18, a change of minus 0.20 percent. No fund close from the provider's daily record was captured, so neither field is treated as a verified close. Call gamma reads minus 243.1 million against put gamma of 113.33 million. Put gamma is positive. The console attributes 4.40 percent of gamma to the nearest expiration, with the largest delta expiration on 2026-10-16. One-month implied volatility of 20.90 percent sits just beneath realised volatility of 20.94 percent, with an implied-volatility rank of 11.68 percent, a skew rank of 57.37 percent and a put-to-call open-interest ratio of 0.54. In the review's interpretation the negative call gamma describes a fund whose options positioning does not dampen moves. Volume was 12,337,297 shares, a trading figure that says nothing about holdings. The fund is a proxy used qualitatively, and no fund level is translated into a futures price.
The desk note, the 5:28 PM ET Tuesday edition, does not discuss gold. China comes tonight. Chinese consumer and producer prices are listed at 9:30 PM ET on Tuesday, per the news-feed calendar and unconfirmed, with forecasts of 1 percent and 4.4 percent for the year.
The trade map for Wednesday
The primary setup is a short from 4,200 to 4,210. The settle sits beneath the 20-day through 200-day averages and negative direction leads on both directional windows. Tuesday printed a lower high and a lower low, and the composite reads "64% SELL" with direction "Strengthening". The 9-day average stall level at 4,202.3 and one standard deviation resistance at 4,206.6 sit inside the band, with Pivot R1 at 4,211.5 just above it. Risk sits above the high. The stop sits at 4,230, above Tuesday's 4,224.8 high, the 18-day crossing at 4,224.9 and three standard deviations resistance at 4,228.1. Targets step down to 4,180, 2.7 above Tuesday's settle, 4,155, 1.4 beneath Pivot S1, and an extended 4,130, 3.5 above three standard deviations support. The review flags the risks. Gold fell on a day the dollar and yields declined, and the settle sits just above the 5-day and 9-day averages. The inflation print can move the dollar sharply in either direction, so the review calls this an analyst judgment that the downtrend resumes from a rally, with no measured edge behind it.
Now the arithmetic. From the 4,205 midpoint the risk to the stop is 25 points, 29.4 percent of the 14-day average true range of 84.9. The targets sit 25, 50 and 75 points beneath the midpoint. Exact multiples. Tuesday's settle sits 22.7 to 32.7 points beneath the band, and the 6:12 PM ET quote of 4,183.7 sits 16.3 beneath its bottom. Tuesday's high cleared the band's top by 14.8 points and stopped 5.2 beneath the stop.
The scenario ranges are analyst judgment. The low-range case runs 4,150 to 4,206, the most likely 4,135 to 4,219 and the high-range case 4,092 to 4,262. Session bands come next. Through Globex the review expects roughly 4,165 to 4,205, with a neutral to lower bias beneath the 4,200 to 4,210 band. London follows at 4,160 to 4,212, then 4,135 to 4,220 in the morning and 4,130 to 4,225 in the afternoon. The Wednesday session's 4,182.8 to 4,185.3 range at the 6:12 PM ET quote sits inside the Globex band.
Inflation leads the calendar. The September consumer price index prints at 8:30 AM ET, as the calendar lists it. The news-feed calendar lists forecasts of 0.6 percent for the month and 3.6 percent for the year, and 0.2 percent and 2.5 percent for the core measure. Earlier, a Federal Reserve vice chair speaks at 5:40 AM ET, as the calendar lists it. A Bank of England policymaker at 2:00 AM ET and European Central Bank speakers at 4:30 AM ET are listed per the news-feed calendar and unconfirmed. Business formation statistics follow at 10:00 AM ET, as the calendar lists them. Gold settles at 1:30 PM ET, when a regional Federal Reserve president is listed, per the news-feed calendar and unconfirmed. The afternoon brings more. The central bank's regional survey of economic conditions lands at 2:00 PM ET, and the vice chair speaks again at 10:55 PM ET, as the calendar lists both. Tonight, Chinese prices at 9:30 PM ET and a European Central Bank president's remarks at 10:10 PM ET are listed per the news-feed calendar and unconfirmed, as is Australian employment at 8:30 PM ET on Wednesday. Thursday is busy too. Retail sales and producer prices follow at 8:30 AM ET on Thursday, October 15, 2026, and the Federal Reserve Chair's discussion with the International Monetary Fund's managing director at 11:30 PM ET that day, as the calendar lists them.
One path is weighted. In the review's analyst judgment the most probable path holds the contract between two standard deviations support at 4,135.8 and two standard deviations resistance at 4,218.8, with the inflation print deciding the side. In the review's judgment the print is the first-order influence on gold, through the dollar and yields. A rally toward the 4,200 to 4,210 band that fails beneath Tuesday's high is weighted above a sustained break higher. No measured frequency backs it. The alternative is a soft inflation print that extends Tuesday's decline in the dollar and yields, or a Gulf escalation that revives haven demand, carrying the contract through Tuesday's 4,224.8 high toward Pivot R2 at 4,245.7.
Tuesday's high missed one short band by 1.2 points and sits 14.8 above the next.
The complete data picture
Every number behind Wednesday’s plan, charted first, then the full level lists, then the complete numeric reference underneath.
Full numeric reference, every remaining figure from the session review
1. Executive Summary
The December gold contract settled at 4,177.3 on Tuesday, down 13.3 points or 0.32 percent from Monday's settle of 4,190.6, after trading between 4,224.8 and 4,169.7, a 55.1 point daily range. The settle finished at 13.8 percent of the range, and the range was 0.72 times the published 14-day average daily range of 76.8 points. Tuesday printed a lower high and a lower low against Monday and settled in the lower seventh of its range, the second consecutive lower settle. The 4,177.3 settle was the lowest since the 4,157.0 settle of 10/08.
Gold fell on a day the dollar index closed at 102.18, down 0.41 from Monday's 102.59, and the ten-year yield index eased to 5.22 percent from 5.24 percent. Provider commentary said the dollar was pressured by Federal Reserve comments it described as dovish, and cited a governor's view that the rise in long-term yields is doing some of the central bank's tightening and a Federal Reserve bank president's view that one more quarter-point increase may be appropriate this year with no reason at this time to expect more. December silver settled at 59.525, down 0.988 or 1.63 percent, so the gold-to-silver ratio rose to 70.18 from 69.25.
The news feed carried at 2:34 PM ET to 2:43 PM ET reports of booms near the Saudi energy company's Dhahran headquarters and a missile interception, and at 3:04 PM ET to 3:08 PM ET maritime security reports of a container vessel and a tanker struck in the Strait of Hormuz. The composite multi-indicator snapshot reads "64% SELL" with direction "Strengthening", against "48% SELL" in the prior session's snapshot.
The Wednesday session opens with the settle 0.9 points above the 5-day settlement average and 74.5 points beneath the 20-day, and the September consumer price index prints at 8:30 AM ET, as the calendar lists it. The published 14-day average true range of 84.9 points is 2.03 percent of the settle. The Primary Setup below is a short from the 4,200 to 4,210 band, around the 9-day average stall level at 4,202.3 and one standard deviation resistance at 4,206.6, stopped at 4,230 above Tuesday's 4,224.8 high, with objectives at 4,180, 4,155 and an extended 4,130.
2. Price Action & Technical Structure
2.1 Intraday and Session Review
The Tuesday session opened at 4,195.5 at the Monday 6:00 PM ET reopen, 4.9 points above Monday's settle, marked a daily high of 4,224.8 and a daily low of 4,169.7, and settled at 4,177.3 at 1:30 PM ET. No complete intraday series was preserved for this session, so this review makes no claim about when the high or the low printed or about the path between them. The daily high and low are full Globex session extremes rather than extremes of the settlement window.
After the settle, the chart's 4:30 PM ET bar closed at 4,184.2; that post-settlement quote is not used as the settlement anywhere in this review. Globex reopened at 6:00 PM ET, so the provider's displayed day open, high and low of 4,184.2, 4,185.3 and 4,182.8 belong to the new session dated Wednesday, not to Tuesday, and are not used as Tuesday's range.
The session extremes used here are the completed-session inputs behind the published pivot ladder rather than an independently read bar, back-solved from the outer pivot pairs and verified against every rung. Pivot R3 at 4,266.6 minus Pivot S3 at 4,101.3, divided by three, returns 55.1, and Pivot R2 at 4,245.7 minus Pivot S2 at 4,135.5, divided by two, returns the same 55.1. Three times the Pivot Point of 4,190.6 less the 4,177.3 settle gives a high plus low sum of 8,394.5, which the pair of 4,224.8 and 4,169.7 reproduces, and that pair reproduces all seven published rungs. Independent corroboration: the provider's settlement row, the chart's completed Tuesday daily bar and the extremes of the captured Tuesday 30-minute bars carry the same 4,224.8 high and 4,169.7 low.
2.2 Daily Structure
Tuesday printed a lower high and a lower low against Monday: the 4,224.8 high sits 17.5 points beneath Monday's 4,242.3, and the 4,169.7 low sits 8.4 points beneath Monday's 4,178.1. The settle at 13.8 percent of the range leaves an upper shadow of 29.3 points above the 4,195.5 open and a lower shadow of 7.6 points beneath the settle on the daily bar. The sequence of session highs over the last six sessions reads 4,212.4, 4,197.8, 4,170.7, 4,233.7, 4,242.3 and 4,224.8, and the sequence of session lows reads 4,130.7, 4,091.2, 4,128.1, 4,156.1, 4,178.1 and 4,169.7. Settlements over the same six sessions ran 4,187.1, 4,140.7, 4,157.0, 4,216.3, 4,190.6 and 4,177.3.
Last week, October 5 through October 9, spanned 4,233.7 to 4,091.2, and Tuesday traded inside that span. The one-month high of 4,439.8 sits 262.5 points above the settle, and the one-month low of 4,091.2 sits 86.1 points beneath it. Over five sessions the contract fell 9.8 points from the 4,187.1 settle of 10/06.
No prior-quarter high or low was captured for this review, so the 13-week extremes serve as the available quarterly reference: 4,755.0 above and 4,019.0 beneath.
2.3 4-Hour and Swing Structure
Daily ranges for the last eight sessions ran 105.2, 48.5, 81.7, 106.6, 42.6, 77.6, 64.2 and 55.1. The settlement changes over the same eight sessions read minus 40.0, minus 5.5, plus 30.3, minus 46.4, plus 16.3, plus 59.3, minus 25.7 and minus 13.3.
The retracement grid published for Wednesday places the 38.2 percent retracement from the four-week low at 4,224.4, 47.1 points above the settle, and the 50 percent retracement of the four-week range at 4,265.5. Beneath the settle, the one-month low of 4,091.2 is the nearest published swing reference. No four-hour series was captured for this review, so swing structure here rests on daily bars only.
2.4 Moving Averages
The averages cited in this subsection were computed for this review from the provider's daily settlement series for the December contract, which holds 259 completed sessions through Tuesday. The 5-day average stands at 4,176.4, the 9-day at 4,176.7, the 20-day at 4,251.8, the 50-day at 4,380.4, the 100-day at 4,324.8 and the 200-day at 4,627.5.
The 4,177.3 settle sits 0.9 points above the 5-day average and 0.6 points above the 9-day, and 74.5 points beneath the 20-day, 203.1 points beneath the 50-day, 147.5 points beneath the 100-day and 450.2 points beneath the 200-day. The 5-day average fell 2.0 points from Monday's 4,178.3, because the 10/06 settle of 4,187.1 left the window and was replaced by 4,177.3. The 20-day fell 7.8 points from 4,259.5 and the 50-day rose 1.7 points from 4,378.6.
The 20-day average sits beneath the 50-day because the last 20 settlements averaged 4,251.8 against 4,380.4 for the full 50, which means the 30 older settlements in the 50-day window averaged higher, at 4,466.1. The 50-day sits above the 100-day because the older 50 settlements in the 100-day window averaged lower, at 4,269.2. The projection grid gives the prices at which each average would be crossed on Wednesday: 4,173.5 for the 9-day, 4,224.9 for the 18-day and 4,379.0 for the 40-day.
2.5 Oscillator and Trend Readings
The oscillator figures below are as published on the provider's technical page dated for the Wednesday session and read after the 6:00 PM ET reopen; the page can substitute the live Globex price for the settle, so these readings carry that caveat. The 9-day relative strength reads 40.02, the 14-day relative strength 40.14 and the 20-day relative strength 41.86.
The 9-day raw stochastic reads 51.31 percent and the 14-day raw stochastic 33.06 percent, while the 14-day stochastic %K reads 34.41 percent and the 14-day stochastic %D 29.57 percent, so %K sits above %D in the lower half of the range.
The 9-day directional index ADX reads 23.99 with the 9-day +DI at 15.28 and the 9-day -DI at 17.96; the 14-day directional index ADX reads 19.64 with the 14-day +DI at 14.97 and the 14-day -DI at 19.15, so negative direction leads on both. The 9-day historic volatility reads 12.37 percent and the 14-day historic volatility 18.07 percent.
The composite multi-indicator snapshot reads "64% SELL", with current strength "Weak" and current direction "Strengthening", and the composite indicator reads "SELL". The short-term group reads "Average: 80% SELL", the medium-term group "Average: 75% SELL" and the long-term group "Average: HOLD". The snapshot history reads "48% SELL" yesterday, "72% SELL" last week and "24% SELL" last month.
2.6 Volatility and Expected Range
The published 14-day average true range stands at 84.9 points and the 14-day average daily range at 76.8 points; the 9-day average true range is 78.4 with a 9-day average daily range of 70.5, and the 20-day average true range is 89.7 with a 20-day average daily range of 82.8. Tuesday's 55.1 point range was 0.72 times the 14-day average daily range.
Adding and subtracting the 14-day average true range of 84.9 points from the 4,177.3 settle frames Wednesday between 4,092.4 and 4,262.2. The published standard-deviation bands are narrower because they are built from five settlements: one deviation spans 4,148.0 to 4,206.6, two spans 4,135.8 to 4,218.8 and three spans 4,126.5 to 4,228.1. These bands describe settlement dispersion, not intraday reach.
3. Key Levels
3.1 Resistance
Above the 4,177.3 settle, the 3-10 day crossover stall level at 4,183.7 and the published target price at 4,190.2 come first, with the Pivot Point at 4,190.6 alongside. The 9-day average stall level at 4,202.3 and one standard deviation resistance at 4,206.6 form the band that anchors the setup, with Pivot R1 at 4,211.5 just above. Two standard deviations resistance at 4,218.8, the momentum projection level at 4,221.4, the 38.2 percent retracement from the four-week low at 4,224.4, Tuesday's 4,224.8 high, the 18-day average crossing price at 4,224.9 and three standard deviations resistance at 4,228.1 form the next grouping. Monday's 4,242.3 high, Pivot R2 at 4,245.7, the 20-day settlement average at 4,251.8, the 50 percent retracement of the four-week range at 4,265.5 and Pivot R3 at 4,266.6 are the extended references.
3.2 Support
Beneath the settle, the 9-day average crossing price at 4,173.5, the 3-10-16 day oscillator stall level at 4,170.7 and Tuesday's 4,169.7 low come first. Pivot S1 at 4,156.4 and Friday's 4,156.1 low form the next band, followed by one standard deviation support at 4,148.0 and the momentum projection level at 4,143.3. Two standard deviations support at 4,135.8 and Pivot S2 at 4,135.5 form the next grouping, with three standard deviations support at 4,126.5 beneath. Pivot S3 at 4,101.3, the 4,091.2 one-month low and the 4,019.0 13-week low follow.
4. Macro Drivers
4.1 Dollar and Real Yields
The dollar index closed at 102.18 in the provider's daily record, down 0.41 from Monday's 102.59, and its Tuesday range ran from 102.16 to 102.57. The ten-year yield index eased to 5.22 percent from 5.24 percent and the thirty-year yield index to 5.56 percent from 5.59 percent. Provider commentary said losses in the dollar were limited after September existing home sales unexpectedly rose 1.5 percent to 3.99 million. On the measured closes gold fell on a day when both the dollar and nominal yields declined. No inflation-protected yield was captured, so the real-yield read here rests on nominal yields only.
4.2 Fed and Monetary Policy
The news feed carried at 2:05 PM ET to 2:08 PM ET a Federal Reserve bank president's remarks that one more rate increase may be appropriate this year, that he is not seeing broad price pressure outside artificial intelligence and energy and that the economy is not overheating, and at 2:05 PM ET to 2:06 PM ET a regional president's remarks that shocks are continuing and doing something about inflation makes sense. At 4:00 PM ET to 4:44 PM ET a second regional president said, per the news feed, that she supported the September increase, expects inflation to stay above 2 percent because of high energy prices and that the central bank is not rethinking its 2 percent target. Investment-bank commentary carried by the news feed said rate futures price less than a 20 percent probability of an increase at this month's meeting. The consumer price index for September is scheduled for 8:30 AM ET on Wednesday, October 14, 2026, as the calendar lists it, and the next policy decision is listed for October 28 at 2:00 PM ET, per the news-feed calendar and unconfirmed.
4.3 Geopolitical Backdrop
The news feed carried at 8:40 AM ET a Houthi warning to evacuate areas near the Saudi energy company's facilities, at 11:37 AM ET the President's statement that a decision on Iran will be made very soon, at 2:34 PM ET to 2:43 PM ET reports of booms near the Dhahran headquarters and a missile interception, and at 3:04 PM ET to 3:08 PM ET maritime security reports of a container vessel and a tanker struck in the Strait of Hormuz. At 3:47 PM ET it carried a press report that Israel's Prime Minister and the President discussed a possible new action on Iran, and at 4:24 PM ET a statement from Ukraine's President that a Russian missile attack targeted energy infrastructure in Kyiv. These are statements carried by the news feed rather than events confirmed for this review; in this review's interpretation the session's haven demand did not offset the selling pressure on the measured settle.
4.4 China and Structural Demand (Central Bank Buying, PBOC, ETF Flows)
No central-bank purchase data, Chinese import figure or fund-holdings series was captured on the feeds read for this review, so no structural-demand change is asserted. Chinese consumer and producer prices are listed at 9:30 PM ET on Tuesday, per the news-feed calendar and unconfirmed, with forecasts of 1 percent and 4.4 percent for the year. The gold fund's console shows volume of 12,337,297 shares, which is a trading figure, not a holdings figure.
4.5 Energy and Cross-Asset
November WTI crude settled at 94.14, up 0.43 percent, and Brent's December contract at 105.69, down 0.90 percent. December silver settled at 59.525, down 0.988 or 1.63 percent, so the gold-to-silver ratio rose to 70.18 from 69.25. The S&P 500 cash index closed at 7,805.45, down 0.02 percent, and the semiconductor index at 12,208.79, down 0.23 percent. The volatility index closed at 15.27, up 0.06.
4.6 Institutional Positioning (COT, ETF Holdings, Speculator Length)
The positioning report as of October 6, 2026, shown on the provider's overview, puts managed money long at 127,101 contracts, down 4,610, against short at 16,114, up 4,721, a net long of 110,987. Commercials held 55,802 long against 300,329 short. Open interest on the December contract is shown at 318,078 for Monday, against 319,173 on Friday; Tuesday's open interest had not been reported at the time of capture. Tuesday's volume was 121,310 contracts against Monday's revised 102,772. The next positioning report covers the week to Tuesday, October 13.
5. Gold Fund Options Context (Proxy)
The gold fund's positioning console was read at about 6:20 PM ET with a Date Updated stamp of 2026-10-13. It shows a current-price field of 381.41 against a previous-close field of 382.18, a change of minus 0.20 percent; no fund close from the provider's daily record was captured, so neither field is treated as a verified close. The console row shows call gamma of minus 243.1 million against put gamma of 113.33 million, and attributes 4.40 percent of the fund's gamma to the nearest expiration, with the largest delta expiration on 2026-10-16. One-month implied volatility of 20.90 percent sits just beneath one-month realised volatility of 20.94 percent, with an implied-volatility rank of 11.68 percent, a skew rank of 57.37 percent and a put-to-call open-interest ratio of 0.54. In this review's interpretation the negative call gamma describes a fund whose options positioning does not dampen moves; no level is drawn from it.
The desk note read for this review, the 5:28 PM ET Tuesday edition, does not discuss gold. The console's high and low volatility point fields are treated as low-confidence and excluded, and no fund level is translated into a futures price.
The proxy caveat stands in any case: the gold fund is a proxy for the futures contract, used qualitatively only, and its levels are never translated into futures prices. Primary edge for gold is the dollar, yield and policy complex in section 4.
6. Forecast
6.1 Night Session (6:00 PM ET Tuesday to 3:00 AM ET Wednesday, Globex/Asia)
Globex reopened at 6:00 PM ET with the December contract quoted at 4,183.7 at 6:12 PM ET, 6.4 points above the settle. Chinese consumer and producer prices are listed at 9:30 PM ET and a European Central Bank president's remarks at 10:10 PM ET, both per the news-feed calendar and unconfirmed. Bias neutral to lower beneath the 4,200 to 4,210 band, expected Globex band roughly 4,165 to 4,205.
6.2 London Session (3:00 AM to 8:00 AM ET Wednesday)
A Federal Reserve vice chair speaks at 5:40 AM ET, as the calendar lists it, and European Central Bank speakers are listed at 4:30 AM ET, per the news-feed calendar and unconfirmed. Bias neutral to lower, expected band roughly 4,160 to 4,212, with the 4,200 to 4,210 band the first meaningful resistance.
6.3 Morning Session (9:30 AM to 12:00 PM ET Wednesday, US Open)
The consumer price index for September prints at 8:30 AM ET, as the calendar lists it, before this window opens, with the news-feed calendar listing forecasts of 0.6 percent for the month and 0.2 percent for the core measure. Business formation statistics are scheduled at 10:00 AM ET, as the calendar lists it. Expected band roughly 4,135 to 4,220.
6.4 Afternoon Session (12:00 PM to 4:00 PM ET Wednesday)
Gold settles at 1:30 PM ET. A regional Federal Reserve president is listed at 1:30 PM ET, per the news-feed calendar and unconfirmed, and the central bank's regional survey of economic conditions follows at 2:00 PM ET, as the calendar lists it. Expected band roughly 4,130 to 4,225.
6.5 Night Session Forward (6:00 PM ET Wednesday)
The Thursday session opens at 6:00 PM ET Wednesday. A Federal Reserve vice chair speaks at 10:55 PM ET, as the calendar lists it, and Australian employment is listed at 8:30 PM ET, per the news-feed calendar and unconfirmed. Retail sales and producer prices are scheduled for 8:30 AM ET on Thursday, October 15, 2026, as the calendar lists it.
6.6 Expected Range (Wednesday Full Session)
Low-range scenario: 4,150 to 4,206
Mid-range scenario (most likely): 4,135 to 4,219
High-range scenario: 4,092 to 4,262
6.7 Most Likely Path
In this review's analyst judgment the most probable path holds the contract between two standard deviations support at 4,135.8 and two standard deviations resistance at 4,218.8, with the inflation print deciding the side. A rally toward the 4,200 to 4,210 band that fails beneath Tuesday's high is weighted above a sustained break higher, because the settle sits beneath the 20-day through 200-day settlement averages, negative direction leads on the 9-day and 14-day directional systems, Tuesday printed a lower high and a lower low and settled at 13.8 percent of its range, and the composite snapshot reads "64% SELL" with direction "Strengthening". The alternative that would invalidate this reading is a soft inflation print that extends Tuesday's decline in the dollar and yields, or a Gulf escalation that revives haven demand, that carries the contract through Tuesday's 4,224.8 high toward Pivot R2 at 4,245.7.
7. Wednesday Economic Calendar
Globex reopened at 6:00 PM ET on Tuesday. Chinese consumer and producer prices are listed at 9:30 PM ET and a European Central Bank president's remarks at 10:10 PM ET, both per the news-feed calendar and unconfirmed.
On Wednesday, a Bank of England policymaker is listed at 2:00 AM ET and European Central Bank speakers at 4:30 AM ET, both per the news-feed calendar and unconfirmed. A Federal Reserve vice chair speaks at 5:40 AM ET, as the calendar lists it. The consumer price index for September prints at 8:30 AM ET, as the calendar lists it, with the news-feed calendar listing forecasts of 0.6 percent for the month and 3.6 percent for the year, and 0.2 percent and 2.5 percent for the core measure. A regional Federal Reserve president is listed at 1:30 PM ET, per the news-feed calendar and unconfirmed. Gold settles at 1:30 PM ET. The central bank's regional survey of economic conditions is scheduled at 2:00 PM ET, as the calendar lists it, and the vice chair speaks again at 10:55 PM ET, as the calendar lists it.
Later in the week, retail sales and producer prices are scheduled for 8:30 AM ET on Thursday, October 15, 2026, as the calendar lists it, and the Federal Reserve Chair's discussion with the International Monetary Fund's managing director for 11:30 PM ET on Thursday, October 15, 2026, as the calendar lists it. In this review's judgment the first-order influence on gold on Wednesday is the September consumer price index at 8:30 AM ET, as the calendar lists it, through its effect on the dollar and yields.
8. Primary Trade Setup
Direction: Short
Rationale: The settle sits beneath the 20-day through 200-day settlement averages, negative direction leads on the 9-day and 14-day directional systems, Tuesday printed a lower high and a lower low, and the composite snapshot reads "64% SELL" with direction "Strengthening"; a rally into the 4,200 to 4,210 band of the 9-day average stall level at 4,202.3 and one standard deviation resistance at 4,206.6, beneath Pivot R1 at 4,211.5, offers a short with a defined risk point above Tuesday's 4,224.8 high. Gold fell on a day the dollar and yields declined, the settle sits just above the 5-day and 9-day averages, and the inflation print can move the dollar sharply in either direction, so the setup is an analyst judgment that the downtrend resumes from a rally rather than a measured edge.
Entry Zone: 4,200 to 4,210
Stop Loss: 4,230 (above Tuesday's 4,224.8 high, the 18-day average crossing price at 4,224.9 and three standard deviations resistance at 4,228.1)
Target 1 (T1): 4,180 (2.7 above Tuesday's 4,177.3 settle)
Target 2 (T2): 4,155 (1.4 beneath Pivot S1 at 4,156.4)
Target 3 (T3, extended): 4,130 (3.5 above three standard deviations support at 4,126.5)
Risk-to-Reward: Approximately 1:1 to T1, 1:2 to T2, 1:3 to T3
Invalidation: A settle above Tuesday's 4,224.8 high negates the thesis. Short of that, the edge is removed by acceptance above Pivot R1 at 4,211.5 rather than by a touch, defined as two consecutive 30-minute closes above 4,211.5.
Macro override: A soft inflation print that extends the decline in the dollar and yields, or a Saudi or Hormuz escalation that revives haven demand, would invalidate the short in real time. In that scenario a move through the 4,230 stop removes the setup, and Pivot R2 at 4,245.7 and the 20-day settlement average at 4,251.8 become the references within one 14-day average true range of 84.9 points.
Sources and methodology
This outlook is built from our session review of the December gold contract, the December ’26 contract, prepared after Tuesday's close on October 13, 2026 for the Wednesday, October 14, 2026 session. Tuesday's completed extremes are the inputs behind the published pivot ladder: Pivot R3 at 4,266.6 less Pivot S3 at 4,101.3, divided by three, and Pivot R2 at 4,245.7 less Pivot S2 at 4,135.5, divided by two, both return 55.1, and three times the 4,190.6 Pivot Point less the settle gives 8,394.5, the sum of the solved pair of 4,224.8 and 4,169.7. The provider's settlement row, the chart's completed Tuesday bar and the captured Tuesday 30-minute bars carry the same extremes, and only those figures, the dated 2026-10-13 row of the provider's daily record and the review's statements are used to grade Tuesday's card. No complete intraday series was preserved, so no claim is made about when the high or the low printed.
Monday's 2026-10-12 row has been revised since our Tuesday outlook: volume now reads 102,772 contracts against the preliminary 100,244, and open interest is now reported at 318,078; Monday's prices are unchanged. The moving averages were computed from the provider's 259-session daily settlement series; the oscillators are cited as published for the Wednesday session, read after the 6:00 PM ET reopen, and the composite strings are quoted verbatim. The gold fund is a proxy used qualitatively; its console's high and low volatility point fields are excluded, its price fields are not treated as verified closes, and no fund level is translated into a futures price. Wednesday-session quotes are those at 6:12 PM ET, with the session still open. The dollar index's percent change is computed from its two closes. Scenario ranges are analyst judgment, and items marked unconfirmed come from the news-feed calendar or the news feed.
Tuesday’s outlook for this contract is here, and the crude oil contract’s Tuesday outlook covers the contract that settled 0.43 percent higher on Tuesday. Outlooks for ES, NQ, GC and CL are collected on the market outlook page, and our forward trading record is on the performance statement.



