
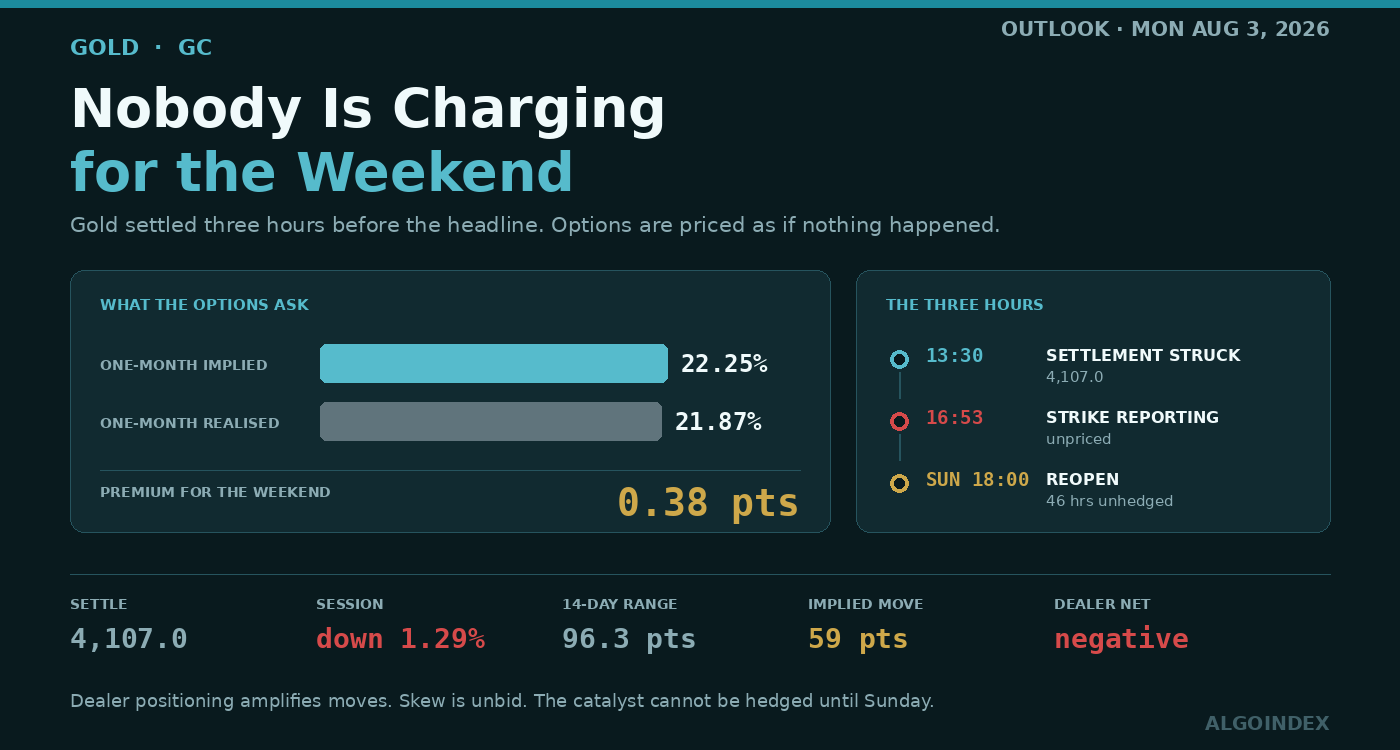
Gold's settlement was struck at half past one Friday afternoon. The report that matters for Monday crossed at 16:53, naming energy infrastructure inside Iran as a target and the weekend as a possible window. For that risk, the options market asks 0.38 volatility points above what this metal has actually been delivering. Which is, in practical terms, nothing.
A rates day wearing metals clothing
Friday itself was uncomplicated. Open near 4,164, a high in the first hours that never got revisited, then a steady bleed through the European close and the American data window into a low around 4,076, then a modest lift into a 4,107.0 settlement. That is 53.6 points lost across a 94.3-point session, and it finished in the bottom quarter.
Metals had nothing to do with why. Three American prints landed firmer than forecast in sequence: quarterly employment costs, a regional purchasing survey, and final consumer sentiment. Short-end yields rose. The dollar index, which had spent Thursday at a six-week low, clawed back to close marginally green. Gold carries no coupon. It funded the entire move, basis point by basis point.
Behind the data sits policy, and the policy story is the more durable one. Wednesday's decision split nine to three, with all three dissenters wanting a quarter point higher rather than lower. Three officials dissenting hawkishly at once describes a committee whose restrictive tail runs considerably further than any headline conveys. One of them said so again publicly on Friday: without real restraint, inflation keeps running over target, and moving modestly now makes moving sharply later less likely.
Wednesday and Thursday had been spent pricing a friendly central bank. Friday was spent taking that back.
Silver dropped harder, off 2.09 percent, lifting the ratio between the two metals toward 71. When capital exits the industrial metal quicker than it exits the monetary one, that is defensive rotation inside the complex, not wholesale commodity liquidation, and inside a falling complex it counts as relative strength here. Crude ran the other way entirely, both benchmarks up over 1.2 percent.
A detail from the close is worth carrying forward. The last hourly bar finished about eight points under the official settlement, and the shorter bars agree with it. Settlement and last trade diverge because this contract prices at half past one while the session runs to five, but in live terms gold ended nearer 4,098. The band just under 4,100 is the real handoff into Sunday evening.
The contradiction that defines Monday
All of the above happened before half past one. The report came roughly three hours after, identifying power stations and refineries among the likely objectives, confirming that coordination between the two governments is already under way, and noting that where the campaign stops has not been decided. That last piece carries the teeth. Operations without a defined end condition carry open-ended escalation risk by construction.
None of it is in Friday's number. Gold closed on a hawkish-policy, firm-dollar narrative and reopens Sunday evening into a materially different world, with something like forty-six hours of headline exposure and nobody able to hedge across them.
Crude spent Friday pricing the supply risk. Gold never got to price the safe-haven side of the same story, because the decisive headline landed after its settlement was already struck.
The chain running into this has been building a fortnight. A navigation ban aimed at Saudi Arabia. A threat to hit a bridge or a power station for each Iranian move against shipping in the Strait. A statement holding Tehran accountable for what others do. Then talk of a negotiated arrangement, then a statement that strikes would answer attacks on American personnel in Jordan. Separately a major processing facility has already been struck, and a consortium running a pipeline has weighed halting oil and tanker operations open-endedly until safety guarantees arrive.
Three reopen outcomes are realistic. Action completes before Sunday evening and the metal gaps materially. Action stays pending and it opens firm on anticipation. Or the reporting gets walked back and it opens near where Friday left it, with the downtrend fully intact. The distribution leans upward for a structural reason rather than a hopeful one: the downside here is bounded by a trend that already exists, while nothing much bounds the upside at all.
Heavy structure, decaying force
There is no point dressing up the medium-term picture. It is heavy. Price sits under every major average with the stack fully inverted, negative directional pressure beats positive at every lookback without exception, and the composite reads 56 percent sell.
What matters more is how that trend is behaving rather than whether it exists. Strength readings above 28 on the fourteen and twenty-day windows do confirm something genuine rather than aimless drift. Out at nine days, though, strength has decayed under 20 and the gap between the two directional lines has narrowed to a couple of points, against eight out at twenty days. Real across three or four weeks. Fading across two.
Historic volatility says the same from another direction, compressing from near 27 percent on the hundred-day window down under 20 on the fourteen. Statistically, that describes something winding down into a base rather than breaking actively.
The composite internals reward a closer look. Short-term components average 60 percent sell and long-term 67, but the medium-term group comes in at only 25. That middle number is the outlier. Nine of thirteen studies say sell, four say hold, and precisely one says buy. A single buy signal surfacing inside a 56 percent sell reading with its direction rated weakening is roughly what the earliest and least trustworthy form of an inflection looks like. Not evidence of anything yet. Worth noticing.
Swing structure agrees. Highs have stepped down without interruption since the early-July peak, while lows have stepped up across the same stretch: mid-July, then earlier this week, then Friday. Descending highs over ascending lows is compression, and this one is tightening toward an apex. Patterns shaped that way break violently, and they break whichever way the catalyst that ends them points.
The last four-hour bar spanned 14.5 points and closed near the lows of it. Terminal compression that tight, on the back of a ninety-four-point day, describes a market done repricing, now waiting.
Nobody is charging for the weekend
Take the volatility readings one at a time. Front-month implied around 21.8 percent. Over on the proxy, implied across one month reads 22.25 while realised over the same window reads 21.87, so 0.38 points of premium. Rank sits under thirty, the forward-looking measure in the mid teens, skew in the mid twenties. What the options price as a move converts to roughly 59 gold points, well inside a normal day's range of 96.
Line those up and the message does not vary. Options sit at parity with delivered movement. Nobody has bid skew for downside cover. The priced move is comfortably under what this market travels on an ordinary day. Whatever the weekend brings, it has not been paid for.
Dealer positioning makes it worse, or better, depending on which side you take. In the primary proxy, call-side exposure reads negative against a positive put side, and the net comes out negative too. Negative net positioning means hedging reinforces direction rather than opposing it. Anyone short that exposure has to sell weakness and buy strength simply to stay flat, so moves that get going tend to keep going instead of reverting.
Amplifying dealer positioning, implied at parity with realised, skew unbid, and a catalyst nobody can hedge sitting across the weekend. Long defined-risk premium is the structurally correct expression, whichever way this eventually resolves.
The proxy's levels convert usefully too. Its upper volatility inflection maps into the six-way supply band that the technical set identified on its own, which is two entirely separate datasets naming the same battleground. Its previous close maps close to a four-week retracement overhead. One caveat: the inflection labels on that source occasionally render inverted, so weight them below the deviation and average confluences. Volume ran close to balanced, open interest leans call-heavy, and both the positioning and directional concentrations sit far out at the September expiry, which leaves near-dated pinning weak and the market fairly free to travel.
Where Monday gets decided
Immediately above the market a decision shelf gathers the computed target, a four-week retracement and the session pivot. Gold settled a handful of points under the first and about eleven under the pivot. Get the pivot back and hold it, or there is no bullish case to make at all.
Then comes the band that actually decides things, six independent measures packed inside fourteen points. Trade sustainably above its top and the short-term character changes. The band runs narrow enough that a firm reopen carrying a geopolitical bid would slice straight through it. Past it, a second tier collects two deviations, the four-week midpoint, a third deviation, first pivot resistance and Thursday's close. Reclaim Thursday's close and Friday's entire decline is erased, which makes it the obvious first objective for any repricing.
A third tier caps what a normal session can do, holding a stochastic threshold, Friday's high, the momentum midpoint and another retracement. Beyond that the extended objective gathers a higher stochastic level, the forty-day average and second pivot resistance. Touching the forty-day would be the first real challenge to this downtrend since early July. Nothing above that comes into play inside a week without a genuine supply disruption.
Downward, the handoff zone spans the terminal-session low up to the settlement, and where Sunday reopens against it is the first honest read on how the weekend got priced. Under it lies the first meaningful base, combining a stochastic threshold, first deviation support and Friday's low. Buyers defended that low once already, taking it back thirty points, which is why the primary setup parks its risk there.
A second tier follows underneath, packed with a deviation, first pivot support, a crossover stall, another stochastic level and a third deviation, with this week's low sitting just below. Lose that and the swing lows that have been rising since mid-July stop rising. Then the structural line, where second pivot support, the monthly low and the quarterly low all sit inside eight points of each other. Close a day beneath the quarterly low and the base-building read is finished, with a measured move opening toward the high 3,900s. Third pivot support and a crossover level sit down there before the structure thins out badly.
The trade
Long, countertrend, tactical, and the argument is narrower than it might sound. The claim is not that this downtrend has ended. The claim is that a specific catalyst, with a date attached and no price on it, has arrived in a market whose structure is built to over-react.
Entry sits 4,110 to 4,130, only after 09:45 and only where the opening range has established a hold above the settlement. Should a firm reopen already have the metal above 4,135 when cash opens, that is not an invitation to chase; wait for a pullback that holds inside the zone. A flat reopen with gold trading in the high 4,080s to 4,100 and Friday's low intact works as an alternate entry against the same stop.
Stop at 4,070, under Friday's low and under first deviation support, so risk runs somewhere between forty and sixty points depending on fill. That level has already been defended once with a thirty-point recovery. Give it up and the base-building interpretation dies with it.
Objectives come off in thirds. The four-week midpoint retracement first, second deviation resistance sitting immediately beneath it. The four-week high retracement second, reinforced by Friday's high, and by a conversion of the proxy's prior close that lands on nearly the same number, with the stop moving to entry there. Second pivot resistance third, the forty-day average acting as a checkpoint along the way, trailing whatever is left.
Enter at 4,120 against that stop and the geometry runs roughly 0.6, 1.2 and 1.8 to one, blending near 1.2 across the exits. Modest, and intentionally so. Whatever edge exists lives in how likely the catalyst is, rather than in how the levels are shaped, and size should say so. It is also why long premium with defined risk beats outright futures when optionality is on sale.
Invalidation comes from sustained trade under Friday's low during the American session, or any close beneath the stop. There is a softer one worth honouring as well. Reach the supply band, get turned away twice with lower highs and thinning participation, and exit at market whatever the stop distance says. Six independent measures live in that band; failing it twice is information, not noise.
Two macro overrides. A prices-paid print well above forecast turns the rates channel against the position, so halve it on the release and work whatever remains back to breakeven, or if not yet involved, stand down and look again after half past ten. And an explicit de-escalation headline deletes the rationale outright, in which case leave at market rather than waiting on a stop.
The conditional short mirrors it, and in purely technical terms it is the stronger of the two. Trigger: no action materialises, the reporting softens or gets contradicted, and gold reopens under the settlement without taking it back, requiring a decisive break of Friday's low after 09:45 and ideally a hot prices-paid number alongside. Enter on that break, or else on a retest from underneath that fails. Stop above the pivot, since reclaiming it would negate the breakdown. Objectives at this week's low, then second pivot support, then the quarterly low that forms the base of the whole four-week envelope. It ranks second purely because of how the weekend tilts things over the near term. Without the catalyst it becomes the primary.
Six conditions say do not trade. A reopen gapping past one average range either way, which means letting a range build and reassessing at 09:45. A gap higher of over sixty points that then trades back under the settlement overnight, which is a failed repricing and the least tradeable configuration there is. Price stuck in the mid 4,100s at 09:45 with the opening range offering no conviction, since pivot and handoff zone crowd each other too tightly for risk to be defined cleanly. Active military action with headlines arriving live, because intra-event movement cannot be managed with fixed stops. Five minutes on either side of the ten o'clock release. And anything before 09:45 or after 16:00, no exceptions.
One number, and forty-six hours of nothing
Monday brings one first-order release for this metal, plus one second-order risk. The decisive item is prices paid inside the ten o'clock manufacturing survey, forecast to come down from the prior reading. With three officials on record wanting tighter policy, an upside surprise there feeds the restraint case directly, lifts inflation-adjusted yields and leans on gold. A continued decline takes that pressure off and lets geopolitical positioning run the session. The headline survey figure and the employment component are secondary, though they will colour how the print gets read.
Refunding estimates in the afternoon are the second-order piece, able to shift long yields going into the close and with them the opportunity cost of holding this metal. No primary driver, but enough to set a closing tone. One item further out deserves marking now: Tuesday carries a thirty-year inflation-protected auction, and a soft one lifting long inflation-adjusted yields would pressure this metal with no headline required at all.
Europe's morning block is background. Retail sales out of Germany, Swiss inflation, then a run of final manufacturing surveys through the pre-dawn. None of it should override the geopolitical read. Watch the follow-on reporting instead, and watch crude, which leads this metal on any escalation.
Base case: a firm reopen with no completed action, work up into the low-to-mid 4,120s through Asia and Europe, consolidation into the New York open, then direction from the ten o'clock number. On that sequence the morning works the range between the pivot and the second tier, and the afternoon resolves upward if inflation cooperates or back toward the settlement area otherwise. Either way the medium-term downtrend survives. Tactical countertrend window. Not a reversal.
Formally, 45 percent says a firm reopen where the geopolitical bid holds and the supply band gets absorbed instead of rejected, with the session high landing in the mid-to-high 4,100s. Twenty percent says escalation confirms over the weekend, gapping straight above the second tier with the extension band live. That path is the hardest of the three to trade well, and it is worth being honest about why: the gap arrives large, the entry arrives unfavourable, and the odds of an exhaustion reversal inside the same session climb sharply once the initial event has been priced. Stand-aside rules apply, and the only clean approach means waiting on an orderly first pullback that holds over Friday's high. The last 35 percent covers reporting fading and technicals reasserting, with Friday's low giving way during the American morning and the second tier coming into play.
Behind Monday, the week points at its labour-market finish. Job openings and that auction Tuesday. Private payrolls Wednesday, alongside the weekly energy inventories and a services survey that carries a prices-paid component of its own. Claims and unit labour costs Thursday, with a policy speaker attached. Position Monday in the knowledge that bigger catalysts sit ahead, instead of assuming any clean trend runs from here. The same unpriced weekend sits under the equity complex, where the volatility surface was marked fifty-three minutes before the headline, as we set out in our August 3 ES review.
The complete data picture
Every number behind Friday’s plan, charted first; the full numeric reference follows underneath.
Full numeric reference , every remaining figure from the review
| December settlement | 4,107.0, down 53.6 points or 1.29 per cent |
| Session shape | opened 4,163.9, high 4,170.7 set in the first hours, low 4,076.4, range 94.3 points |
| Lower wick | about 30 points, responsive buyers present into the low 4,070s |
| Final hourly bar | closed 4,098.6, roughly 8 points beneath the official settlement |
| Terminal bars | 30-minute and 5-minute agree at that level with a 4,097.4 low |
| Handoff zone | treat 4,097 to 4,099 as where the market actually finished |
| Final four-hour bar | open area 4,111.9 high, 4,097.4 low, close 4,098.6, a span of 14.5 points |
| Settlement convention | 13:30 ET settlement against a session running to 17:00 ET |
| The week | opened 4,158.2, low 4,054.5, high 4,180.2, closed 4,107.0, down 0.59 per cent on a 125-point range |
| Month to date | up 8.5 points, or 0.21 per cent since June 30 |
| Four-week envelope | 4,019.0 to 4,276.2, a 257-point range; Friday closed at roughly the 34th percentile |
| Three months | down 624.8 points, or 13.20 per cent |
| Twelve months | up 611.4 points, or 17.49 per cent against a 3,470.7 low set a year ago |
| From the peak | 28.97 per cent below the 5,781.8 high of January 29 |
| Daily structure | the fourth consecutive close beneath the 20-day average |
| Swing lows | 4,019.0 on July 17, 4,054.5 earlier this week, 4,076.4 on Friday |
| Swing highs | stepping down since the July 6 peak at 4,276.2 |
| 5-day | 4,119.9, price 12.9 beneath |
| 18-day crossover | 4,120.9 |
| 9-day crossover | 4,131.0 |
| 20-day | 4,132.2, price 25.2 beneath |
| 40-day | 4,190.8 |
| 50-day | 4,280.1, price 173.1 beneath |
| 100-day | 4,558.6, price 451.6 beneath |
| 200-day | 4,620.6, price 513.6 beneath |
| Year-to-date | 4,718.3, price 611.3 beneath |
| 20-day to 50-day gap | 148 points |
| Relative strength | 14-day 44.72, down 3.93 on the session; the 9, 20, 50 and 100-day readings span 43.5 to 47.3 |
| Stochastic, 14-day | raw 41.71 per cent, fast 48.59 above slow 46.43 |
| Stochastic, 50-day and 100-day | raw 13.49 per cent and 6.62 per cent |
| Direction, 9-day | strength 19.70, positive 15.92 against negative 18.33, spread 2.41 |
| Direction, 14-day | strength 28.63, positive 15.40 against negative 21.10 |
| Direction, 20-day | strength 30.78, positive 14.96 against negative 23.02, spread 8.06 |
| Direction, 50-day | strength 20.44, positive 16.26 against negative 25.55 |
| Direction, 100-day | strength 13.05, positive 19.21 against negative 25.61 |
| Historic volatility | 9-day 21.55 per cent, 14-day 19.86, 20-day 21.23, 50-day 24.36, 100-day 26.97 |
| Composite | 56 per cent sell, strength average, direction weakening; short term 60 per cent sell, medium term 25 per cent sell, long term 67 per cent sell |
| Component split | nine of thirteen studies sell, four hold, one buy, the 50-day parabolic time and price study |
| Average true range | 9-day 91.8 (2.20 per cent), 14-day 96.3 (2.30), 20-day 100.9 (2.50), 50-day 114.4 (2.80), 100-day 111.5 (2.70) |
| Average daily range | 9-day 87.0 (2.12 per cent), 14-day 85.2 (2.07), 20-day 86.9 (2.12), 50-day 103.0 (2.51), 100-day 116.2 (2.83) |
| One-unit band on true range | 4,010.7 to 4,203.3 |
| One-unit band on daily range | 4,021.8 to 4,192.2 |
| Front-month implied volatility | 21.80 per cent |
| Proxy volatility | one-month implied 22.25 per cent against realised 21.87, a premium of 0.38 points |
| Ranks | implied volatility rank 29.23 per cent, forward-looking 15.04, skew 26.88 |
| Implied move | 5.3 dollars on the proxy, roughly 1.43 per cent, about 59 gold points |
| 4,111.4 to 4,118.0 | the decision shelf: computed target 4,111.4, 38.2 per cent off the four-week low 4,117.3, session pivot 4,118.0 |
| 4,120.9 to 4,134.7 | the six-way supply band: 18-day crossover 4,120.9, mid stochastic 4,124.5, 9-day crossover 4,131.0, 20-day average 4,132.2, crossover stall 4,134.2, first deviation 4,134.7; the proxy's upper inflection converts near 4,131 |
| 4,146.2 to 4,160.6 | second deviation 4,146.2, 50 per cent of the four-week range 4,147.6, third deviation 4,155.0, first pivot resistance 4,159.7, Thursday's close 4,160.6 |
| 4,166.7 to 4,177.9 | stochastic 70 per cent 4,166.7, Friday's high 4,170.7, momentum midpoint 4,172.1, 38.2 per cent off the four-week high 4,177.9; the proxy's previous close converts near 4,178 |
| 4,187.8 to 4,212.3 | stochastic 80 per cent 4,187.8, the 40-day average 4,190.8, second pivot resistance 4,212.3 |
| 4,254.0 / 4,276.2 | third pivot resistance; the one-month high |
| 4,097.4 to 4,107.0 | the handoff zone: terminal-session low, last traded area near 4,098.6, official settlement |
| 4,076.4 to 4,082.3 | the first base: stochastic 30 per cent 4,082.3, first deviation support 4,079.3, Friday's low 4,076.4 |
| 4,059.0 to 4,067.8 | second deviation 4,067.8, first pivot support 4,065.4, crossover stall 4,062.7, stochastic 20 per cent 4,061.2, third deviation 4,059.0; this week's low 4,054.5 marginally beneath |
| 4,015.6 to 4,023.7 | second pivot support 4,023.7, the one-month low 4,019.0, the 13-week low 4,015.6, all inside eight points |
| 3,959.1 / 3,971.1 | the 9-to-18 day crossover; third pivot support |
| 3,804.4 | the 30 per cent relative strength level, where structure thins considerably |
| Conversion ratio | approximately 11.08 futures points per dollar of the fund, a Friday-close snapshot that drifts |
| Proxy close | 370.80, down 1.69 per cent from a 377.18 previous close, on 10.67 million shares |
| Call-side positioning | negative 137.45 million |
| Put-side positioning | positive 76.81 million |
| Net | around negative 60.6 million, which reinforces direction rather than resisting it |
| Upper volatility inflection | 373 on the fund, mapping to roughly 4,131 |
| Previous close conversion | 377.18 mapping to approximately 4,178 |
| Lower volatility inflection | 336 on the fund, mapping to roughly 3,723, far enough away to be irrelevant |
| Escalation dates | a navigation ban declared July 20; a threat on July 22 to strike a bridge or power plant for each attack on Strait shipping; a July 23 statement holding Tehran responsible; talk of a negotiated arrangement July 27; a July 29 statement that strikes would answer attacks on personnel in Jordan |
| Headline timing | the report crossed 16:53 ET, roughly 3 hours after the 13:30 ET settlement, leaving about 46 hours of unhedgeable headline exposure into the 18:00 ET Sunday reopen |
| Distance to the shelf | gold settled 4.4 points beneath the computed target and roughly 11 beneath the pivot |
| Character-change threshold | any Monday advance must clear roughly 4,120 to 4,134 |
| Constructive morning sequence | a hold above 4,107, an orderly 09:45 to 10:00 period, and a prices-paid print at or below expectations allowing an advance into 4,147 and then the 4,160 to 4,178 band |
| Thursday's shelf | the post-decision advance had carried the metal into 4,160 to 4,180 before Friday's Globex session |
| Terminal compression | a 14.5-point bar after a 94-point day |
| Label caveat | the upper and lower inflection labels occasionally render inverted and are weighted below the deviation and average confluences |
| Volume | 120.39 thousand calls against 105.91 thousand puts |
| Open interest | call-heavy, put-to-call ratio 0.51 |
| Proxy position | trading essentially on its volatility inflection level, roughly 7 points below its gamma flip, inside the corridor between its walls |
| Concentrations | both positioning and directional exposure sit at the September 17 expiration |
| Commercials | 75,460 long (down 4,997) against 287,769 short (down 5,887), net negative 212,309 |
| Non-commercials | 219,622 long (down 5,163) against 37,552 short (down 3,323), net positive 182,070 |
| Managed money | 135,093 long (down 6,394) against 15,298 short (down 1,358), net positive 119,795 |
| Swap dealers | 23,661 long (down 1,298) against 215,421 short (down 3,416), net negative 191,760 |
| Producers | 15,367 long (down 194) against 35,916 short (up 1,034), net negative 20,549 |
| Other reportables | 84,529 long (up 1,231) against 22,254 short (down 1,965), net positive 62,275 |
| Open interest and volume | 284,978 against Friday's 106,211 contracts |
| Dollar index | 99.914, up 0.05 per cent, having been up 0.46 per cent at midday before fading |
| Thursday's move | dollar down 0.99 per cent to a six-week low on a weaker GDP print |
| Employment cost index | 0.9 per cent against 0.8 per cent expected, matching the prior quarter |
| Chicago purchasing index | 57.6 against 56 expected and 56.7 prior |
| Final consumer sentiment | 55.2 against 54 expected |
| July 29 decision | 9 to 3, all three dissents favouring a 25 basis point increase |
| Silver, September | 57.786, down 2.09 per cent; the gold to silver ratio near 71.1 |
| Dollar-yen | 157.354, down 1.34 per cent; suspected intervention at 13:26 ET |
| Euro-dollar | 1.15290, unchanged |
| Brent / West Texas September | 90.12, up 1.22 per cent / 84.67, up 1.29 per cent |
| Eurozone flash inflation | 2.9 per cent from 2.8, core 2.5 against 2.4 expected |
| French inflation | 2.1 per cent, accelerating from 1.8 expected |
| Other central banks | the Swiss expect to hold at zero through the end of 2027; Japan reported open to raising faster than its recent semiannual cadence |
| 02:00 ET | German real retail sales, expected negative 0.3 per cent monthly against 1.1 prior |
| 02:30 ET | Swiss consumer prices, expected negative 0.1 per cent monthly and 0.4 per cent annual |
| 03:30 ET | Swiss manufacturing survey, expected 54.8 against 54.3 |
| 03:50 / 03:55 / 04:00 / 04:30 ET | French manufacturing 50.0, German final 52.2, eurozone final 52.0, United Kingdom final 52.8 |
| 09:45 ET | final manufacturing survey, expected 53.8 |
| 10:00 ET | manufacturing survey, expected 53.9 against 53.3 prior |
| 10:00 ET | prices paid, expected 69.3 against 73.0 prior, first-order for gold |
| 10:00 ET | employment index, prior 49.7; construction spending, expected 0.2 per cent monthly |
| 15:00 ET | Treasury quarterly refunding estimates |
| Tuesday, August 4 | job openings and a 30-year inflation-protected auction, prior high yield 2.473 per cent |
| Week ahead | private payrolls, a services survey with its own prices-paid component and crude inventories Wednesday; claims, unit labour costs and a policy speaker Thursday |
| Entry | 4,110 to 4,130, only after 09:45 ET and only on a hold above 4,107 established in the opening range |
| If already above 4,135 at the cash open | do not chase; wait for a pullback into 4,115 to 4,130 that holds |
| Alternate entry | 4,085 to 4,100 on a flat reopen with 4,076.4 intact, same stop |
| Stop | 4,070, beneath Friday's low and first deviation support at 4,079.3; risk roughly 40 to 60 points |
| Target 1 | 4,147.6, take one third |
| Target 2 | 4,177.9, take a further third and move the stop to entry |
| Target 3 | 4,212.3, trail the final third, with the 40-day average at 4,190.8 as a checkpoint |
| Geometry | from 4,120 against 4,070, 50 points of risk: roughly 1 to 0.6, 1 to 1.2 and 1 to 1.8, blending near 1 to 1.2 |
| Invalidation | sustained trade beneath 4,076.4 in the New York session, or any close beneath 4,070; also a double rejection at the supply band with lower highs on declining participation |
| Macro override | cut to half on a prices-paid print materially above 69.3; exit at market on an explicit de-escalation headline |
| Trigger | no action over the weekend, reporting softens or is contradicted, and gold reopens beneath 4,107 without recovering it; requires a decisive break of 4,076.4 after 09:45 ET |
| Entry | 4,070 to 4,076 on the break, or a failed retest of 4,082 to 4,090 from beneath |
| Stop | 4,112, since reclaiming the 4,118.0 pivot would negate the breakdown |
| Targets | 4,054.5, then 4,023.7, then 4,015.6 |
| Path A, 45 per cent | reopen between 4,115 and 4,145, the supply band absorbed, opening range above 4,118.0, prices paid at or below 69.3, advance through 4,147.6 toward 4,160.6 and then 4,170.7 to 4,177.9; session high 4,165 to 4,190 |
| Path B, 20 per cent | strikes before or shortly after the reopen, gapping above 4,150, trading toward 4,190 to 4,210 |
| Path C, 35 per cent | reporting fades, reopen 4,090 to 4,110, 4,076.4 lost in the morning, decline toward 4,065 then 4,054.5, extended objective 4,023.7 to 4,015.6 |
| Reopen scenarios | strikes completed: gap toward and through 4,146 to 4,178; reporting stands with no action: firm reopen 4,115 to 4,140; walked back: 4,095 to 4,110 |
| Expected range table | upper extension 4,203, upper likely 4,178, mid most likely 4,110 to 4,135, lower likely 4,076, lower extension 4,011 |
| Skip | a reopen gapping beyond one average range, above 4,203 or below 4,011; a gap higher of more than 60 points that then trades back beneath 4,107; price between 4,095 and 4,115 at 09:45 with no conviction; active military action with headlines arriving live; five minutes either side of 10:00 ET; anything before 09:45 or after 16:00 ET |



