
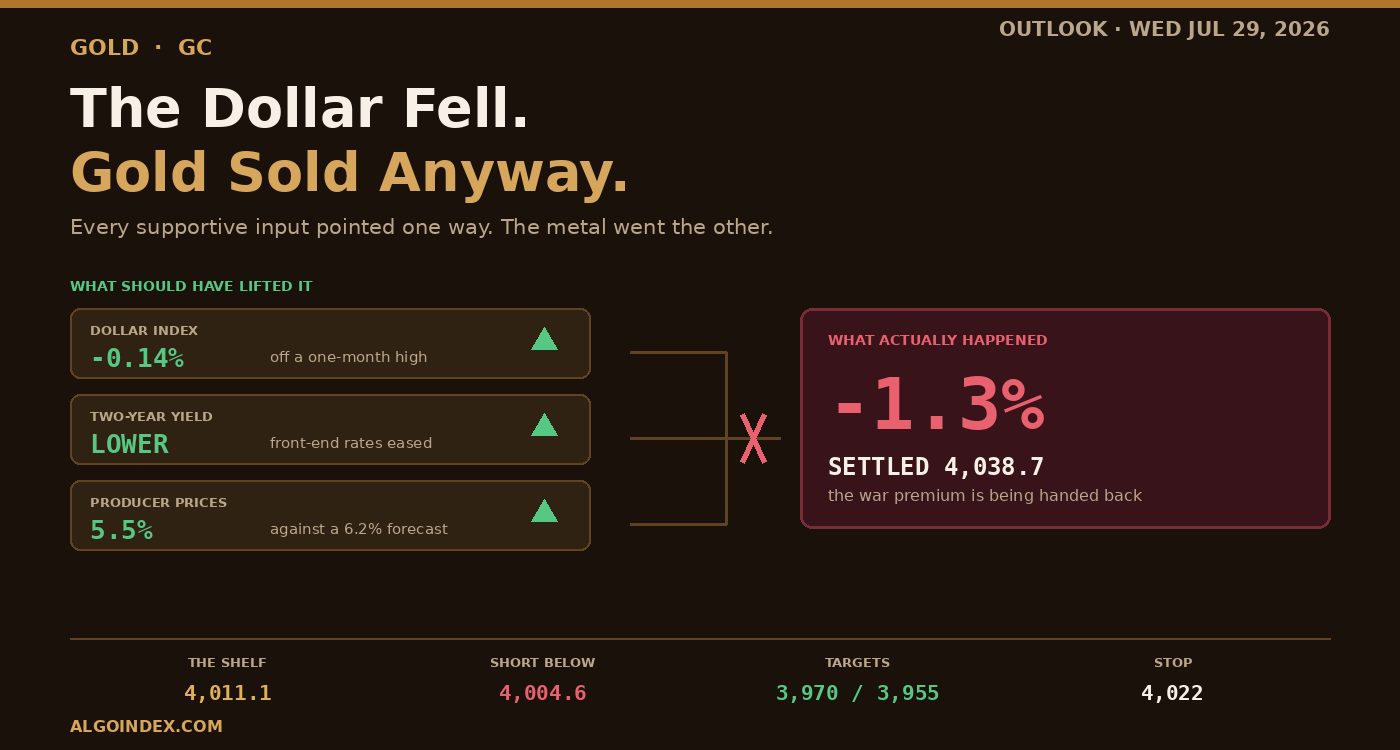
Three things happened Tuesday that should have supported gold. The dollar came off a one-month high to finish 0.14 percent lower. Front-end Treasury yields declined, taking the two-year with them. And producer prices landed at 5.5 percent where 6.2 was forecast, with the prior 6.5 percent reading revised down to 6.0.
Gold fell 1.3 percent.
Non-response like that is the most diagnostic thing about the whole day. When a market drops while its supportive inputs all point the other way, whoever is selling is not trading the currency or the yield curve. They are unwinding something else entirely, and in this case that something is a fear premium accumulated earlier this year. Monday night the metal was compressed two points from its own mean with the ranges shrinking. The consolidation resolved downward.
The headlines said one thing, the price said another
On the surface Tuesday looked like a haven day. An industry action shut a Saudi refinery running 400,000 barrels a day. Saudi air defences intercepted and destroyed several drones sent from Iraqi territory toward eastern oil facilities. A maritime authority flagged a possible incident with a vessel in Red Sea waters off Saudi Arabia. Add a navigation ban announced earlier in the month and live tension around the Strait, and any ordinary reading gets you a bid in bullion.
Crude collapsed instead. September settled 79.26, off 4.06 percent, and the international grade finished 84.09, down 4.83, both at one-week lows. Gold went with it.
The explanation runs through the diplomatic track rather than the military one. Monday brought word of Iran wanting to meet, with terms possibly reachable. Mediators, meanwhile, have floated stopping strikes for ten days as a route back toward some interim arrangement. A third country is pushing to bring Iran into fresh talks. Iran's own foreign minister stated in public that escalation is not the objective, and separately accepted that a strike on one of its own vessels had not been deliberate.
Markets priced the second set of facts and ignored the first. The international crude benchmark has retreated from near 100 to the mid-eighties, and gold is trading the identical unwind. That is the core bearish driver here: this metal took on a large war premium during the climb, and it is being returned now.
The structure is about as bearish as it reads
Every average measured sits overhead, and they line up longest to shortest going up, which is what a mature downtrend looks like on paper. The 5-day is 31.7 points overhead, the 20-day 56.6, the 50-day 219.4, and the 100-day nearly 500. Those separations are wide enough that closing them needs weeks of drift, not one strong day.
Direction readings agree without dissent, the downside line running ahead of the upside on all five windows. Strength on the 14-day and 20-day settings reads 31.95 and 32.67, both clearing the 30 mark that divides a real trend from chop. Across thirteen systems the composite prints 64 percent sell, and its short-term group prints 80.
Exactly one reading dissents. A parabolic system on the 50-day setting has turned to buy, two channel indices are on hold, and that is why the medium-term group prints only 25 percent sell. Read it as a hint that the pace of decline might be easing. It isn't a reversal signal.
Momentum is weak without being spent. Short-window stochastics sitting near 25 percent are low with plenty of room still underneath, and every relative strength lookback prints in the low forties. The 14-day only returns to neutral at 4,124.8, roughly 86 points up, and would not reach an oversold 30 until 3,761.4. Nothing in that demands a bounce.
The overnight told you something by not happening
Electronic trade reopened at 4,020.9, some 18 points under the settlement. That is a gap lower, not a recovery. Since then it has held a tight band between 4,013.2 and 4,034.0 on volume of 1,561, last near 4,019.
What matters is the absence. A heavy sell day usually delivers some mechanical covering on the reopen, and this one delivered none. No attempt has been made on the settlement. Price is instead sitting just over Tuesday's low, and a market that pauses there rather than turning leaves that low untested, which makes it vulnerable when the day session arrives.
One shelf, four references, two and a half points
Everything near-term rests on 4,011. Tuesday's session low printed 4,011.2. The weekly low sits a tenth lower at 4,011.1. Overnight the low was 4,013.2, and the first deviation support marker reads 4,013.6. Four separate methods landing within two and a half points of one another is about as clean as references get here.
Immediately below, a second band spans 4,004.7 down to 4,003.2, joining the first pivot support to the 20 percent stochastic marker and the second deviation support. Losing both bands is the trigger for continuation, and the objective under them is 3,955.4, a price where the one-month and 13-week lows coincide exactly, 83 points below here.
Overhead, the first thing any recovery must clear is a pivot at 4,045.2 with the 5-day average five points higher at 4,050.3. Heavier work waits between 4,062.5 and 4,075.3, where the 9-day crossing, the 18-day crossing, a 20-day average and the second deviation marker all pile onto roughly the same price. That band defines whether the downtrend stays intact.
Dealers will exaggerate whatever the statement produces
On the main fund proxy the call side carries negative 102.09 million of gamma and the put side positive 79.80 million, leaving a net near negative 22.29 million. When intermediaries are short gamma they chase the move instead of leaning on it, unloading into weakness and buying strength. Expect wider ranges than the recent average implies, and expect fading the extremes to work considerably less often.
Carry that into a scheduled decision and you get the setup most likely to deliver an afternoon that goes one way and keeps going. Wider stops, less size, and no fading the first move off the statement. Note too that gamma concentrates at the August 2 expiry, which loads the positioning effect into this week instead of spreading it forward.
The book itself is positioned badly for a market going down. Open interest reads 0.52 on the put-to-call measure, meaning about two calls outstanding per put, and Tuesday saw 69,300 calls trade against just 48,910 puts. Skewed that way in a declining market, those calls are a liability rather than a cushion beneath price, since they bleed value and the people holding them become sellers into any rally. Implied volatility reads 21.94 percent against realised of 21.11, and a 28.16 percent rank puts it in the bottom third of its own year. Cheap options argue for taking a directional view through defined premium instead of outright futures.
The position that has not been flushed
As of July 21, speculative accounts were still carrying 183,910 contracts net long, having cut 2,525 longs and put on 247 shorts, a weekly reduction of roughly 2,772. Weigh that against a decline of 16 percent from the 13-week high. Selling has been gradual and partial, nothing resembling capitulation.
Which cuts both directions. A washout low looks unlikely soon, since the position that would need clearing is mostly still on the books. Equally, if 3,955 gives way there is plenty of fuel sitting underneath it.
An operational note for anyone holding past Wednesday. August first notice lands Friday, three sessions away, against open interest of 109,686. Rolling will drain liquidity from the front month and stretch spreads across the back half of the week, and it speeds up right as the event volatility shows up. Outsized prints in that contract deserve scepticism.
The plan
Primary trade is a short continuation, and it does not anticipate. Entry runs 4,000 to 4,004, taken only after a 15-minute bar closes under 4,004.6, and only once the 4,011.1 shelf has broken. Sell the acceptance or sell a failed retest from underneath. Stop 4,022, back inside the prior balance, for 18 to 20 points of risk. Targets are 3,992.1, then 3,970.6, then 3,955.4, paying roughly 0.7, 1.8 and 2.7 to one. Scale at least half at the second, because the third sits on a level that has already held once and is the obvious spot for a defensive bid.
Open nothing new from 13:45 through 14:30. Anything already working at 13:45 gets cut to half with the stop pulled to entry. Two minutes of statement and press conference can wipe out every reference printed here, and short-gamma dealers mean the move keeps running instead of fading back. The particular danger to this trade is a dovish read.
The counter-trend long wants two things: the shelf defended through the morning, then a 15-minute bar closing over 4,045.2. Buy that 4,045 through 4,050 pocket when it gets retested, never on the initial break, stop at 4,028, objectives 4,062.5, then 4,075.3, then 4,085.5. Half the primary size at most. It fights everything the structure is saying.
Weighting it: compression through the morning, a test of the shelf and the band beneath, then a resolution lower after the statement takes 45 percent. A defended shelf producing relief on a dovish read takes 30, with that single parabolic buy and the depressed volatility rank as the supporting tells. Containment inside 4,004 to 4,050 with nothing resolved takes the remaining 25.
Two provenance notes, stated rather than buried. Tuesday's high and low come from working backwards through the published pivot set, since the price history page could not be reached. That derivation balances precisely against all six pivot levels, and the weekly low confirms it independently. And this review was assembled at 19:42 Eastern, well after both the 17:30 schedule and the electronic reopen, so every live quote reference belongs to the reopened session while the session statistics come from the settlement and the completed daily candle.
The complete data picture
Every number behind Wednesday’s plan, charted first; the full numeric reference follows underneath.
Full numeric reference , every remaining figure from the review
| August settlement | 4,038.7, down roughly 55 points or 1.3 percent |
| Session range | 4,085.8 to 4,011.2, a span of 74.6 points |
| Session midpoint | 4,048.5, with the settle roughly 37 percent up from the low |
| Electronic reopen | opened 4,020.9, band 4,013.2 to 4,034.0, near 4,019 |
| Reopen volume | 1,561 contracts, opening 4,020.9 roughly 18 points beneath the settle |
| 4-hour reopen candle | open 4,020.9, high 4,034.0, low 4,013.2, trading near 4,020 |
| Change of character requires | a decisive reclaim of 4,045 to 4,062 |
| Five sessions | down 136.9 points, or 3.30 percent |
| Twenty sessions | down 23.5 points, or 0.58 percent |
| Fifty sessions | down 580.5 points, or 12.63 percent |
| Hundred sessions | down 1,140.7 points, or 22.13 percent |
| Two hundred sessions | down 77.5 points, or 1.89 percent |
| Year to date | down 425.4 points, or 9.58 percent |
| 52-week high | 5,706.0, price 29.6 percent below |
| 52-week low | 3,441.5, price 16.7 percent above |
| 13-week high | 4,819.1, a decline of roughly 16 percent to the settlement |
| One-month band | 3,955.4 to 4,215.5, price at 32 percent of it |
| 52-week band position | 26 percent |
| One-month high overhead | 4,215.5, some 177 points above the settlement, unchallenged in the recent sequence |
| Weekly bar | opened 4,097.5, high 4,119.3, low 4,011.1, down 1.27 percent |
| Weighted alpha | positive 2.93 |
| 5-day | 4,050.3, price 31.7 below |
| 20-day | 4,075.2, price 56.6 below; the daily close sat 36.5 points beneath it |
| 50-day | 4,238.0, price 219.4 below |
| 100-day | 4,515.9, price 497.3 below |
| 200-day | 4,559.5, price 540.9 below |
| Year-to-date | 4,661.1, price 642.5 below |
| 20-day to 50-day spread | 162.8 points |
| 50-day to 100-day spread | 277.9 points |
| 9-day and 14-day raw stochastic | 24.95 percent, %K 38.66, %D 45.22 and 43.36 |
| 20-day raw stochastic | 20.59 percent |
| 50-day raw stochastic | 8.87 percent |
| 100-day raw stochastic | 4.35 percent |
| Relative strength, 9 / 14 / 20-day | 41.41 / 41.62 / 41.29 |
| Relative strength, 50 / 100-day | 43.28 / 46.90 |
| 14-day change on the session | down 1.56 |
| 14-day reaches 50 at | 4,124.8 |
| 14-day reaches 30 at | 3,761.4 |
| 9-day | index 25.18, positive 17.77, negative 24.93, historic volatility 19.57 percent |
| 14-day | index 31.95, positive 16.00, negative 25.27, historic volatility 21.36 percent |
| 20-day | index 32.67, positive 15.05, negative 25.77, historic volatility 20.94 percent |
| 50-day | index 20.47, positive 15.97, negative 26.09, historic volatility 24.04 percent |
| 100-day | index 12.93, positive 18.92, negative 25.60, historic volatility 27.03 percent |
| Overall | 64 percent sell |
| Short-term group | 80 percent sell |
| Medium-term group | 25 percent sell |
| Long-term group | 67 percent sell |
| Short-term components on sell | seven-day directional, moving average channel, price against the 20-day, and the 20-to-50-day crossover |
| Short-term component on hold | the 20-day volatility bands |
| The lone dissent | the 50-day parabolic system, now on buy, with the 40 and 60 day channel indices on hold |
| Average true range, 9-day | 80.2, or 2.00 percent, daily range 68.4 or 1.70 percent |
| Average true range, 14-day | 89.6, or 2.20 percent, daily range 77.4 or 1.93 percent |
| Average true range, 20-day | 97.0, or 2.40 percent, daily range 86.2 or 2.15 percent |
| Average true range, 50-day | 113.8, or 2.80 percent, daily range 102.3 or 2.55 percent |
| Average true range, 100-day | 111.1, or 2.80 percent, daily range 118.5 or 2.95 percent |
| 9-day against the 50-day | 30 percent lower |
| Tuesday's actual range | 74.6 points, beneath even the 14-day daily range |
| One-deviation band on the 14-day measure | 3,949 to 4,128 |
| Options-implied move | roughly 1.40 percent, about 56 points, giving 3,983 to 4,095 |
| Daily-range band centred on 4,019 | 3,980 to 4,058 |
| First barrier | the pivot at 4,045.2 with the 5-day average at 4,050.3 |
| Just above | 4,054.8, a 38.2 percent retracement from the four-week low |
| The heaviest band | 4,062.5 to 4,075.3, holding the 9-day crossing, the 18-day crossing at 4,075.3, the 20-day average at 4,075.2, the second deviation at 4,074.2, the stochastic stall at 4,070.4 and the first deviation at 4,063.8 |
| Above that | 4,079.2 first pivot resistance, 4,082.1 third deviation |
| Session high pairing | 4,085.5 fifty percent retracement with Tuesday's 4,085.8 high |
| Further out | 4,116.1, then 4,119.3 weekly high with 4,119.8 second pivot resistance |
| Beyond | 4,124.8, 4,153.8 third pivot resistance, 4,164.0 the 40-day crossing, 4,215.5 the one-month high |
| The critical shelf | 4,011.1 to 4,013.6, holding the session low 4,011.2, the weekly low 4,011.1, the overnight low 4,013.2 and the first deviation support 4,013.6 |
| Second critical band | 4,003.2 to 4,004.7, holding the first pivot support 4,004.6, the 20 percent stochastic marker 4,004.7 and the second deviation support 4,003.2 |
| Minor shelf | 3,995.3 third deviation support, 3,992.1 where the 9-day crossing stalls |
| Next objective | 3,970.6, second pivot support, the 3,970 area on a hawkish read |
| Major objective | 3,955.4, the one-month and 13-week low at the same price, 83 points down |
| Beneath | 3,930.0 third pivot support, 3,761.4 momentum oversold, 3,441.5 the 52-week low |
| Call gamma | negative 102.09 million |
| Put gamma | positive 79.80 million |
| Net | approximately negative 22.29 million |
| Proxy close | 369.51, down 1.35 percent from 374.56, volume 6.34 million shares |
| Implied one-day move | 5.19, roughly 1.40 percent, about 56 points on futures |
| Gamma concentration expiry | August 2 |
| Largest delta expiry | September 17 |
| Volatility markers, low confidence | 413 and 333, roughly 4,460 and 3,596 in futures terms |
| Put-to-call open interest | 0.52 |
| Session volume | 69,300 calls against 48,910 puts |
| Implied / realised volatility | 21.94 / 21.11 percent |
| Implied volatility rank | 28.16 percent |
| Commercial | long 80,457 up 818, short 293,656 down 771 |
| Non-commercial | long 224,785 down 2,525, short 40,875 up 247, net long 183,910 |
| Net weekly reduction in bullish exposure | roughly 2,772 contracts |
| Open interest, August contract | 109,686 |
| First notice day | Friday July 31, three sessions out |
| Dollar index | down 0.14 percent, having come off a one-month high |
| Front-end yields | lower, with the two-year declining |
| Seven-year auction | 4.473 percent against 4.260 percent prior, cover 2.490 against 2.500 |
| Producer prices | 5.5 percent year on year against a 6.2 percent forecast, prior 6.5 percent revised to 6.0 |
| Case-Shiller 20-city | 1.6 percent year on year against 1.3 percent forecast, the largest rise in ten months |
| Consumer confidence | 90.8 against a 92.4 forecast, down 1.4 points |
| Crude, September | 79.26, down 3.35 or 4.06 percent |
| International crude | 84.09, down 4.27 or 4.83 percent, retreated from near 100 |
| Natural gas / diesel / gasoline | 2.6620 / 4.1509 / 3.3345 |
| On the ground | a July 27 attack shut a 400,000 barrel per day Saudi refinery |
| Air defence | several drones launched from Iraqi territory at eastern oil facilities intercepted and destroyed |
| Maritime | a potential vessel incident reported in the Red Sea off the Saudi coast |
| Earlier in the month | a navigation ban announced by Yemeni forces |
| Strait tension | a US official stating Iran is overreaching in its demands |
| Diplomatic track | Iran wants to meet and a deal is possible, per Monday's statement |
| Mediation | a proposed ten-day cessation of strikes to revive an interim arrangement |
| Third-party channel | a separate push to bring Iran into new talks |
| Entry zone | 4,000 to 4,004, on a 15-minute close beneath 4,004.6 after a break of 4,011.1 |
| Stop | 4,022, roughly 18 to 20 points of risk |
| Target 1 | 3,992.1, approximately 12 points, roughly 0.7 to 1 |
| Target 2 | 3,970.6, approximately 33 points, roughly 1.8 to 1 |
| Target 3 | 3,955.4, approximately 49 points, roughly 2.7 to 1 |
| Management | scale at least half at the second target and trail the balance |
| Invalidation | a 15-minute close back above 4,022; a reclaim of 4,045.2 on volume inverts the structure |
| Macro override | no new entries between 13:45 and 14:30; halve any working position at 13:45 and move the stop to break even |
| Trigger | the 4,011.1 shelf defended in the morning, then a 15-minute close above 4,045.2 |
| Entry zone | 4,045 to 4,050 on the retest |
| Stop | 4,028, roughly 18 to 21 points of risk |
| Target 1 | 4,062.5, approximately 15 points |
| Target 2 | 4,075.3, approximately 28 points |
| Target 3 | 4,085.5, approximately 39 points |
| Reward | approximately 1:0.8, 1:1.6 and 1:2.2 |
| Sizing | no more than half the primary setup |
| Compression then resolution lower | 45 percent, closing 3,960 to 4,000 |
| Defended shelf and relief rally | 30 percent, closing 4,055 to 4,085 |
| Range containment, nothing resolved | 25 percent, closing 4,010 to 4,045 |
| Low band | 3,955 to 3,995 |
| Most likely band | 4,004 to 4,055, with both methods pointing to containment near 3,980 to 4,060 |
| High band | 4,062 to 4,090 |
| Opening range | no entries before 09:45 |
| Event bracket | no new entries between 13:45 and 14:30 |
| Insufficient range | if the pre-statement range is under 25 points by 13:00, stand aside |
| No edge | price opening inside 4,011 to 4,045 and oscillating without touching either boundary |
| Carry risk | reduce size into Thursday's data block and account for the August roll |
| 04:00 | Euro area wage tracker |
| 04:30 | UK consumer credit, forecast 1.7 billion against 1.662 billion prior |
| 04:30 | UK mortgage lending, forecast 3.9 billion against 2.889 billion prior |
| 04:30 | UK mortgage approvals, forecast 57.1 thousand against 56.205 thousand prior |
| 10:30 | Crude inventories, a 1 million barrel build forecast against 2.010 million prior |
| 13:30 | Bank of Canada minutes |
| 14:00 | Rate statement and decision, 3.75 percent forecast and prior |
| 14:30 | Press conference, under new leadership |
| Thursday 07:00 | Bank of England |
| Thursday 08:30 | Personal consumption deflator, headline 3.7 percent against 4.1 percent prior, core 3.3 percent against 3.4 percent, advance growth 2.1 percent, claims 200 thousand against 187 thousand |
| Thursday evening | Bank of Japan |
| Session extremes | derived by algebraic reconciliation from the published pivot set, reconciling exactly across all six levels and corroborated by the weekly low |
| Run timing | assembled at 19:42 ET against a 17:30 schedule, after the electronic reopen |
| Dealer readings | derived from the gold fund proxy rather than futures options, and translating to futures approximately rather than precisely |
Follow-up: a war headline bought 121 points and kept 42 of them into the inflation print. Read the Thursday July 30 gold outlook.



