
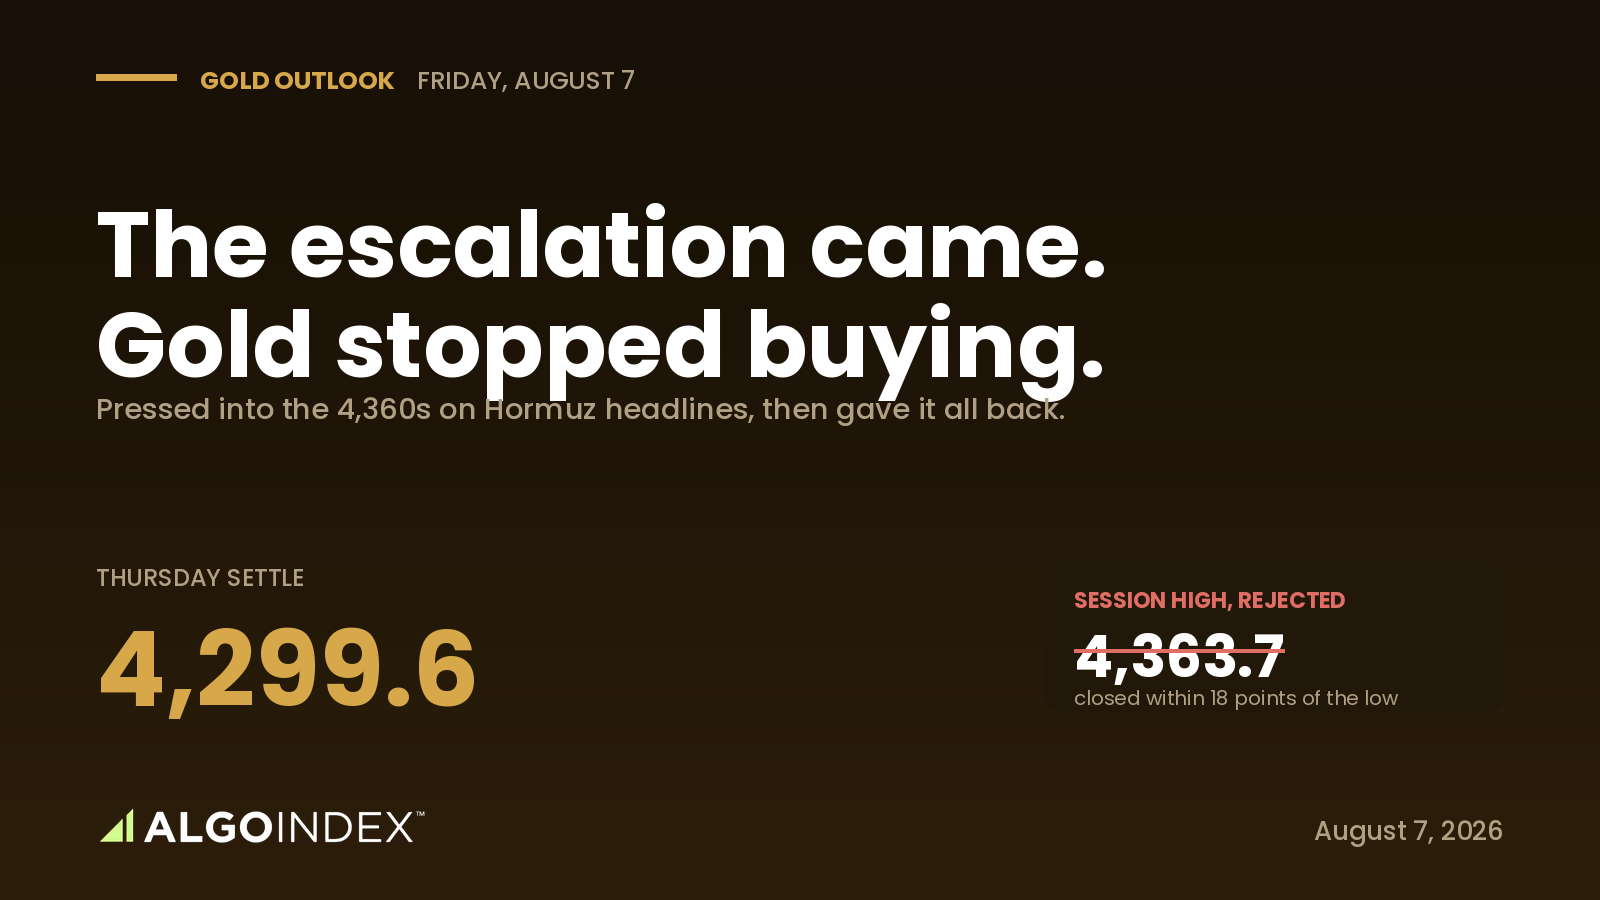
Thursday put gold out at 4,299.6, a loss of 5.6 points, on a day it had earlier traded up to 4,363.7. The escalation everybody had been braced for finally landed, and the metal quit buying it.
That is a more important fact than the settlement.
The same Strait headlines moved crude the other way: Crude Oil (CL): the Strait reopens, just not for everyone.
What the session actually did
Trade began close to 4,298 and ground upward across the European morning while Strait of Hormuz headlines accumulated. The pace picked up past 11:49 on word that a prospective deal would exclude American and Israeli hulls from the waterway, and picked up again past 15:24 when state media said Iranian forces had hit targets within the Strait itself.
That flow produced the high. Extension never came. Instead the metal drained away over the last ninety minutes to settle 4,299.6, returning some 64 points and finishing inside the bottom quarter of an 82.5-point day.
Turnover reached 161,440 contracts. Finish that close to the bottom of a wide range, on participation like that, and you are watching sellers meet buyers at a specific price. Apathy does not produce that shape.
The week was a war premium
Across five sessions the metal has picked up 208.4 points, 5.07 per cent, its best week going back to January. Almost every point of that is geopolitical.
Look at what the metal has been climbing against. Three dissents came out of the 29 July vote, each one pressing for a quarter-point rise instead of a cut. Rate futures at the front end price tightening. Yields on the ten-year stand at 4.680 per cent and climbed again Thursday. And the dollar finished firm around 99.95 on the back of solid data.
Thursday's data made it worse. Claims printed 199,000 where 205,000 was penciled in, a second consecutive reading under 200,000. Productivity landed 1.4 per cent against an expected 0.6, a wide beat. Labour costs per unit rose just 1.3 per cent where 2.1 was forecast. More output per hour with costs held down takes pressure off prices at the margin and drains urgency from any case for easing.
Each of those readings pushes against an asset paying nothing. The metal added 5 per cent regardless. Which tells you precisely how much of this belongs to the waterway and nothing besides.
It also tells you what happens the day the waterway is settled.
What Washington said while gold was being sold
Riyadh delivered the week's most alarming statements on Thursday afternoon. Officials said drones and missiles had been seen moving in a way that suggests strikes arriving from two directions at once, and they listed what might be hit: civilian and economic sites, power and fuel installations, ports, airports. Operational cooperation with American command stays strong, they added, and the kingdom would answer aggression, though they called the whole set of reports shocking given the active effort to calm things.
Washington told a different story. The president described the channel as sort of open, said he has taken personal charge of the negotiation, doubted Tehran could keep this up, and forecast an end to the fighting before long. Days earlier the Treasury Secretary had floated an imminent reopening agreement, with Qatar confirming that draft language existed.
That is where the asymmetry sits. Three weeks of building and 345 points of premium now ride in this contract, and one headline takes it out. Turning away at the high on the very day the escalation was sharpest says traders have already lost their appetite for paying up for more of it.
The wall overhead
Three unrelated methods converge inside eight points.
First is 4,363.7, which is both Thursday's high and the high for the month. Second is the projection target, 4,370.1. Third is a 38.2 per cent retracement drawn off the yearly low, 4,370.5. Then positioning adds a fourth: 396 on the fund proxy, its upper volatility inflection, converts to about 4,371 on the futures.
Chart structure, retracement arithmetic and dealer books each picked out the same window without reference to one another. Rare, and when it happens the level usually earns its keep.
Under the shelf, real resistance starts at 4,347.7 through 4,348.5, a single point separating a quarterly retracement from first pivot resistance. Expect an advance on Friday to run out of momentum there before anywhere else.
Where the buyers should be
Support is layered tightly, which is what makes a pullback entry workable rather than a hope.
A 9 to 40 day crossing at 4,307.9 and a stochastic 80 marker at 4,299.8 sit essentially on top of where Thursday finished. Those nine points form the first shelf, and its behaviour in the Friday morning session tells you something on its own.
Under that, 4,288.0 marks the overnight low and is the first break that would say this recovery is running out. Thursday's 4,281.2 sits just below. Lose it and the four-hour series has printed a lower low.
The pocket worth marking sits between 4,267.8 and 4,266.0, a stochastic 70 reading alongside first pivot support. Roughly half a daily range beneath current trade, and the natural place for a healthy dip to find bids. Go deeper and you reach 4,232.0 alongside 4,232.3, a third of a point apart, pairing second pivot support with a four-week retracement. Treat that pair as the structural line under the whole recovery.
The overnight is quietly constructive
The evening session came back at 18:00, dropped as far as 4,288.0, then climbed to trade around 4,312, which puts it 12.8 points above where Thursday finished.
Around 13,800 lots is thin enough that nobody should lean on it. Still, clawing the whole afternoon decline back within six hours points to books being squared before the labour release, not anything resembling real distribution.
The open interest number agrees. It slipped from 301,570 to 299,031, roughly 2,540 contracts gone, set against turnover of 161,440. When positions shrink on a lower day that turned away from its high, the likeliest explanation is longs closing out before the bell, not new shorts arriving. Mildly encouraging, then.
Dealers are short calls
Gold futures carry no directly observable positioning surface, so the exchange-traded fund stands in. Translation runs roughly 11.04 futures points per proxy dollar, using 389.57 against 4,299.6 at Thursday's close.
On the call side dealer exposure prints minus 224.64 million; on the put side, plus 102.64 million. Negative on the calls means the dealers are short them, and being short calls destabilises the upside by construction. Prices climb, they buy to stay hedged, and the advance lengthens instead of fading.
Flow says the same. Calls traded 329,880 contracts against 113,750 puts, a ratio near 2.90, with open interest between the two at 0.5. Upside has been bought hard.
Which is exactly why 4,371 carries so much weight. Clear it and the book starts amplifying, so moves extend. Stay under it and the book damps, so ranges hold. Expiry sits on 17 September, a long way past Friday, and the next expiry accounts for just 7.29 per cent of exposure, so near-dated effects stay small.
Options look cheap
Realised volatility over one month reads 25.03 per cent; implied over the same window, 23.56. Implied is running roughly a point and a half under what the metal has actually been delivering.
Finding options marked under realised the night before a labour release is unusual, and it leaves premium comparatively cheap for anyone who wants to express a direction. An implied rank of 33.79 per cent places these contracts in the bottom third of where they have traded across the year.
Skew offers a counterpoint. Ranked at 65.22 per cent, downside protection still commands a real relative bid despite all that call activity. Reasonable, given the bid underneath this market comes from political risk that can turn on a sentence.
What the rest of the complex is saying
Silver carries the encouraging signal. It ended Thursday 1.09 per cent lower, trailing gold badly, then turned hard in the evening toward 62.38, a 1.26 per cent gain against 0.30 for the metal itself. When silver pulls gold up rather than the reverse, the configuration is healthier, because a broad bid is doing the work instead of a purely defensive one.
The wider picture was defensive with energy layered over it. Shares finished lower, 0.18 per cent off on the broad measure and 0.43 on the technology one. Government paper sold alongside them, a pairing that speaks to worry about prices rather than fear about growth. Equity volatility shed 4.18 per cent to close 15.14, extraordinarily calm against these headlines, and a sign that share markets have yet to price any serious political tail.
Oil led everything. The front crude contract gained 2.75 per cent and added another 1.02 overnight to reach 78.08, with Brent through 82 dollars and energy shares up 1.48 per cent. The gold fund proxy finished 389.57, flat to a hair at plus 0.01 per cent.
What Friday hinges on
Payrolls at 8:30, forecast 80,000 against a 57,000 prior, with unemployment expected to hold 4.2 per cent and wages at 0.3 per cent monthly, 3.5 annual.
Spell out the reaction function carefully, because this one runs backwards from the familiar version. What policy makers are arguing about is whether to tighten further, not when to start cutting. A soft number therefore reads mainly as less risk of a rise, and that helps the metal. A firm one strengthens the case for that rise, and hurts it. With the argument sitting on the tightening side of the ledger, a strong release threatens more downside here than a weak one promises upside.
The wage line is where it transmits. Hot wages alongside a strong payroll count is the least favourable pairing available.
A second-tier release deserves a look. Household price expectations land at 11:00, forecast 3.65 per cent where the last read gave 3.67. Surprise to the upside with oil climbing and you revive the stagflation framing that has historically been kind to this metal. That channel is already open.
The trade
Buy the dip, not the wall. Work an entry band of 4,270 up to 4,292, and only past 9:45, and only once the level proves it is holding: a wick that rejects lower prices, a higher low on the fifteen-minute chart, or price taking 4,299 back from underneath. Leave it alone on first contact inside the 8:30 reaction window.
Risk to 4,231, which sits under the paired references at 4,232. From a 4,281 fill that is about 50 points. Book at 4,348, then 4,363, then 4,397, paying roughly 1.34, 1.65 and 2.32 to one. The furthest of those only counts if 4,371 has been accepted first.
One fifteen-minute close under 4,232 finishes the idea. And if 4,299 has not been taken back within an hour and a half of entry, read that as the structure being weaker than the thesis assumed.
A conditional short exists as well, and it is the weaker of the pair, because it works against a rising short-term trend, and because the book overhead amplifies rallies. Should the morning lift price into that shelf and then produce a fifteen-minute bar closing back under the shelf having traded above it, sell between 4,358 and 4,366, risk to 4,398, aim at the daily pivot and then the overnight low. A second failure at the same place on a labour-report day would confirm the supply there is real. Keep it small and flatten before the weekend.
One override outranks all of it. A believable de-escalation story, above all a confirmed reopening deal, strips out the premium that built this entire week. Step aside or get out, whatever the chart is saying. In the same way, payrolls above roughly 130,000 paired with wages at 0.4 per cent or better strengthens the tightening argument enough to void the constructive lean.
What we are watching
Base case: a session that trades both ways and settles constructively while breaking no new ground. The labour figure produces a move that gets at least partly given back once cash trade opens. Bids appear either around 4,288 through 4,308 or lower down in the pocket near 4,266. Anyone who missed this week uses that dip to get long before a weekend that carries genuine risk. The metal closes in the top half of the middle band, having probed the shelf without settling the question.
Weight a constructive pullback and recovery at 45 per cent, an upside resolution through 4,348 at 30, a downside break that loses 4,288 and works toward 4,232 at 25.
Friday's afternoon brings one specific consideration. Riyadh has warned publicly about paired strikes on power and fuel installations, and earlier reporting had attacks on Iranian energy assets possibly landing across a weekend. That makes a rational case for carrying length into the bell instead of flattening, which argues for firmness in the last hour regardless of what the morning produced, and makes staying short into the settlement decidedly unappealing.
One more thing to watch for. A second turn away from that shelf, on an employment Friday, would be a significant bearish signal for the week ahead. Once is supply. Twice is a ceiling.The complete data picture
Every number behind Friday’s plan, charted first; the full numeric reference follows underneath.
Full numeric reference , every remaining figure from the review
Full data reference
Every figure behind the analysis above. Front-month gold, contract GCZ2026, session of Thursday 6 August 2026, prepared for Friday 7 August. Dollars per ounce unless marked otherwise.
| Reference | Value |
|---|---|
| Settlement | 4,299.6, down 5.6 points or 0.13 per cent |
| Open | near 4,298 |
| Session high | 4,363.7, also the one-month high |
| Session low | 4,281.2 |
| Range | 82.5 points |
| Close relative to the low | within 18 points |
| Give-back from the high | approximately 64 points |
| Close position | the lower quartile of the range |
| Volume | 161,440 contracts |
| Five-session change | up 208.4 points or 5.07 per cent, the strongest week since January |
| Reference | Value |
|---|---|
| Globex reopen | 18:00 Eastern at 4,298.3 |
| Overnight low | 4,288.0 |
| Overnight high | 4,320.8 |
| Late-evening trade | near 4,312, up 12.8 points or 0.30 per cent on the settlement |
| Overnight volume | approximately 13,800 contracts |
| Four-hour candle | open 4,314.6, high 4,320.8, low 4,305.4, close 4,312.5 |
| Fifteen-minute candle | open 4,308.2, high 4,313.9, low 4,305.4, close 4,313.4 |
| Five-minute close | 4,313.4, closing on its high |
| Reference | Value |
|---|---|
| 52-week high | 5,781.8; price 25.36 per cent below |
| 52-week low | 3,498.2; price 23.36 per cent above |
| One-month high | 4,363.7, set Thursday |
| One-month low | 4,019.0 |
| 13-week high | 4,885.0 |
| 13-week low | 4,015.6 |
| Advance off the one-month low | 344.7 points in roughly three weeks |
| Twenty-day change | up 141.8 points or 3.40 per cent |
| Fifty-day change | down 229.7 points or 5.05 per cent |
| Year-over-year | up 25.61 per cent |
| Weighted alpha | plus 9.92 |
| Relative strength | 59.75, improved by 0.97 on the session |
| Reference | Value |
|---|---|
| 5-day | 4,232.7, price above by roughly 77 points |
| 20-day | 4,142.2, price above by roughly 168 points |
| 50-day | 4,242.4, price above by roughly 68 points |
| 100-day | 4,506.6, price below by roughly 197 points |
| 200-day | 4,615.7, price below by roughly 306 points |
| Year-to-date | 4,702.1, price below by roughly 392 points |
| Reference | Value |
|---|---|
| 9-day | raw 84.41 per cent, %K 85.11, %D 74.62, strength 67.52 |
| 14-day | raw 84.41 per cent, %K 85.64, %D 75.83, strength 59.75 |
| 20-day | raw 85.99 per cent, %K 86.65, %D 75.96, strength 54.44 |
| 50-day | raw 44.26 per cent, %K 42.98, %D 34.21, strength 48.16 |
| 100-day | raw 25.40 per cent, %K 24.11, %D 18.68, strength 49.20 |
| Where 14-day strength reaches 70 | 4,545.3 |
| Reference | Value |
|---|---|
| 9-day | index 25.49, positive 30.02, negative 10.38 |
| 14-day | index 26.01, positive 25.02, negative 14.90 |
| 20-day | index 26.56, positive 21.78, negative 18.25 |
| 50-day | index 20.00, positive 18.70, negative 23.56 |
| 100-day | index 13.13, positive 20.36, negative 24.57 |
| Reference | Value |
|---|---|
| Overall | 32 per cent buy across thirteen studies |
| Trend signal | buy |
| Short-term group | 60 per cent buy |
| Medium-term group | 50 per cent buy |
| Long-term group | 67 per cent sell |
| Signal strength | minimum; signal direction average |
| Reference | Value |
|---|---|
| 9-day | true range 91.5 points or 2.10 per cent, daily range 93.9 points or 2.18 per cent |
| 14-day | true range 95.0 points or 2.20 per cent, daily range 88.7 points or 2.06 per cent |
| 20-day | true range 99.0 points or 2.30 per cent, daily range 88.3 points or 2.05 per cent |
| 50-day | true range 112.3 points or 2.60 per cent, daily range 103.0 points or 2.39 per cent |
| Historic volatility | 22.44 per cent at 9 days, 23.05 at 14, 23.58 at 20, 25.92 at 50, 27.26 at 100 |
| At-the-money implied across the term structure | roughly 20 to 24 per cent |
| One true range band from a 4,310 reference | approximately 4,215 to 4,405 |
| Options-implied band | approximately 4,236 to 4,364 |
| Reference | Value |
|---|---|
| 4,314.8 | the daily pivot |
| 4,320.8 | the overnight high |
| 4,347.7 | 38.2 per cent retracement from the 13-week low |
| 4,348.5 | 1st pivot resistance |
| 4,363.7 | Thursday's high and the one-month high |
| 4,370.1 | the projected target price |
| 4,370.5 | 38.2 per cent retracement from the 52-week low |
| 4,371 | the translated upper volatility inflection, from 396 on the proxy |
| 4,385.7 | where the 3 to 10 day crossover stalls |
| 4,397.3 | 2nd pivot resistance |
| 4,403.5 | one deviation of resistance |
| 4,431.0 | 3rd pivot resistance |
| 4,446.6 | two deviations of resistance |
| 4,450.3 | 50 per cent of the 13-week range |
| 4,479.6 | three deviations of resistance |
| 4,545.3 | where 14-day strength would reach 70 |
| 4,552.9 | 38.2 per cent retracement from the 13-week high |
| 4,640.0 | 50 per cent of the 52-week range |
| 4,885.0 | the 13-week high |
| Reference | Value |
|---|---|
| 4,307.9 | where price crosses the 9 to 40 day average |
| 4,299.8 | 14 by 3 raw stochastic at 80 per cent |
| 4,299.6 | Thursday's settlement |
| 4,288.0 | the overnight low |
| 4,281.2 | Thursday's session low |
| 4,267.8 | 14 by 3 raw stochastic at 70 per cent |
| 4,266.0 | 1st pivot support |
| 4,232.3 | 38.2 per cent retracement from the four-week high |
| 4,232.0 | 2nd pivot support |
| 4,203.9 | 14 by 3 raw stochastic at 50 per cent |
| 4,195.7 | 50 per cent of the four-week range |
| 4,183.5 | 3rd pivot support, one deviation of support, and the 40-day stall, in a dense band |
| 4,176.6 | the 40-day average crossing |
| 4,163.9 | the 9-day average crossing |
| 4,152.6 | two deviations of support |
| 4,119.6 | three deviations of support |
| 4,019.0 | the one-month low |
| 4,015.6 | the 13-week low |
| Reference | Value |
|---|---|
| Proxy close | 389.57, trading near 388.90, down 0.17 per cent |
| Translation ratio | approximately 11.04 futures points per proxy dollar |
| Call-side dealer exposure | minus 224.64 million |
| Put-side dealer exposure | plus 102.64 million |
| Call volume | 329,880 contracts |
| Put volume | 113,750 contracts |
| Call to put volume ratio | approximately 2.90 |
| Put-to-call open interest | 0.5 |
| Upper volatility inflection | 396 on the proxy, roughly 4,371 in futures terms |
| Lower volatility inflection | 335 on the proxy, roughly 3,698 in futures terms |
| Primary expiry | 17 September, for both positioning and direction |
| Next-expiry exposure | 7.29 per cent of the total |
| One-month realised volatility | 25.03 per cent |
| One-month implied volatility | 23.56 per cent |
| Implied volatility rank | 33.79 per cent |
| Skew rank | 65.22 per cent |
| Options-implied move | 5.79 dollars or 1.49 per cent, approximately 64 futures points |
| Reference | Value |
|---|---|
| Open interest | 299,031, down from 301,570 |
| Change | a reduction of approximately 2,540 contracts |
| Session volume | 161,440 |
| Interpretation | falling open interest on a down day that reversed from a high is most consistent with long liquidation into the close |
| Reference | Value |
|---|---|
| Initial claims | 199,000 against a 205,000 forecast, the second consecutive reading beneath 200,000 |
| Continued claims | 1.801 million against a 1.789 million forecast |
| Preliminary productivity | 1.4 per cent against a 0.6 per cent forecast |
| Preliminary unit labour costs | 1.3 per cent against a 2.1 per cent forecast |
| Dollar index | closed firm near 99.95, at 99.946 overnight |
| Ten-year yield | 4.680 per cent, futures-implied 4.687, up 0.26 per cent overnight |
| July policy vote | nine to three, all three dissents favouring a 25 basis point increase |
| Swiss policy | rates expected at zero through the end of 2027 |
| Japanese policy | reported open to raising faster than a six-month cadence; pricing implies roughly two and a half increases before mid-2027 |
| Reference | Value |
|---|---|
| Broad equity index | down 0.18 per cent, futures near 7,732 overnight |
| Technology index | down 0.43 per cent at the close, firmer overnight near 29,530 |
| Implied equity volatility | 15.14, down 4.18 per cent |
| Front-month crude | up 2.75 per cent, extending to near 78.08 overnight, up another 1.02 per cent |
| Brent | above 82 dollars |
| Energy equities | up 1.48 per cent |
| Natural gas | down 0.53 per cent overnight |
| Silver | down 1.09 per cent Thursday, then near 62.38 overnight, up 1.26 per cent |
| Gold fund proxy | 389.57, plus 0.01 per cent |
| Reference | Value |
|---|---|
| 11:49 | reports that a prospective arrangement would prohibit American and Israeli vessels from transiting the Strait |
| 15:24 | state media reported Iranian forces struck hostile targets inside the Strait |
| 15:25 | two explosions reported on Qeshm Island near the Strait entrance |
| Late afternoon | Saudi officials reported drones and missiles being relocated, hinting at coordinated attacks from both north and south |
| Named potential targets | civilian and economic sites, energy infrastructure, ports, airports |
| Washington | the strait is sort of open, personal involvement in the negotiation, doubt Iran can continue much longer, the war ends soon |
| Earlier in the week | the Treasury Secretary indicated a reopening deal might be reached imminently; Qatar confirmed drafted language |
| Reference | Value |
|---|---|
| Entry zone | 4,270 to 4,292, only after 09:45 and only on evidence the level is holding |
| Entry evidence required | a rejection wick, a higher low on the fifteen-minute series, or a reclaim of 4,299 from beneath |
| Stop | 4,231 |
| Risk from a 4,281 fill | approximately 50 points |
| Target 1 | 4,348, approximately 67 points |
| Target 2 | 4,363, approximately 82 points |
| Target 3 | 4,397, approximately 116 points, valid only on acceptance above 4,371 |
| Reward ratios | approximately 1 to 1.34, 1 to 1.65, 1 to 2.32 |
| Invalidation | a fifteen-minute close beneath 4,232; failure to reclaim 4,299 within ninety minutes is a warning |
| Macro override | a credible de-escalation headline, or payrolls above roughly 130,000 with wages at 0.4 per cent or higher |
| Reference | Value |
|---|---|
| Trigger | a fifteen-minute close back beneath 4,363 after trading above it |
| Entry | 4,358 to 4,366 on the rejection close |
| Stop | 4,398 |
| Target 1 | 4,314, the daily pivot |
| Target 2 | 4,288, the overnight low |
| Reward ratios | approximately 1 to 1.15 and 1 to 1.85 |
| Note | lower quality than the primary; it fights the short-term trend and positioning above 4,371 amplifies upside |
| Reference | Value |
|---|---|
| Path A, constructive pullback then recovery | 45 per cent. Payroll near or above forecast, a dip into 4,266 to 4,299 that holds, recovery toward 4,340 to 4,363. |
| Path B, upside resolution | 30 per cent. Payroll disappoints or an escalation lands, 4,348 clears, the shelf is challenged, acceptance opens 4,385 to 4,405. |
| Path C, downside break | 25 per cent. A strong payroll with hot wages, or a credible de-escalation, loses 4,288 then 4,281 toward 4,232. |
| Low band | 4,232 to 4,266 |
| Mid band | 4,288 to 4,348, a 60-point span |
| High band | 4,363 to 4,405 |
| Reference | Value |
|---|---|
| Timing | any entry attempt before 09:45 |
| Location | price opens the cash session inside 4,363 to 4,371 with no clear rejection or acceptance |
| Expansion | realised range in the first hour of cash trade exceeds roughly 120 points |
| Headline | a Strait headline lands during the opening range window; allow at least thirty minutes |
| Dead middle | price between 4,300 and 4,340 with no established opening range direction |
| Reference | Value |
|---|---|
| 02:00 | German industrial production monthly, forecast 0.2 per cent, prior 0.9 per cent |
| 02:00 | German exports monthly, forecast 0.5 per cent, prior 0.9 per cent |
| 02:00 | German imports monthly, forecast 2.0 per cent, prior minus 2.5 per cent |
| 02:00 | German trade balance, forecast 17.2 billion, prior 19.1 billion |
| 08:30 | Nonfarm payrolls, forecast 80k, prior 57k, the first-order event |
| 08:30 | Unemployment rate, forecast 4.2 per cent, prior 4.2 per cent |
| 08:30 | Average hourly earnings, forecast 0.3 per cent monthly and 3.5 per cent annual, both unchanged |
| 08:30 | Private payrolls, forecast 80k, prior 49k |
| 08:30 | Average workweek, forecast 34.3, prior 34.3 |
| 08:30 | Canadian employment change, forecast 20k, prior 18.2k; unemployment 6.5 per cent, unchanged |
| 10:00 | A policy official speaks |
| 10:00 | Canadian purchasing index, prior 56.2 |
| 11:00 | Household one-year inflation expectations, forecast 3.65 per cent, prior 3.67 per cent |
| 15:00 | Consumer credit, forecast 12.0 billion, prior minus 0.18 billion |
| 12 August | consumer prices, headline forecast 3.4 per cent annual against 3.5 prior, core 2.5 against 2.6 |
| Reference | Value |
|---|---|
| Thursday's claims figure, restated | 199k against a 205k forecast |
| Payroll override threshold | a print above roughly 130k with wages at or above 0.4 per cent |
| Overnight expectation | range-bound between 4,288 and 4,325 absent fresh headlines |
| Pre-release caution | liquidity thins into the 07:00 to 08:30 window; a push toward 4,347 before the release would most likely be positioning rather than conviction |
| Thin support beneath the structural line | 4,203.9, then a dense band running 4,183 to 4,196 containing third pivot support, one deviation of support, the 40-day crossing and stall, the four-week 50 per cent retracement and the 14-day strength 50 level |
| The demand pocket, restated | 4,266 to 4,268, roughly half an average daily range beneath the market |
| Opening-range reference | whether price sits above or below 4,314.8 as the range forms |
| Quarterly position | the lower third of the 13-week band despite the recent surge |
| Swing pivots on the four-hour | 4,363.7 above and 4,281.2 below, with the overnight low at 4,288.0 the nearer reference |
| Rejection framing | Thursday's turn constitutes a lower high only if price fails to reclaim 4,363.7 |
| Session character | gold sits slightly below the midpoint of its annual range; the 4-hour series has printed higher highs and higher lows since the 4,019.0 base |
| Afternoon window | firmness expected into the 15:00 to 16:00 window regardless of the morning direction |
| Equity volatility, restated | 15.14, a subdued reading against the headline environment |



