
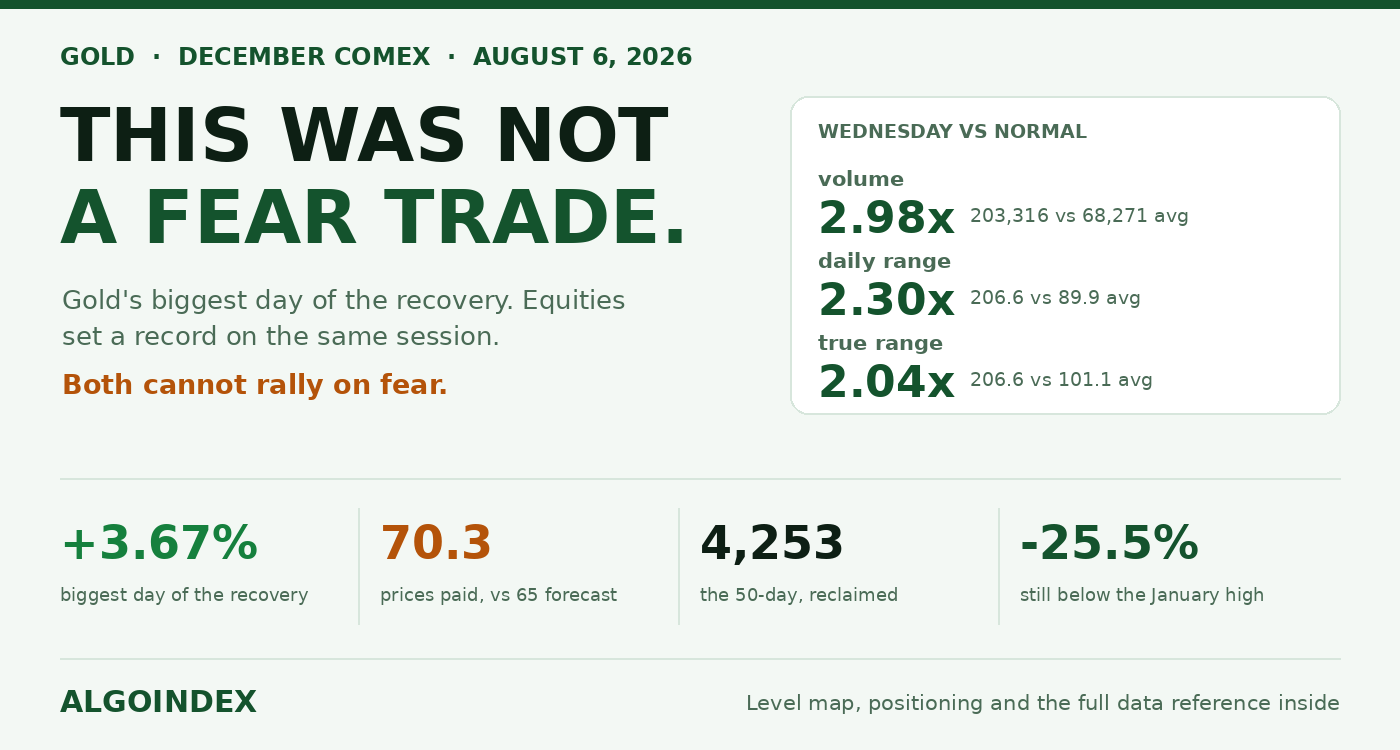
Gold added 152.6 points on Wednesday, closing 4,305.2 for its biggest single-day gain of this entire recovery. Equities set a record on the same session. Both of those cannot be a flight to safety.
Whatever got bought on Wednesday, it wasn't protection.
The session
The contract opened 4,133.8 and printed its low at 4,121.6 inside the first hour. After that it went one way for the rest of the day. High of 4,328.2, then 23 points given back into the settle.
Three measurements tell you this was real. The range covered 206.6 points, running 2.04 times a 14-day true range, and 2.30 times the daily range over twenty days. Settlement landed inside the top 88.9 per cent of that range. And 203,316 contracts traded where the twenty-day average is 68,271, nearly three times normal participation.
Expansion, conviction into the close, and volume behind it. Not a thin drift, not a stop run.
What actually caused it
Two American prints arriving together. July private payrolls came in at 44,000 where 65,000 was forecast and 98,000 had come the month before. Services printed a headline of 54.1 where 54.5 was expected, which looks unremarkable until you open it up.
Inside, the employment sub-index fell into contraction at 47.4, down from 51.2, where 51.2 had been forecast. The prices-paid sub-index went the other way, jumping from 67.7 up to 70.3, where forecasters had penciled in a decline to 65.0.
Weakening labour demand sitting beside input costs that are speeding up is the one pairing that strips out the room any central bank requires in order to keep tightening. Markets went and repriced the path of forward real yields, and this metal is the cleanest instrument for expressing that repricing.
Note what didn't do the work. A 0.17 per cent easing in the dollar index took it to 99.690. By itself that accounts for almost none of a 3.67 per cent move in the metal. This came from rates expectations.
Why the equity record matters
It is the detail that settles the interpretation.
A metal and a stock index cannot both rally on fear. When both climb on soft labour numbers and hot input prices, what is being bought is liquidity and currency debasement. Such a bid outlasts any geopolitical premium, since headlines resolving cannot deflate it.
Silver confirmed, settling up 3.39 per cent. Energy stayed out of it entirely, with September crude down 0.73 per cent at 75.22. If this had been a fear bid, crude wouldn't have been the one asset sitting still.
The 50-day, finally
Wednesday took back the 50-day, 4,253.1, and closed 52.1 points clear of it. Nowhere earlier in this run had it managed a close above that line.
It also sits 33.1 over the 5-day, and 174.9 over the 20-day. Every short-horizon measure has turned.
Now the other half. It still trades 218.9 points under a 100-day of 4,524.1, and the 200-day, 4,617.3, is 312.1 further off, and 402.2 beneath a year-to-date average of 4,707.4. It trades 25.51 per cent under the 29 January high of 5,781.8 and has still lost 7.77 per cent over three months.
So: an advance running hard against the larger downtrend it sits inside, and overhead a wall of supply, some 220 to 310 points away, that hasn't moved.
A trend forming, not maturing
The directional series is where the useful detail sits. Nine-day trend strength reads only 19.35, but the positive line reads 30.06 and the negative 11.92. That 2.5 to 1 spread on a low strength reading describes a trend that is forming rather than one running out of road.
Fourteen days confirms it, positive 24.56 over negative 16.23. Twenty days has its two lines nearly touching, 21.27 and 19.34, right on the crossover. Fifty days still favours sellers, negative 24.05 over positive 18.45.
The turn is confirmed out to twenty days and has not reached fifty. That shape belongs to a counter-trend advance in its early stage.
The composite agrees, and the path it took is the striking part. Eighty per cent bearish a month ago, 56 per cent bearish a week ago, 24 per cent bearish yesterday, 16 per cent bullish today. Four readings, monotonic repair. Underneath, short-term components come in 60 per cent bullish, medium-term 25, and long-term 67 per cent bearish, with the trend signal still on hold.
Stretched at one end, empty at the other
Raw stochastics are pinned over 92 per cent across the nine, fourteen and twenty-day windows. At fifty days the reading is 43.03; at a hundred, only 23.01.
Short end stretched, intermediate with room, long horizon deeply washed out. That configuration argues for continued upside across a multi-week window while carrying real retracement risk inside it, which is exactly why the trade below buys a dip rather than chasing a settle.
Relative strength says the same. At nine days it reads 67.20, first in the series to come near an upper band. Fourteen-day at 59.35, after jumping 10.40 points on the session, is constructive without being overbought, leaving something like 17 points of headroom under 70, a threshold that projects all the way up at 4,576.1.
Options were pricing less than the market was delivering
At nine days, historic volatility comes in at 22.35 per cent, 23.14 at fourteen, 24.22 at twenty and 26.06 at fifty. A declining series, which means realised volatility had been compressing right up into this move.
Front-month implied on the December contract sits at 21.36 per cent, beneath 14-day realised at 23.14. Options were underpricing movement before Wednesday, and that 206.6-point range on Wednesday will pull realised volatility sharply higher across the sessions ahead.
The practical consequence: any range projection built off trailing averages probably understates Thursday. Measured from the settle, one true range covers 4,204.1 up to 4,406.3. One daily range gives 4,215.8 through 4,394.6. Treat both as an outer envelope. Worth remembering, though, that the session following a two-range expansion usually consolidates within 60 to 80 per cent of a normal range instead of repeating it.
How to trade it
Buy a retracement into 4,255 to 4,280, ideally somewhere in 4,262 to 4,275, inside the 09:45 to 11:00 window. Inside those 25 points sit four independent references: a 50-day of 4,253.1, then 4,243.9 where the third computed resistance was reclaimed, 4,273.6 for two deviations, which sits inside the zone, and 4,238.1 for one deviation as the outer defence.
Stop 4,236, structurally under both the 50-day and the one-deviation band, which puts risk near 32 points from a 4,268 entry. Targets 4,328.2 for Wednesday's high, 4,347.7 at the 38.2 per cent retracement off the 13-week low, and 4,370.5 at the same retracement measured off the 52-week low, realistic only if a second supportive data pairing turns up. Roughly 1.9, 2.5 and 3.2 to one.
Half size. This is positioning into Friday's employment report, and the session just gone delivered a two-range expansion. Scale out some at the first objective, and carry no full size into Friday.
Two 15-minute closes in succession under 4,253.1 void the setup. Close under 4,203.9 and the constructive thesis is done, which reopens 4,178.2, after that 4,152.6, and the 4,121.6 base beneath.
A fade requires a clean structural rejection and nothing less: price above 4,328.2, then a 15-minute candle closing back beneath it, ideally with a claims print cutting against Wednesday's labour thesis. Stop sits above 4,356, objectives 4,273.6, 4,253.1, 4,238.1. Half size, and never on price alone, since this trades counter to a market where every short-horizon measure has only just turned bullish.
The one thing that cancels it
Claims under 197,000, and alongside them unit labour costs under 1.8 per cent, both at 08:30.
That combination removes the fundamental support underneath this trade regardless of what the chart is doing. Stand aside, even if price walks straight down into where you wanted to buy.
As for a confirmed Strait reopening, that is not an override, and the distinction is worth stating: Wednesday's advance was never built on a geopolitical premium, so removing one doesn't remove the reason it happened. Expect a knee-jerk decline on that headline and wait it out before entering.
The same data pair sent equities the other way, with a record handed back by the close: ES / S&P 500: a record at 10am, gone by the bell.The complete data picture
Every number behind Friday’s plan, charted first; the full numeric reference follows underneath.
Full numeric reference , every remaining figure from the review
Full data reference
Every figure behind the analysis above. December gold, session of Wednesday 5 August 2026, prepared for Thursday 6 August.
| Reference | Value |
|---|---|
| Contract | December 2026 COMEX gold |
| Settlement | 4,305.2, up 152.6 or 3.67 per cent |
| Tuesday's close | 4,152.6 |
| Open | 4,133.8 |
| Session low | 4,121.6, printed within the first hour |
| Session high | 4,328.2, also the one-month high |
| Close off the high | 23.0 points |
| Range | 206.6 points |
| Close position in range | upper 88.9 per cent |
| Candle body | 171.4 points, engulfing the prior four sessions of range |
| Range against 14-day true range | 2.04 times 101.1 |
| Range against 20-day daily range | 2.30 times 89.9 |
| Volume | 203,316 against a 20-day average of 68,271, 2.98 times normal |
| Reference | Value |
|---|---|
| Session and one-month high | 4,328.2 |
| 38.2 per cent off the 13-week low | 4,347.7 |
| 38.2 per cent off the 52-week low | 4,370.5 |
| Upper edge of the one-range band | 4,406 |
| 40-day average stall | 4,427.3 |
| 50 per cent of the 13-week span | 4,450.3 |
| 100-day average | 4,524.1 |
| 38.2 per cent off the 13-week high | 4,552.9 |
| Where 14-day strength reaches 70 | 4,576.1 |
| 200-day average | 4,617.3 |
| 50 per cent of the 52-week span | 4,640.0 |
| 13-week high | 4,885.0 |
| Reference | Value |
|---|---|
| 3 deviations, reclaimed on the settle | 4,300.8 |
| 2 deviations | 4,273.6 |
| 50-day average | 4,253.1, the most important level into Thursday |
| 3rd computed resistance, reclaimed | 4,243.9 |
| 1 deviation | 4,238.1 |
| 38.2 per cent off the 4-week high | 4,210.1 |
| 2nd computed resistance | 4,203.9 |
| 80-level stochastic projection | 4,187.8 |
| Tuesday's close | 4,152.6 |
| Daily pivot | 4,138.2 |
| 20-day average | 4,130.3 |
| Session low, the base | 4,121.6 |
| 1st computed support | 4,112.5 |
| 2nd computed support | 4,072.5 |
| 3rd computed support | 4,046.8 |
| One-month low | 4,019.0 |
| 13-week low | 4,015.6 |
| Reference | Value |
|---|---|
| Above the 50-day | 52.1 points |
| Above the 5-day | 33.1 points |
| Above the 20-day | 174.9 points |
| Below the 100-day | 218.9 points, at 4,524.1 |
| Below the 200-day | 312.1 points, at 4,617.3 |
| Below the year-to-date average | 402.2 points, at 4,707.4 |
| Below the 29 January high | 25.51 per cent, from 5,781.8 |
| Three-month change | down 7.77 per cent |
| Reference | Value |
|---|---|
| Relative strength 9-day | 67.20 |
| Relative strength 14-day | 59.35, up 10.40 on the session |
| Relative strength 20-day | 54.08 |
| Relative strength 50-day | 47.99 |
| Relative strength 100-day | 49.11 |
| Headroom before 70 on the 14-day | roughly 17 points, projecting at 4,576.1 |
| Raw stochastic 9, 14 and 20-day | pinned above 92 per cent |
| Raw stochastic 50-day | 43.03 per cent |
| Raw stochastic 100-day | 23.01 per cent |
| Reference | Value |
|---|---|
| 9-day | index 19.35, positive 30.06, negative 11.92 |
| 14-day | index 26.12, positive 24.56, negative 16.23 |
| 20-day | index 28.47, positive 21.27, negative 19.34 |
| 50-day | negative 24.05 above positive 18.45 |
| Composite today | 16 per cent bullish, strength at minimum, direction strengthening |
| Composite yesterday | 24 per cent bearish |
| Composite one week ago | 56 per cent bearish |
| Composite one month ago | 80 per cent bearish |
| Short-term group | 60 per cent bullish |
| Medium-term group | 25 per cent bullish |
| Long-term group | 67 per cent bearish |
| Trend signal | hold |
| Bullish components | the 20-day and 50-day price comparisons and the volatility-band study |
| Bearish components | the 20 to 100 day and 50 to 100 day crossovers and the 100-day price comparison |
| Reference | Value |
|---|---|
| 9-day true range | 100.9, 2.30 per cent |
| 14-day true range | 101.1, 2.30 per cent |
| 20-day true range | 103.6, 2.40 per cent |
| 50-day true range | 114.6, 2.70 per cent |
| 9-day average daily range | 93.8 |
| 14-day average daily range | 89.4 |
| 20-day average daily range | 89.9 |
| 50-day average daily range | 105.3 |
| Historic volatility 9-day | 22.35 per cent |
| Historic volatility 14-day | 23.14 per cent |
| Historic volatility 20-day | 24.22 per cent |
| Historic volatility 50-day | 26.06 per cent |
| Front-month implied volatility | 21.36 per cent, beneath 14-day realised |
| One-range band | 4,204.1 to 4,406.3 |
| One-daily-range band | 4,215.8 to 4,394.6 |
| Post-expansion tendency | consolidation inside roughly 60 to 80 per cent of normal range |
| Reference | Value |
|---|---|
| Private payrolls | 44,000 against 65,000 forecast, 98,000 prior |
| Services headline | 54.1 against 54.5 expected |
| Services employment sub-index | 47.4 from 51.2, against a 51.2 forecast |
| Services prices paid | 70.3 from 67.7, against a forecast decline to 65.0 |
| Dollar index | 99.690, down 0.17 per cent |
| September silver | up 3.39 per cent |
| September crude | 75.22, down 0.73 per cent |
| Equities | a record high on the same session |
| Reference | Value |
|---|---|
| Entry zone | 4,255 to 4,280, preferably 4,262 to 4,275 in the 09:45 to 11:00 window |
| References in the band | the 50-day at 4,253.1, the reclaimed 4,243.9, the one-deviation band at 4,238.1, the two-deviation band at 4,273.6 |
| Stop | 4,236 |
| Risk from a 4,268 entry | roughly 32 points |
| Target 1 | 4,328.2, about 60 points, 1 to 1.9 |
| Target 2 | 4,347.7, about 80 points, 1 to 2.5 |
| Target 3 | 4,370.5, about 102 points, 1 to 3.2 |
| Position size | half |
| Invalidation | two consecutive 15-minute closes beneath 4,253.1 |
| Thesis end | a close beneath 4,203.9, reopening 4,178.2, then 4,152.6, then 4,121.6 |
| Macro override | claims beneath 197,000 paired with unit labour costs beneath 1.8 per cent |
| Reference | Value |
|---|---|
| Trigger | trade above 4,328.2 then a 15-minute close back beneath it |
| Zone | 4,328.2 to 4,347.7 |
| Stop | above 4,356 |
| Target 1 | 4,273.6 |
| Target 2 | 4,253.1 |
| Target 3 | 4,238.1 |
| Size | half, and only on a clean structural rejection |
| Time | Event |
|---|---|
| 02:00 | German industrial orders |
| 04:30 | UK construction survey |
| 05:00 | Eurozone retail sales |
| 08:30 | Initial claims, 205,000 against 197,000 |
| 08:30 | Unit labour costs preliminary, 2.1 per cent against 1.8 |
| 17:30 | A Federal Reserve speaker, after the close |
| Friday 08:30 | Employment report |
| Reference | Value |
|---|---|
| Proxy close | 389.62 against a 374.12 prior close, up 4.14 per cent |
| Proxy to futures ratio | roughly 11.05 to 1 |
| Call-side gamma | negative 160.79 million |
| Put-side gamma | positive 105.42 million |
| Net short-gamma condition | roughly 55.4 million, concentrated on the call side |
| Upper volatility inflection | 402 in the proxy, roughly 4,442 in December |
| Lower volatility inflection | 336 in the proxy, roughly 3,713 |
| Convergent supply band | 4,427 to 4,450, where three methods meet |
| Call volume | 118,920 |
| Put volume | 73,930 |
| Call to put ratio | 1.61 to 1 |
| Put to call open interest | 0.51 |
| Gamma and delta concentration | 18 September expiry |
| One-month implied volatility | 21.54 per cent |
| One-month realised volatility | 20.70 per cent |
| Implied volatility rank | 26.75 per cent |
| Forward-looking volatility rank | 12.11 per cent |
| Skew rank | 50.40 per cent, balanced demand |
| Implied single-session move | 5.09 in the proxy, roughly 56 points in December |
| Against the 14-day daily range | well beneath 89.4, and far beneath Wednesday's 206.6 |
| Reference | Value |
|---|---|
| Managed money long | 135,093 |
| Managed money short | 15,298 |
| Managed money net long | 119,795, reduced by 5,036 on the week |
| Non-commercial long | 219,622 |
| Non-commercial short | 37,552 |
| Non-commercial net long | 182,070 |
| Commercial long | 75,460 |
| Commercial short | 287,769 |
| Commercial net short | 212,309 |
| Swap dealer long | 23,661 |
| Swap dealer short | 215,421 |
| Producer short increase | up 1,034 contracts |
| Open interest | 284,690 |
| Data age | six sessions stale, predating Wednesday entirely |
| Reference | Value |
|---|---|
| Overnight and intraday markers | 4,290, 4,300, 4,320, 4,345, 4,350 |
| Retracement and pivot markers | 4,232, 4,234, 4,259, 4,270 |
| Lower structure markers | 4,071, 4,098, 4,114, 4,135, 4,163.6, 4,165.3, 4,173.6, 4,175.1, 4,182 |
| Upper structure markers | 4,392, 4,427, 4,442, 4,450, 4,670.1 |
| Prior swing reference | 3,498.2 |
| Currency reference | dollar-yen near 157.738 and 158, with 160 in view |
| Silver settlement | 62.288 |
| Related fund readings | 579.8, 286.2, 289.6, 271.0, 141.6, 1,476.6 |
| Percentage markers | 93.18, 93.2, 94.0, 94.2, 89, 79.45, 63.46, 65.6, 38.4, 26, 28, 19, 18, 10, 7 |
| Payroll context | Friday forecast 80,000 against 57,000 prior; private 80,000 against 49,000; bank preview 95,000 |
| Energy detail | crude inventories build of 2.479 million; 807 and 402 as related readings |
| Capture window | between 20.7 and 21.54 per cent volatility readings, session data taken after the close |



