
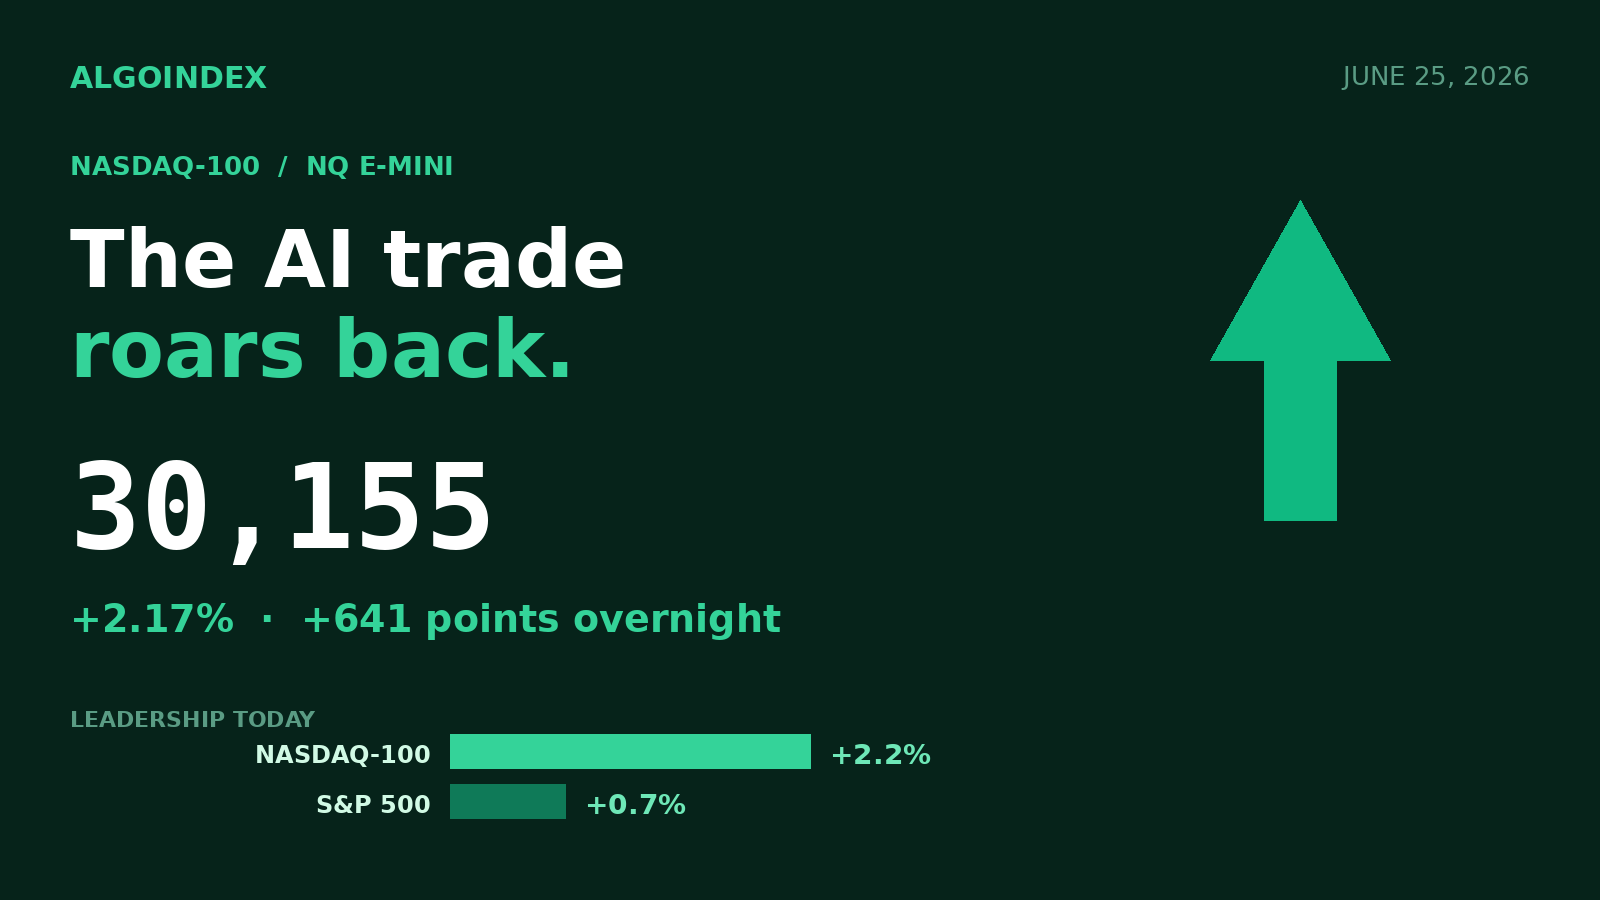
Two days ago traders were asking whether the artificial-intelligence build-out had been oversold. This morning a single memory-chip earnings report has answered them: the Nasdaq-100 has gapped 2.17 percent higher overnight, reclaimed every short-term average it had lost during the week's pullback, and is leading the broad market by a margin not seen in weeks.
Front-month NQU26 trades near 30,155, up roughly 641 points against the prior settlement of 29,514.25, after opening the Globex session at 30,089.75 and ranging between an overnight low of 29,924.50 and a high of 30,219.00. The cash Nasdaq-100 is up about 2.2 percent while the S&P 500 is up only about 0.7 percent, and the headline volatility index has eased toward 18. This is a concentrated, technology-led advance, not a broad risk-on melt-up. The driver is unambiguous: a leading memory-semiconductor company reported a sales outlook that comfortably beat expectations, with the stock indicated up about 17 percent in pre-market, and a second large chip name reinforced the message with guidance pointing to durable AI data-center demand.
The contrast tells the story. While the Nasdaq-100 leads, the broad market trails, a familiar pattern when a single high-beta growth catalyst leads and the rest of the market waits. The chip name reported roughly 35.6 billion dollars in revenue, its market value has surpassed 1 trillion dollars after a year-to-date gain exceeding 200 percent, and because the index is heavily weighted toward semiconductors and the mega-cap AI complex, this single event is driving the entire index higher.
The structural picture remains firmly bullish, but today is gated by one event. At 8:30 ET the market receives the core PCE deflator, the Federal Reserve's preferred inflation gauge, with consensus at plus 0.3 percent month over month and some desks tilted to a softer plus 0.2 percent. A cooler number would extend the AI-led bounce toward the recent highs; a hotter number would reward the high-duration Nasdaq least and could quickly fade the gap. Because the data lands before the cash open, the opening range will already reflect the reaction, so entries are deferred until that range resolves after 9:45 ET.
Above every average, with headroom
Price sits above every major moving average. The 5-day is at 30,143.10, the 20-day at 30,187.45, which price is testing from below as the immediate pivot, the 50-day at 29,191.02 (price 14.98 percent above), the 100-day at 27,148.91, the 200-day at 26,543.29 (price 21.56 percent above), and the year-to-date mean at 26,983.76. Momentum is neutral-to-bullish with room to run: the 14-day relative strength is 53.12 and the 9-day 51.78, the mid-50s confirming the index is not overbought despite the gap. The directional system reads a weak, recently corrective trend the gap is working to flip, with the 9-day directional index at 23.27 and the 14-day at 21.22, the negative line still slightly above the positive. The multi-indicator composite reads 32 percent buy overall, muted because the short-term window was dragged down by the pullback while the medium and longer windows stay clearly bullish.
The dealer-positioning backdrop has shifted. Options data show dealers near the inflection between negative and positive gamma; with price now above the cash-index volatility-inflection near 29,460 and the proxy inflection near 719, the environment tilts toward a more stabilizing, positive-gamma condition that dampens swings and supports pullbacks. The trade-off is overhead supply: the primary call-resistance concentration maps to the futures-equivalent near 30,635, where dealer hedging can cap rallies. The proxy carries a 1-month implied volatility near 28.8 percent against realized near 32.1 percent, with an implied-volatility rank around 95 percent and a put-to-call open-interest ratio near 1.43, hedges still in place beneath the rally.
Buy the pullback that holds the shelf
First support is the band where price reclaimed this morning: the 18-day average near 30,135, the 38.2 percent retracement at 30,110, and the first computed pivot at 30,026 that now acts as support. Beneath lies the overnight low at 29,924.50, the 50 percent retracement at 29,804, the relative-strength-50 reference at 29,779, and the central pivot at 29,645.58, then the gap-origin settlement at 29,514.25. Overhead, the overnight high at 30,219 leads to the 30,294 two-standard-deviation band, the 30,538 second pivot, the futures-equivalent call-resistance near 30,635, and the 30,919 third pivot beneath the 31,100 ceiling.
The conditional path is a hot-PCE rejection short: if core inflation surprises high and the index opens and sustains below 29,924, short a failed retest of 29,924 to 29,980 toward the pivot at 29,645 and the settlement at 29,514, stop above 30,070. The base case is a firm, range-upper session that holds the reclaimed 30,000-area shelf, digests the print, and works toward the 30,538 to 30,635 band, with the 31,100 highs a stretch reserved for a clearly soft print. The macro override is explicit: a core PCE of plus 0.4 percent or higher voids the long bias.
The complete data picture
For readers who want the full structure rather than the summary, here is the entire computed level map and the complete set of momentum, volatility, and positioning readings behind today's view.
| EXPECTED RANGE TODAY | |
| Low | approximately 29,640 (pivot zone, on a hot PCE) |
| Most-likely mid | 30,100 to 30,300 |
| High | 30,650 to 30,900 on a soft PCE, into call-resistance |
Path A bullish continuation 50%, Path B chop beneath resistance 30%, Path C hot-PCE fade 20%. A one-ATR band around price spans roughly 29,405 to 30,905.
Full session calendar. 8:30 AM Core PCE Price Index MoM/YoY (consensus +0.3% MoM, some desks +0.2%), plus PCE, personal income, consumer spending, real personal consumption, final GDP and GDP price index, durable and core durable goods, and initial and continued jobless claims; 10:00 AM University of Michigan final sentiment and 1-year and 5-year inflation expectations; Federal Reserve Chair congressional testimony; 1:00 PM US 7-year note auction; 3:40 PM regional Federal Reserve president; a tentative energy supply outlook.
AlgoIndex publishes computed levels and dealer-positioning context every session. Review the performance statement, learn the method in the trading signals guide, compare strategies on the pricing page, and track every entry with the free AI Trading Journal.
Foundational guides
New to Nasdaq 100 futures? Start with What Are NQ Futures, the ES, NQ, MES & MNQ point value and contract specs, QQQ gamma exposure (GEX), and market internals: TICK, ADD, VOLD and VIX.



