Friday's outlook set a short from 28,600 to 28,640, stopped at 28,760, with targets at 28,480, 28,340 and an extended 28,200. The band traded within an hour of the reopen. The 6:30 PM ET bar on Thursday evening opened at 28,493.00, beneath the band, rose to the 28,607.75 session high, 7.75 points into the bottom of the band and 32.25 beneath its top, and closed at 28,544.00, back beneath the band; that bar activated the card. No 30-minute bar closed above 28,640, the highest close of the session being 28,570.75 in the 8:30 PM ET bar, so the acceptance rule never triggered, and the 28,760 stop, 152.25 above the session high, never traded.
The first target traded in the 7:30 PM ET bar, which reached 28,453.00. The second traded in the 11:00 PM ET bar, which reached 28,315.25, and the extended 28,200 traded in the 9:30 AM ET bar, which fell to 28,065.50. The activation bar's own 28,492.50 low is not counted, because that bar opened beneath the band, and after activation no bar traded above 28,593.00, the 7:00 PM ET bar's high, 7.00 beneath the band. Result: all three targets reached. Measured from the bottom of the band, the only part of the band that traded, those are hypothetical price moves of 120.00, 260.00 and 400.00 points, not a verified trade or fill; the 28,640 top was never reached, and the worst point against the bottom of the band was the 7.75 points inside the activation bar.
The cash open did the work. The 9:30 AM ET and 10:00 AM ET bars fell 303.50 and 246.25 points, the session low of 27,695.25 printed in the 11:00 AM ET bar, 695.75 beneath the 9:30 AM ET bar's open, and the contract recovered through the afternoon.
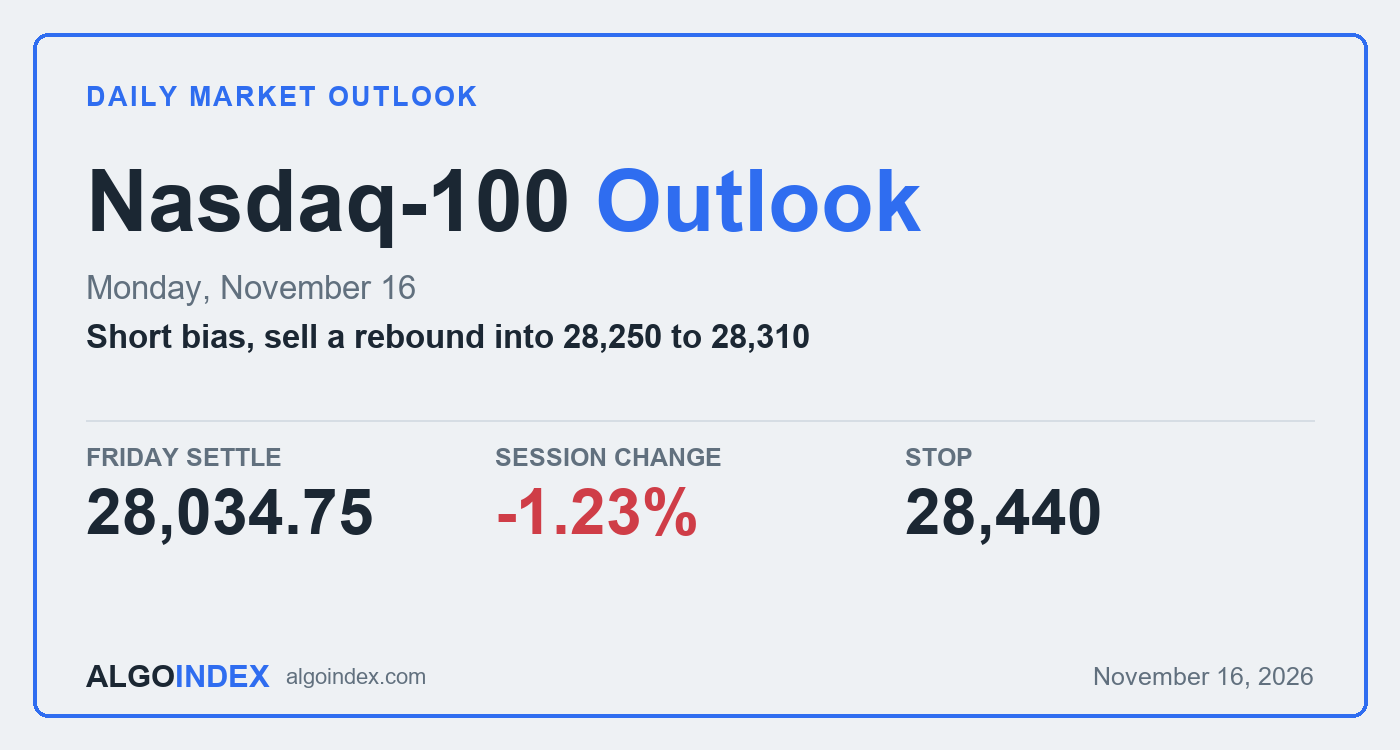
December Nasdaq-100 futures settled at 28,034.75, down 349.75 or 1.23 percent, after a 912.50 point range between 27,695.25 and 28,607.75, the widest since the 1,378.00 point range of 11/09/26. The settle finished 339.50 above the low and 573.00 beneath the high, beneath the 5-day average for the first time in five sessions and 495.00 points beneath the 200-day average at 28,529.75. Globex reopens at 6:00 PM ET on Sunday, and the last Friday print was the 27,927.25 close of the 4:30 PM ET bar, 107.50 beneath the settle.
- Settle 28,034.75: above the 9-day average, beneath the 5-day, 20-day, 50-day, 100-day and 200-day, the last by 495.00 points.
- Monday's setup: short 28,250 to 28,310, stop 28,440, targets 28,120, 27,960 and an extended 27,800.
- Thesis negated on a settle above two standard deviation resistance at 28,415.66; acceptance above the band means two consecutive 30-minute closes above 28,310.
- Dealer map: the 27,943.74 cash close sits 273.26 points beneath the NDX 28,217 modeled gamma-flip level (NQ 28,308.00) and 56.26 beneath the NDX 28,000 largest gamma concentration (NQ 28,091.00).
- Globex reopens at 6:00 PM ET on Sunday; Monday carries listed remarks from four Fed officials, including Fed Chair Warsh at 12:00 PM ET, and the Nvidia results call is scheduled for 5:00 PM ET on Tuesday.
How Friday traded: a chip selloff erased the overnight rebound
The night held up. The contract reopened at 28,399.25 at 6:00 PM ET on Thursday, 14.75 above Thursday's settle. Until 3:00 AM ET the bars held between 28,257.25, in the 1:00 AM ET bar, and 28,607.75, in the 6:30 PM ET bar, which carried the session high, and closed the window at 28,336.00 in the 2:30 AM ET bar.
The producer price report changed little. From 3:00 AM ET to the 9:30 AM ET cash open the contract traded between 28,243.25, in the 3:30 AM ET bar, and 28,583.75, in the 8:30 AM ET bar, and closed the window at 28,390.75. The 8:30 AM ET bar, which spans the release, traded across 203.75 points and closed 11.25 lower at 28,416.75. The report showed a monthly reading of 0.3 percent against a 0.4 percent forecast and an annual reading of 6.5 percent against 6.6 percent, per the news-feed calendar.
The cash session reversed the night. The 9:30 AM ET bar fell 303.50 to 28,087.50 across a 333.50 point span, the largest decline of any bar, and the 10:00 AM ET bar fell a further 246.25 to 27,841.25 across a 376.25 point span, the widest of the session. The 27,695.25 low came in the 11:00 AM ET bar. The 12:00 PM ET bar rose 96.75 to 27,924.50, the largest gain of any bar, and the 3:30 PM ET bar reached 28,111.75 before closing at 28,038.00 ahead of the 4:00 PM ET settle.
The decline resumed after the settle. The 4:00 PM ET bar fell 174.50 to 27,863.25 across a 236.75 point span, and the 4:30 PM ET bar traded down to 27,766.50 before closing at 27,927.25. From 4:10 PM ET the news feed carried reports of a departure ground stop at US airports, described as nationwide from 4:16 PM ET and attributed to an air traffic control communications issue, and at 4:49 PM ET a press report that it did not appear to be a cyber attack. Those reports and the post-settle decline coincided; the bars do not separate their effect from other flows.
The structure weakened. Friday printed a lower high, 44.50 beneath Thursday's 28,652.25, and a lower low, 318.50 beneath Thursday's 28,013.75, ending four consecutive higher lows since the 26,366.50 low of 11/06/26. It was the second consecutive lower settle, the lowest since the 27,835.25 settle of 11/10/26, and the 1.23 percent decline was the largest since the 6.35 percent decline of 11/05/26. Over five sessions the contract is still up 949.50, or 3.51 percent, from the 27,085.25 settle of 11/06/26. Volume rose to 803,962 December contracts from 718,471 on Thursday, so the down day came on higher volume.
Chipmakers and higher yields drive the decline
The provider's market commentary attributed the decline to another selloff in chipmakers and AI-infrastructure stocks and to higher yields after hawkish Fed remarks, which is attributed commentary. The semiconductor index closed at 10,146.32, down 360.35 or 3.43 percent, after a 9,828.98 low, while the Nasdaq-100 cash index fell 345.45, or 1.22 percent, to 27,943.74, the S&P 500 cash index fell 0.40 percent and the Dow Jones industrial average rose 0.10 percent. In this review's interpretation that split describes sector rotation rather than broad liquidation.
Nvidia stays at the center. The news feed carried at 4:03 PM ET a report that Nvidia's weekly decline erased more than 573 billion dollars in value, at 2:10 PM ET a report that the company's board has not formally engaged chief executive candidates and is selecting a search firm, and at 3:53 PM ET a post by Tesla's chief executive supporting a petition to reinstate Nvidia's former chief executive. The feed also carried Microsoft statements from 12:59 PM ET that a service outage was a technical issue not related to cyber activity, with recovery still in progress at 3:04 PM ET. The Nvidia results conference call is scheduled for 5:00 PM ET on Tuesday, November 17, 2026, with results expected around 4:20 PM ET.
Rates are the second weight. The ten-year yield index closed at 5.15 after a 5.17 high, up from 5.10, and the provider's commentary described hawkish Fed remarks lifting yields to a 4-week high, which is attributed commentary. During the session the news feed carried headlines, unconfirmed beyond the feed, that Chicago Fed President Goolsbee, Boston Fed President Collins and San Francisco Fed President Daly favour further rate increases, and at 4:02 PM ET items from the Fed's financial stability report, including that debt issuance tied to advanced computing rose above 680 billion dollars by October 2026.
The weekend carries headline risk. At 4:12 PM ET the news feed carried a press report that the President plans to meet the Russian and Chinese presidents next Thursday in Shenzhen. Late in the session the feed also carried Gulf supply reports: an attack claim on the Saudi east-west oil line at 3:32 PM ET and an Iranian state media report at 3:47 PM ET of two tankers striking naval mines in the Strait of Hormuz. In this review's interpretation these are weekend gap risks for the index through crude and yields rather than direct drivers of Friday's decline. The volatility index closed at 19.30, up 0.60, after a 20.92 high, and the dollar index rose 0.23 percent to 103.41.
The trade map for Monday
The setup sells a rebound into 28,250 to 28,310. The band holds the 28,272.25 stochastic projection, one standard deviation resistance at 28,304.09, the 28,305.75 stall of the 9-day average and the 28,308.00 futures conversion of the modeled gamma-flip level. The stop at 28,440 sits above two standard deviation resistance at 28,415.66 and the 28,391.00 conversion of the modeled volatility threshold, and 89.75 beneath the 200-day average at 28,529.75.
The first target, 28,120, sits above the Pivot Point at 28,112.58. The second, 27,960, sits above the 9-day average at 27,939.00. The extended 27,800 sits above the 27,766.50 post-settle low and one standard deviation support at 27,765.41. Measured from the 28,280 midpoint of the band, risk to the stop is 160 points and reward runs 160, 320 and 480 points, or 1:1, 1:2 and 1:3.
The dealer map caps the band. At the measured 91.01 point basis the NDX 28,217 modeled gamma-flip level converts to about NQ 28,308.00, the NDX 28,300 modeled volatility threshold to about NQ 28,391.00, the NDX 28,000 largest gamma concentration to about NQ 28,091.00 and the NDX 27,000 put side support base to about NQ 27,091.00. In this review's interpretation a cash close beneath both modeled levels and beneath the 28,000 concentration, with negative fund gamma on both sides, describes an environment where hedging may add to moves rather than damp them; that is an inference from the dataset, not a measured flow.
A settle above two standard deviation resistance at 28,415.66 negates the thesis and would bring the 200-day average at 28,529.75 and Pivot R1 at 28,529.92 into play. Before that, two consecutive 30-minute closes above 28,310 remove the edge. A recovery in chipmakers ahead of the Nvidia results, a decline in yields or softer remarks from the Fed Chair could carry the contract through the stop in one move; the 14-day average true range of 813.52 points is more than five times the 160 point stop distance. Globex does not reopen until 6:00 PM ET on Sunday, and in this review's judgment a gap beneath Friday's 27,695.25 low or above the 28,148.50 5-day average is possible at the reopen.
Our base case holds the contract beneath the 28,148.50 5-day average through the Sunday evening and London sessions, with a rebound into the band after the cash open likely to fail beneath the 28,391.00 conversion of the modeled volatility threshold, followed by a retest of the 27,766.50 post-settle low and Friday's 27,695.25 low into the afternoon. The mid-range scenario runs 27,550 to 28,400, the low-range one 27,700 to 28,250 and the high-range one 27,250 to 28,700. A further rise in yields could instead carry the contract through Friday's low toward Pivot S1 at 27,617.42 and Tuesday's 27,516.00 low without the rebound the setup needs, while the settle above the 9-day average and the five-session gain argue that dips may be bought ahead of the Nvidia results. The setup is an analyst judgment, not a measured edge.
The complete data picture
Every figure behind Monday's plan, charted first; the full numeric reference follows underneath.
- Nasdaq-100 cash index 27,943.74 down 1.22%
- Semiconductor index 10,146.32 down 3.43%
- S&P 500 cash index -0.40% change only
- Dow +0.10% change only
- Ten-year yield index 5.15, high 5.17
- Volatility index 19.30 up 0.60
- Dollar index 103.41 up 0.23%
- Gold, December +0.03% change only
- WTI, December -0.20% change only
- Nasdaq-100 tracking fund 677 down 1.62%
- Tue, Nov 17, 8:30 AM ET US retail sales report scheduled
- Tue, Nov 17, 5:00 PM ET Nvidia results conference call scheduled, results expected around 4:20 PM ET
- Wed, Nov 18, 2:00 PM ET FOMC minutes scheduled
Full numeric reference, every figure from the review
Executive Summary
The December Nasdaq-100 contract settled at 28,034.75 on Friday, down 349.75 or 1.23 percent from Thursday's settle of 28,384.50, after trading between 28,607.75 and 27,695.25, a 912.50 point daily range. The settle finished 339.50 above the low and 573.00 beneath the high. Friday printed a lower high, 44.50 beneath Thursday's 28,652.25, and a lower low, 318.50 beneath Thursday's 28,013.75, and the 912.50 point range was the widest since the 1,378.00 point range of 11/09/26, against a published 14-day average daily range of 914.98 points.
Friday was the second consecutive lower settle, the settle is the lowest since the 27,835.25 settle of 11/10/26 and the 1.23 percent decline is the largest since the 6.35 percent decline of 11/05/26. Over five sessions the contract is still up 949.50 from the 27,085.25 settle of 11/06/26, a gain of 3.51 percent. The settle sits above the 9-day settlement average and beneath the 5-day, 20-day, 50-day, 100-day and 200-day.
The Nasdaq-100 cash index closed at 27,943.74, down 345.45 or 1.22 percent, and the semiconductor index fell 3.43 percent. The session high of 28,607.75 printed in the 6:30 PM ET bar on Thursday evening, after the reopen, and the contract held above 28,243.25 into the 9:30 AM ET cash open. The 9:30 AM ET bar fell 303.50 and the 10:00 AM ET bar fell a further 246.25, and the session low of 27,695.25 printed in the 11:00 AM ET bar, 695.75 beneath the 9:30 AM ET bar's open. The contract recovered through the afternoon to settle at 28,034.75 at 4:00 PM ET. The provider's market commentary attributed the decline to another selloff in chipmakers and AI-infrastructure stocks and to higher yields after hawkish Fed remarks, which is attributed commentary.
After the settlement the news feed carried reports from 4:10 PM ET of a departure ground stop at US airports, described as nationwide from 4:16 PM ET and attributed to an air traffic control communications issue, and at 4:49 PM ET a press report that it did not appear to be a cyber attack. The 4:00 PM ET bar fell 174.50 to 27,863.25 and the 4:30 PM ET bar reached 27,766.50 before closing at 27,927.25, 107.50 beneath the settle; those reports and the post-settle decline coincided, and the series does not separate their effect from other flows.
The composite multi-indicator read published on Friday evening is "64% SELL" with strength "Weak" and direction "Strengthening", against "40% SELL" a session earlier. The primary setup below is a short from the 28,250 to 28,310 band, around one standard deviation resistance at 28,304.09 and beneath this review's 28,391.00 conversion of the modeled volatility threshold, stopped at 28,440, with objectives at 28,120, 27,960 and an extended 27,800. Globex reopens at 6:00 PM ET on Sunday, and in this review's judgment the chipmaker selloff into the Nvidia results conference call scheduled for 5:00 PM ET on Tuesday, November 17, 2026, per the verified forward calendar, is the first-order input for the contract.
Price Action & Technical Structure
2.1 Intraday and Session Review
The Friday session opened at 28,399.25 at the Thursday 6:00 PM ET reopen, 14.75 above Thursday's settle. Between the 6:00 PM ET reopen and 3:00 AM ET the 30-minute series on CME_MINI:NQ1! held between 28,257.25, in the 1:00 AM ET bar, and 28,607.75, in the 6:30 PM ET bar, which carried the session high. The window closed at 28,336.00 in the 2:30 AM ET bar.
From 3:00 AM ET to the 9:30 AM ET cash open the contract traded between 28,243.25, in the 3:30 AM ET bar, and 28,583.75, in the 8:30 AM ET bar, and closed the window at 28,390.75. The 8:30 AM ET bar, which spans the US producer price index released at 8:30 AM ET on Friday, November 13, 2026, per the verified forward calendar, traded across 203.75 points and closed 11.25 lower at 28,416.75.
Across the cash hours, from 9:30 AM ET to 4:00 PM ET, the bars held between 27,695.25, in the 11:00 AM ET bar, which carried the session low, and 28,399.00, in the 9:30 AM ET bar. The 9:30 AM ET bar fell 303.50 to 28,087.50, the largest decline of any bar in the session, across a 333.50 point span, and the 10:00 AM ET bar fell 246.25 to 27,841.25 across a 376.25 point span, the widest of the session. The 12:00 PM ET bar rose 96.75 to 27,924.50, the largest gain of any bar in the session, the 3:30 PM ET bar reached 28,111.75 and closed at 28,038.00, and the settle was fixed at 4:00 PM ET at 28,034.75.
After the settle, the 4:00 PM ET bar fell 174.50 to 27,863.25 across a 236.75 point span, and the 4:30 PM ET bar traded down to 27,766.50 before closing at 27,927.25. Because Friday's session is not followed by a Globex reopen until Sunday, the provider's overview, read at 6:28 PM ET, carries Friday's own open of 28,399.25, high of 28,607.75 and low of 27,695.25, with a previous close field of 28,384.50.
The published pivot ladder was checked against those values with the outer pairs. Pivot R3 at 29,442.42 minus Pivot S3 at 26,704.92, divided by three, returns 912.50, and Pivot R2 at 29,025.08 minus Pivot S2 at 27,200.08, divided by two, returns the same 912.50. The published Pivot Point is 28,112.58. Three times that value, less the 28,034.75 settle, gives a high plus low sum of 56,302.99, within the rounding of the published value, which with the 912.50 range solves to a high of 28,607.745 and a low of 27,695.245, or 28,607.75 and 27,695.25 at the contract's tick. That pair, with the 28,034.75 settle, reproduces all seven published rungs. These are the completed-session inputs behind the published pivot ladder rather than an independently read bar, and the overview's day high and low, the provider's settlement row, the chart's completed daily bar and the 30-minute series carry the same 28,607.75 high and 27,695.25 low.
2.2 Daily Structure
Friday printed a lower high and a lower low against Thursday and settled 349.75 lower, in the lower half of the range. Settlements over the last six sessions read 27,085.25, 28,014.50, 27,835.25, 28,473.25, 28,384.50 and 28,034.75, so the contract has given back 438.50 from Wednesday's 28,473.25 settle over two sessions and holds 1,668.25 above the 26,366.50 one-month low of 11/06/26.
The provider publishes 26,366.50 as the one-month and 13-week low, 30,891.50 as the one-month high and 31,616.50 as the 52-week and 13-week high. The settle sits 337.25 beneath the 28,372.00 level published as the 38.2 percent retracement from the 13-week low and 60.30 beneath the 28,095.05 level published as the 38.2 percent retracement from the 4-week low.
In this review's interpretation a lower high and a lower low after Thursday's inside day, with the settle back beneath the 5-day average, describes a failed rebound rather than a trend change, with the settle still beneath the 20-day, 50-day, 100-day and 200-day averages.
2.3 4-Hour and Swing Structure
The 912.50 point range followed ranges of 593.00 on Tuesday, 849.25 on Wednesday and 638.50 on Thursday. In the 30-minute series two bars in the cash session spanned more than 300 points, at 9:30 AM ET and 10:00 AM ET, and those two bars carried the two largest declines of the session.
The swing sequence since the 26,366.50 low of 11/06/26 shows lows of 26,751.25 on Monday, 27,516.00 on Tuesday, 27,847.75 on Wednesday and 28,013.75 on Thursday, four consecutive higher lows that Friday's 27,695.25 low ended. The highs read 28,129.25 on Monday, 28,109.00 on Tuesday, 28,697.00 on Wednesday, 28,652.25 on Thursday and 28,607.75 on Friday, two consecutive lower highs.
Daily ranges over the last nine sessions, from 11/03/26, ran 411.25, 1,353.25, 2,098.50, 1,058.50, 1,378.00, 593.00, 849.25, 638.50 and 912.50. The published grid places the 9-day average stall at 28,305.75, the 18-day average crossing level at 28,539.06, the 3-10 day crossover stall at 27,806.75 and the 3-10-16 day MACD stall at 27,321.71.
2.4 Moving Averages
The averages cited here were computed for this analysis from the provider's daily settlement series for the December contract, which holds 260 completed sessions from 11/04/25 through Friday; Friday's row is a completed session because Globex does not reopen until Sunday, and each average is carried at full precision and rounded once to the contract's 0.25 tick. The 5-day average stands at 28,148.50, the 9-day at 27,939.00, the 20-day at 28,728.50, the 50-day at 29,727.00, the 100-day at 29,698.25 and the 200-day at 28,529.75. The series carries zero-volume rows in the early months of the contract's life, and those settlements are included in the 200-day window as published.
The 28,034.75 settle sits 113.75 beneath the 5-day average, 95.75 above the 9-day, 693.75 beneath the 20-day, 1,692.25 beneath the 50-day, 1,663.50 beneath the 100-day and 495.00 beneath the 200-day. It is the first settle beneath the 5-day average after four consecutive settles above it, the third consecutive settle above the 9-day, the last settle beneath it on 11/10/26, the 23rd consecutive settle beneath the 20-day and the 50-day, the last settle above both on 10/13/26, the 12th consecutive settle beneath the 100-day, the last settle above it on 10/28/26, and the seventh consecutive settle beneath the 200-day, the last settle above it on 11/04/26. The 5-day average rose from Thursday's 27,958.50 as Friday's settle replaced the 27,085.25 settle of 11/06/26, and the 9-day eased from 27,949.50 as the 28,127.50 settle of 11/02/26 left the window.
The 5-day sits above the 9-day and beneath the 20-day. The 5-day sits beneath the 20-day because the 15 older settlements in the 20-day window averaged higher, at 28,921.77. The 20-day sits beneath the 50-day because the 30 older settlements in the 50-day window averaged higher, at 30,392.78. The 50-day sits above the 100-day because the 50 older settlements in the 100-day window averaged lower, at 29,669.53, and the 100-day sits above the 200-day because the 100 older settlements in the 200-day window averaged lower, at 27,361.29.
2.5 Oscillator and Trend Readings
The oscillator figures below are as published on the provider's technical page, read at 6:28 PM ET on Friday; Globex had not reopened, so they rest on Friday's settle, and they are the provider's readings, not computations made for this analysis. The 9-day relative strength reads 43.11, the 14-day relative strength 42.09 and the 20-day relative strength 42.34.
The 9-day raw stochastic reads 64.10 percent and the 14-day raw stochastic 43.77 percent, while the 14-day stochastic %K reads 50.66 percent and the 14-day stochastic %D 48.42 percent. The 9-day directional index ADX reads 25.94 with the 9-day +DI at 17.52 and the 9-day -DI at 21.78, and the 14-day directional index ADX reads 25.42 with the 14-day +DI at 17.20 and the 14-day -DI at 23.38, so negative direction leads on both systems. The 9-day historic volatility reads 42.46 percent and the 14-day historic volatility 38.16 percent.
The composite multi-indicator read published on Friday evening, on a page titled for Friday, November 13, 2026, is "64% SELL", with signal strength "Weak" and direction "Strengthening". The snapshot history reads "40% SELL" for the prior session, "88% SELL" a week ago and "8% SELL" a month ago. The short horizon group averages "80% SELL", the medium group "50% SELL" and the long group "33% SELL", and the trend composite reads "SELL".
2.6 Volatility and Expected Range
The published 14-day average true range stands at 813.52 points and the 14-day average daily range at 914.98 points; the 9-day average true range is 884.23, and the 20-day average true range is 750.73 with a 20-day average daily range of 815.59. Friday's 912.50 point range sat near the 14-day average daily range.
Adding and subtracting the 14-day average true range of 813.52 from the 28,034.75 settle frames Monday between 27,221.23 and 28,848.27. The published standard-deviation bands, built from five settlements, span 27,765.41 to 28,304.09 at one deviation, 27,653.84 to 28,415.66 at two and 27,568.24 to 28,501.26 at three. These bands describe dispersion, not intraday reach. In this review's judgment the approach of the Nvidia results on Tuesday, with the semiconductor index down 3.43 percent on Friday, keeps Monday's range near the 14-day average.
Key Levels
3.1 Resistance
Above the 28,034.75 settle, the first references are the 28,041.17 stall of the 14-day stochastic, this review's 28,091.00 conversion of the 28,000 concentration and the 28,095.05 retracement from the 4-week low, with the Pivot Point at 28,112.58 and the 5-day average at 28,148.50 just above. The 28,272.25 stochastic projection, one standard deviation resistance at 28,304.09, the 28,305.75 stall of the 9-day average and this review's 28,308.00 conversion of the modeled gamma-flip level form the next band, followed by this review's 28,391.00 conversion of the modeled volatility threshold and two standard deviation resistance at 28,415.66. The 28,488.88 retracement from the 52-week low, the 200-day average at 28,529.75, Pivot R1 at 28,529.92 and Friday's 28,607.75 high are the deeper references.
3.2 Support
Beneath the settle sit the 27,927.25 close of the 4:30 PM ET bar and the 9-day average at 27,939.00, followed by the 27,893.28 level at which price would cross the 9-day average. The 27,806.75 crossover stall, the 27,766.50 low of the 4:30 PM ET bar and one standard deviation support at 27,765.41 form the next band, with Friday's 27,695.25 low and two standard deviation support at 27,653.84 beneath them. Pivot S1 at 27,617.42, the 27,522.75 midpoint of the 52-week range, Tuesday's 27,516.00 low and Pivot S2 at 27,200.08 are the deeper references.
Macro Drivers
4.1 Mag7 Earnings and AI Capex Cycle
The Nvidia results conference call is scheduled for 5:00 PM ET on Tuesday, November 17, 2026, per the verified forward calendar, with results expected around 4:20 PM ET per the same entry. The news feed carried at 4:03 PM ET a report that Nvidia's weekly decline erased more than 573 billion dollars in value, at 2:10 PM ET a report that the company's board has not formally engaged chief executive candidates and is selecting a search firm, and at 3:53 PM ET a post by Tesla's chief executive supporting a petition to reinstate Nvidia's former chief executive. The feed also carried from 12:59 PM ET Microsoft statements that a service outage was a technical issue not related to cyber activity, with recovery still in progress at 3:04 PM ET. These are reports carried by the feed.
4.2 Semiconductor Cycle and Tech Sector Rotation
The semiconductor index's daily record closed at 10,146.32, down 360.35 or 3.43 percent, after a 9,828.98 low, while the Dow Jones industrial average rose 0.10 percent and the S&P 500 cash index fell 0.40 percent. The Nasdaq-100 cash index fell 1.22 percent. The provider's commentary described another selloff in chipmakers and AI-infrastructure stocks, which is attributed commentary. In this review's interpretation the rotation away from semiconductors and into the Dow's components, with the Nasdaq-100 down 1.22 percent while the Dow rose 0.10 percent, describes sector rotation rather than broad liquidation.
4.3 Fed Policy and Real Yields (Duration Sensitivity)
The US producer price index for October was released at 8:30 AM ET on Friday, November 13, 2026, per the verified forward calendar; the news-feed calendar shows a monthly reading of 0.3 percent against a 0.4 percent forecast and an annual reading of 6.5 percent against 6.6 percent. The ten-year yield index closed at 5.15 after a 5.17 high, up from 5.10, and the provider's commentary described hawkish Fed remarks lifting yields to a 4-week high, which is attributed commentary. During Friday's session the news feed carried headlines, unconfirmed beyond the feed, that Chicago Fed President Goolsbee, Boston Fed President Collins and San Francisco Fed President Daly favour further rate increases. At 4:02 PM ET the feed carried items from the Fed's financial stability report, including that debt issuance tied to advanced computing rose above 680 billion dollars by October 2026.
4.4 Geopolitical Backdrop
At 4:12 PM ET the news feed carried a press report that the President plans to meet the Russian and Chinese presidents next Thursday in Shenzhen. After the settle the feed also carried Gulf supply reports, an attack claim on the Saudi east-west oil line at 3:32 PM ET and an Iranian state media report at 3:47 PM ET of two tankers striking naval mines in the Strait of Hormuz. In this review's interpretation these are weekend gap risks for the index through crude and yields rather than direct drivers of Friday's decline.
4.5 Cross-Asset and Volatility
The volatility index's daily record closed at 19.30, up 0.60 from 18.70, after a 20.92 high. The dollar index rose 0.23 percent to 103.41, December gold rose 0.03 percent and December WTI fell 0.20 percent. The basis between the December contract's 28,034.75 settle and the Nasdaq-100's 27,943.74 cash close is 91.01 points, against 95.31 on Thursday, both measured from each session's settlement and the provider's cash close in the daily records captured at 6:21 PM ET.
4.6 Institutional Positioning
The latest weekly positioning report on the provider's overview, for the week to Tuesday, November 3, 2026, shows leveraged funds at 62,698 long, up 11,527, against 52,625 short, up 3,755, and asset managers at 109,642 long against 36,505 short, as listed and not recomputed. Friday's December volume was 803,962 contracts against 718,471 on Thursday, per the settlement record, so the down day came on higher volume. The provider lists 12/18/26 as the December contract's expiration date.
Options positioning
This analysis uses the Nasdaq-100 tracking fund's positioning console and the Nasdaq-100 column of the dealer-positioning dataset as the positioning inputs available for this contract; the fund is a proxy that tracks the index closely, and its levels are quoted in fund terms. The console, read at 6:30 PM ET, shows a current price of 677, down 1.62 percent from its 688.17 previous close. It places the largest gamma concentration and the primary put side support base together at 680, a secondary dealer-positioning level at 691 and the primary call side ceiling at 720, with call gamma of minus 1.84 billion dollars and put gamma of minus 2.35 billion. One-month implied volatility stands at 24.37 percent against one-month realized volatility of 34.79 percent, the implied volatility rank at 54.51 percent and put to call open interest at 1.12, with the largest gamma expiration on 11/20/2026.
The dataset's Nasdaq-100 column, from the edition dated Friday, November 13, 2026 at 5:01 PM ET, uses 28,289, Thursday's cash close, as its reference price. It places the modeled volatility threshold at 28,300, the modeled gamma-flip level at 28,217, the largest gamma concentration at 28,000, the primary put side support base at 27,000 and the primary call side ceiling at 29,675, with key strikes listed at 28,000, 29,000, 27,000 and 30,000, a gamma tilt of 0.935 and a 25-delta risk reversal of minus 0.071. Friday's 27,943.74 cash close sits 273.26 beneath the modeled gamma-flip level, 356.26 beneath the modeled volatility threshold and 56.26 beneath the 28,000 concentration, and 943.74 above the 27,000 put side base.
At the measured basis of 91.01, the modeled gamma-flip level corresponds to about 28,308.00 in December futures, the modeled volatility threshold to about 28,391.00, the 28,000 concentration to about 28,091.00 and the 27,000 base to about 27,091.00, each rounded to the contract's tick; these conversions are this review's, the source publishes no futures column for the index, and modeled thresholds move as positioning changes. The modeled threshold and flip level are model outputs, not option strikes. In this review's interpretation a cash close beneath both modeled levels and beneath the 28,000 concentration, with negative fund gamma on both sides, describes an environment where hedging may add to moves rather than damp them; that is an inference from the dataset, not a measured flow.
Forecast
Night Session (6:00 PM ET Sunday to 3:00 AM ET Monday, Globex/Asia)
Globex reopens at 6:00 PM ET on Sunday after two days of headline exposure; the last Friday print was the 27,927.25 close of the 4:30 PM ET bar, 107.50 beneath the settle. Japan's third-quarter growth estimate is listed for 6:50 PM ET on Sunday by the news-feed calendar, unconfirmed, and Chinese industrial output and retail sales for 9:00 PM ET on Sunday by the same calendar, also unconfirmed. In this review's judgment a gap beneath Friday's 27,695.25 low or above the 28,148.50 5-day average is possible at the reopen; expected band roughly 27,650 to 28,250.
London Session (3:00 AM to 8:00 AM ET Monday)
Euro area industrial production is listed for 5:00 AM ET on Monday by the news-feed calendar, unconfirmed. Bias lower beneath the 28,112.58 Pivot Point, expected band roughly 27,700 to 28,200, with the ten-year yield after Friday's 5.15 close the main cross-asset input.
Morning Session (9:30 AM to 12:00 PM ET Monday, RTH Open)
The New York manufacturing survey is listed for 8:30 AM ET on Monday by the news-feed calendar, unconfirmed, and remarks by New York Fed President Williams for 9:05 AM ET by the news-feed calendar, unconfirmed. The cash open at 9:30 AM ET sets the first directional test. Expected band roughly 27,600 to 28,350, with the 28,250 to 28,310 setup band near the upper edge.
Afternoon Session (12:00 PM to 4:00 PM ET Monday)
Remarks by Fed Chair Warsh are listed for 12:00 PM ET on Monday by the news-feed calendar, unconfirmed, and remarks by Cleveland Fed President Hammack for 2:15 PM ET by the news-feed calendar, unconfirmed. Expected band roughly 27,600 to 28,400 into the 4:00 PM ET settle, with Pivot S1 at 27,617.42 the lower reference.
Night Session Forward (6:00 PM ET Monday)
Remarks by Richmond Fed President Barkin are listed for 6:10 PM ET on Monday by the news-feed calendar, unconfirmed. Tuesday brings the US retail sales report at 8:30 AM ET on Tuesday, November 17, 2026, per the verified forward calendar, and the Nvidia results conference call at 5:00 PM ET on Tuesday, November 17, 2026, per the verified forward calendar.
Expected Range (Monday Full Session)
Low-range scenario: 27,700 to 28,250
Mid-range scenario (most likely): 27,550 to 28,400
High-range scenario: 27,250 to 28,700
Most Likely Path
In this review's analyst judgment, the most probable path holds the contract beneath the 28,148.50 5-day average through the Sunday and London sessions, with a rebound into the 28,250 to 28,310 band after the cash open failing beneath this review's 28,391.00 conversion of the modeled volatility threshold, followed by a retest of the 27,766.50 post-settle low and Friday's 27,695.25 low into the afternoon. The composite at "64% SELL" with direction "Strengthening", a cash close beneath both modeled levels and the semiconductor decline support that reading, while the settle above the 9-day average and the five-session gain of 3.51 percent argue that dips may be bought ahead of the Nvidia results.
The alternative that would invalidate this reading is a settle above two standard deviation resistance at 28,415.66, which would bring the 200-day average at 28,529.75 and Pivot R1 at 28,529.92 into play; a recovery in chipmakers or softer remarks from the Fed Chair are the inputs most likely to drive that alternative. On the other side, a further rise in yields could carry the contract through Friday's low toward Pivot S1 at 27,617.42 and Tuesday's 27,516.00 low without the rebound the setup needs.
Calendar
Friday's releases are complete. The US producer price index for October was released at 8:30 AM ET on Friday, November 13, 2026, per the verified forward calendar, with the readings described in section 4.3, and the December contract settled at 4:00 PM ET at 28,034.75. Remarks by Fed Vice Chair Jefferson were scheduled for 7:00 PM ET on Friday, per the news-feed calendar and unconfirmed, and their content is not covered here.
Sunday evening brings Japan's third-quarter growth estimate, listed for 6:50 PM ET on Sunday by the news-feed calendar, unconfirmed, and Chinese industrial output and retail sales, listed for 9:00 PM ET on Sunday by the news-feed calendar, unconfirmed. Euro area industrial production is listed for 5:00 AM ET on Monday by the news-feed calendar, unconfirmed. The New York manufacturing survey is listed for 8:30 AM ET on Monday by the news-feed calendar, unconfirmed, with a consensus of 19 against 25.50 previously.
Remarks by New York Fed President Williams are listed for 9:05 AM ET on Monday by the news-feed calendar, unconfirmed. Remarks by Fed Chair Warsh are listed for 12:00 PM ET on Monday by the news-feed calendar, unconfirmed. Remarks by Cleveland Fed President Hammack are listed for 2:15 PM ET and by Richmond Fed President Barkin for 6:10 PM ET on Monday by the news-feed calendar, unconfirmed.
Later in the week, the US retail sales report is scheduled for 8:30 AM ET on Tuesday, November 17, 2026, per the verified forward calendar, the Nvidia results conference call for 5:00 PM ET on Tuesday, November 17, 2026, per the verified forward calendar, and the FOMC minutes for 2:00 PM ET on Wednesday, November 18, 2026, per the verified forward calendar. The positioning note lists the volatility index expiration on 11/18 and monthly options expiration on 11/20, dates that are unconfirmed by the verified forward calendar. The captured calendars carry no scheduled US release for Monday that the verified forward calendar confirms. In this review's judgment the Nvidia results on Tuesday are the first-order event for the contract this week, with the 12:00 PM ET remarks by the Fed Chair on Monday, listed by the news-feed calendar and unconfirmed, the main scheduled item before them.
Primary setup
Direction: Short
Rationale: The contract settled beneath the 5-day, 20-day, 50-day, 100-day and 200-day averages after a lower high and a lower low, the composite reads "64% SELL" with direction "Strengthening", and the cash index closed beneath both modeled positioning levels. A rebound into the 28,250 to 28,310 band, around one standard deviation resistance at 28,304.09, the 28,305.75 stall of the 9-day average and this review's 28,308.00 conversion of the modeled gamma-flip level, offers a short with a defined risk point above two standard deviation resistance at 28,415.66. The five-session gain and the settle above the 9-day average leave room for a rebound that runs through the band, so the setup is an analyst judgment that rebounds into the modeled levels are sold, not a measured edge.
Entry Zone: 28,250 to 28,310
Stop Loss: 28,440 (above two standard deviation resistance at 28,415.66 and this review's 28,391.00 conversion of the modeled volatility threshold)
Target 1 (T1): 28,120 (above the Pivot Point at 28,112.58)
Target 2 (T2): 27,960 (above the 27,939.00 9-day average)
Target 3 (T3, extended): 27,800 (above the 27,766.50 post-settle low and one standard deviation support at 27,765.41)
Risk-to-Reward: Approximately 1:1 to T1, 1:2 to T2, 1:3 to T3
Invalidation: A settle above two standard deviation resistance at 28,415.66 negates the thesis. Short of that, the edge is removed by acceptance above the entry band rather than by a touch, defined as two consecutive 30-minute closes above 28,310.
Macro override: A recovery in chipmakers ahead of the Nvidia results, a decline in yields or softer remarks from the Fed Chair on Monday would support the contract. In that scenario a move through the 28,440 stop invalidates the short before the targets, and the 200-day average at 28,529.75 becomes the reference, 89.75 beyond the stop and well inside one 14-day average true range of 813.52.
Sources and methodology
Prices, settlements and volume come from the exchange settlement record and the provider's daily series for the December contract (NQZ26). Session timing comes from the 30-minute bar series of Friday's Globex session, from the 6:00 PM ET reopen on Thursday. Moving averages were computed from 260 completed daily settlements; oscillators, the composite read and the pivot ladder are quoted as published, and the pivot ladder was checked against Friday's high, low and settle. Dealer-positioning levels come from an options positioning dataset whose index reference is Thursday's 28,289.19 cash close, and are converted to futures at the measured 91.01 point basis. Economic-calendar times come from the verified forward calendar unless marked as listed and unconfirmed.
The prior card is graded only on its own levels, with the full Friday session from the Thursday reopen; no fill is assumed, and a target counts only on a bar after the activation bar.
Friday's cash session erased the overnight rebound; Monday's question is whether the next bounce stalls in the 28,250 to 28,310 band before Tuesday's Nvidia results.