
At 8:30 AM ET on Wednesday the September consumer price index printed, and the 30-minute bar that holds the release opened at 30,844.00, sank to 30,543.00 and closed at 30,557.00. The news-feed calendar showed 3.7 percent for the year against a 3.6 percent forecast, and 0.3 percent for the core month against 0.2 percent. The record sets the print and the bar side by side. It assigns no cause.
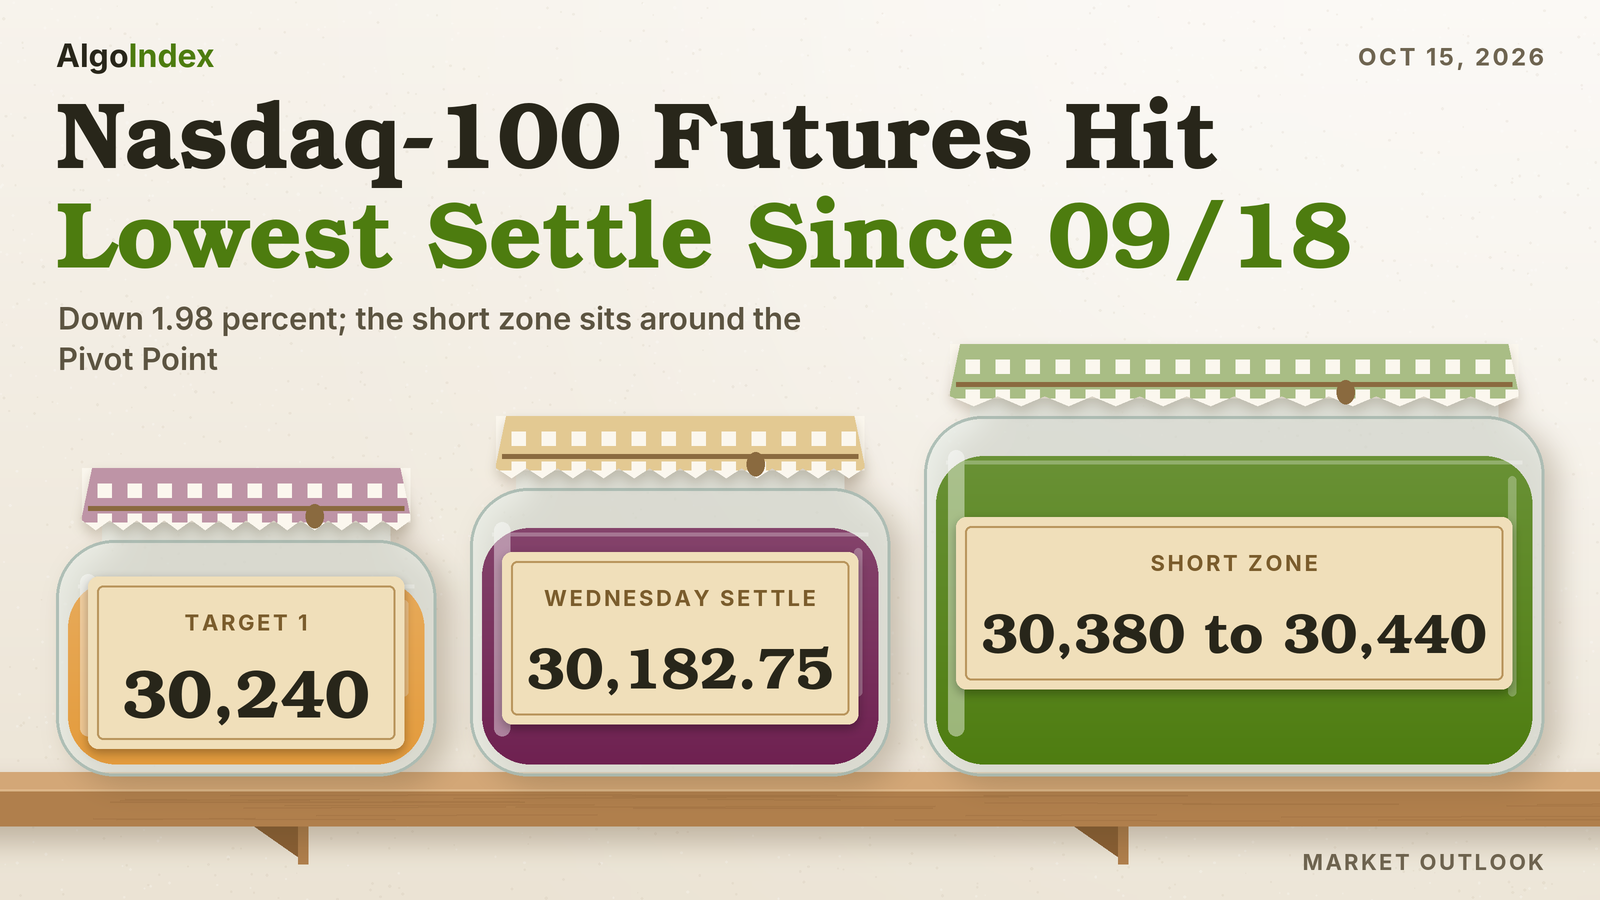
The selling did not stop there. The December Nasdaq-100 contract set its 30,078.00 low in the 3:00 PM ET bar and settled at 30,182.75, down 608.75 points, or 1.98 percent, from Tuesday's 30,791.50. It was a lower high and a lower low. That made three lower settles in a row, the lowest settle since the 29,917.25 of 09/18. The 813.50 point range was the widest since 09/21, 1.77 times the 14-day average daily range, and the settle finished at 12.9 percent of it. Chips fell harder. The semiconductor index closed down 4.30 percent.
December Nasdaq-100 futures settled at 30,182.75, down 608.75 points, after a lower high and a lower low. The settle sits beneath the 5-day through 50-day settlement averages, 3.08 points under the 50-day, and above the 100-day. The primary setup is a short from 30,380 to 30,440, a band that wraps the Pivot Point at 30,384.08 and 30,431.93, the December equivalent of the put side support base, stop 30,580 above one standard deviation resistance at 30,541.32, targets 30,240, 30,070 and an extended 29,900. It needs a rally to engage. The whole band sits 197.25 to 257.25 points above the settle. Producer prices and retail sales print at 8:30 AM ET Thursday, as the calendar lists them, after the Taiwanese chipmaker reports at 2:00 AM ET.
Wednesday's 30,891.50 high stopped 28.50 points under the short band
In Wednesday’s outlook we set a short from 30,920 to 30,980, stop 31,090. Its targets sat at 30,810, 30,670 and an extended 30,530. Wednesday's bar, from the review, opened at 30,791.50 at the Tuesday 6:00 PM ET reopen, marked a high of 30,891.50 and a low of 30,078.00, and settled at 30,182.75. The band never traded. The high stopped 28.50 points beneath its 30,920 bottom and 88.50 beneath its 30,980 top. The stop sat 198.50 points above the high.
The 30-minute record places both extremes. The high printed in the 11:00 PM ET bar on Tuesday evening, which traded from 30,862.50 to 30,891.50 and closed at 30,876.00, hours before the inflation release. The low printed in the 3:00 PM ET bar. Price ran through all three of the card's targets along the way. The first bar, from 6:00 PM ET, already dipped to 30,767.00, beneath 30,810. The 8:30 AM ET bar was the first to trade beneath 30,670 and the 9:30 AM ET bar the first beneath 30,530, and the low finished 452.00 points under that extended target. Without an entry in the band, those prints score nothing. No fill and no result is asserted.
The card's other lines stayed out of play. Its invalidation was a settle above Pivot R2 at 31,077.67, and the settle finished 894.92 points beneath it. Its acceptance test needed two consecutive 30-minute closes above 30,980. No bar traded that high. The outlook weighted a rally that fails beneath the 30,972.02 threshold equivalent above a sustained break higher, and the high stopped 80.52 points beneath that equivalent. The hold it expected did not come. Its most probable path kept the contract between Pivot S2 at 30,448.17 and Pivot R2, and the low broke S2 by 370.17 points.
Our ranges broke on the downside. The low-range case of 30,620 to 30,935, the most likely case of 30,450 to 31,080 and the high-range case of 30,350 to 31,240 all gave way, the widest by 272.00 points, while the high stayed inside each of them. The overnight bands held. From 6:00 PM ET through the 2:30 AM ET bar the contract traded 30,705.25 to 30,891.50, inside the 30,640 to 30,900 Globex band, and the London bars held 30,716.00 to 30,861.75, inside 30,600 to 30,940. The morning band of 30,450 to 31,130 broke in the 10:30 AM ET bar.
The Pivot Point at 30,384.08, the 30,380 to 30,440 band and the 30,431.93 put-base equivalent
The basis widened to 231.93 points, the 30,182.75 settle less the 29,950.82 cash close, from 222.02 on Tuesday. Every December equivalent of a positioning level in this article uses it: 30,231.93 for the 30,000 gamma concentration, 30,431.93 for the 30,200 put-side base, 30,494.93 for the 30,263 modeled gamma-flip level and 30,881.93 for the 30,650 modeled volatility threshold. These conversions are the review's own. The desk note publishes no Nasdaq futures pair.
Resistance starts at once. The 50-day average at 30,185.83 sits 3.08 points above the settle, with the 40-day crossing price at 30,214.22 and the 30,231.93 concentration equivalent close behind. The 50 percent retracement of the four-week range at 30,334.75 comes next. Then the band. The Pivot Point at 30,384.08 sits 4.08 points above its 30,380 bottom and the momentum projection level at 30,385.70 sits 5.70 above it, while the 30,431.93 put-base equivalent lies 8.07 points beneath the 30,440 top. The 30,494.93 flip equivalent, one standard deviation resistance at 30,541.32 and the 14-day relative strength midpoint projection at 30,566.37 form the next grouping. Then the stop. It sits at 30,580, 13.63 points above that projection. Beyond it come the 38.2 percent retracement from the four-week high at 30,637.24, two standard deviations resistance at 30,689.85, Pivot R1 at 30,690.17, the 20-day average at 30,787.44, the 5-day at 30,790.15 and three standard deviations resistance at 30,803.81. The 30,881.93 threshold equivalent, Wednesday's 30,891.50 high, the 18-day crossing price at 30,900.22 and Tuesday's 30,906.00 high follow. The 9-day crossing price at 31,019.25 and the 9-day average at 31,023.97 sit higher still, and Pivot R2 at 31,197.58 and Pivot R3 at 31,503.67 are the extended references, with the 31,616.50 52-week high above them.
Support starts 104.75 points down, at Wednesday's 30,078.00 low, with the 100-day average at 30,064.43 just beneath it. The two 38.2 percent retracements, from the 13-week high at 30,037.12 and from the four-week low at 30,032.26, sit 4.86 points apart. The published target price at 29,940.97, Pivot S1 at 29,876.67, one standard deviation support at 29,824.18 and the 40-day stall level at 29,804.00 form the next band. A second grouping lies deeper. It starts with the 3-10 day crossover stall level at 29,696.32, two standard deviations support at 29,675.65, Pivot S2 at 29,570.58, three standard deviations support at 29,561.69 and the 50 percent retracement of the 13-week range at 29,549.25. Pivot S3 at 29,063.17 and the 29,053.00 one-month low lie beyond, with the 200-day average at 28,263.41 and the 27,482.00 13-week low far below.
Every short average sits overhead. The settle is 607.40 points beneath the 5-day, 841.22 beneath the 9-day, 604.69 beneath the 20-day and 3.08 beneath the 50-day. It is 118.32 above the 100-day and 1,919.34 above the 200-day. The 5-day fell 243.90 points from 31,034.05 as the 10/07 settle of 31,402.25 left the window. The 20-day rose 46.30 from 30,741.14 as the 09/16 settle of 29,256.75 dropped out, and the 50-day edged up 0.37 from 30,185.46. The 5-day now sits just 2.71 points above the 20-day. Older settlements sit lower. The 30 older ones in the 50-day window averaged 29,784.76, and the 50 older ones in the 100-day window 29,943.04. Thursday's crossing prices are 31,019.25 for the 9-day, 30,900.22 for the 18-day and 30,214.22 for the 40-day.
Momentum sagged. Relative strength reads 35.82 on the 9-day, 43.74 on the 14-day and 47.61 on the 20-day. Both raw stochastics read 6.81 percent, and the 14-day %K at 28.10 percent sits beneath %D at 42.93 percent. Sellers lead by a wide margin. On the 9-day, negative direction at 31.58 tops positive at 14.74 by 16.84, with the ADX at 23.62; on the 14-day, 27.07 tops 18.02 by 9.05, with the ADX at 17.16. Historic volatility reads 15.11 percent and 13.26 percent. These readings are as published for the Thursday session after the 6:00 PM ET reopen, so the page may carry the live Globex price.
The composite multi-indicator read swung to 8 percent sell from 40 percent buy, strength weak and direction weakening. A week ago it read 88 percent buy. A month ago, 64 percent sell. The short-horizon group averages 40 percent sell, the medium 25 percent sell and the long 67 percent buy, and the trend indicator reads hold.
Wednesday ran wide. The 14-day average true range stands at 470.55 points, 1.56 percent of the settle, and the 14-day average daily range at 459.70; the 9-day figures are 476.16 and 464.64 and the 20-day figures 475.97 and 479.51. One average true range either side of the settle spans 29,712.20 to 30,653.30. The deviation bands, built from five settlements, run 29,824.18 to 30,541.32, 29,675.65 to 30,689.85 and 29,561.69 to 30,803.81, and describe settlement dispersion only. Eight sessions of daily ranges read 413.50, 307.25, 378.00, 674.00, 313.50, 445.00, 314.75 and 813.50 points. Last week spanned 31,616.50 to 30,792.00, and Wednesday's low sits 714.00 points beneath that span. Over five sessions the contract fell 1,219.50 points from the 31,402.25 settle of 10/07. The 52-week high sits 1,433.75 above the settle and the 29,053.00 one-month low 1,129.75 beneath it. No prior-quarter extremes were captured, so the 13-week high of 31,616.50 and low of 27,482.00 stand in.
A hot inflation print, a 4.30 percent chip slide and producer prices next
Chips fell hardest. The semiconductor index closed at 11,684.38, down 524.41 points or 4.30 percent from 12,208.79. The Nasdaq-100 cash index closed at 29,950.82, down 2.02 percent, against 1.11 percent for the S&P 500 and 0.09 percent for the Dow Jones Industrial Average, and the QQQ fund closed at 728.95, down 1.97 percent. The desk note said the semiconductor fund fell for a seventh consecutive session, erasing roughly 1 trillion dollars of market value, while healthcare and consumer staples outperformed as capital rotated into defensive sectors. The wrap went further. A market wrap carried by the news feed said renewed losses in semiconductor shares and the stronger inflation report lifted rate-increase expectations.
Rate bets moved fast. The news feed carried at 8:31 AM ET to 8:34 AM ET that rate futures fell as traders added to bets on an October increase, and at 9:05 AM ET that traders fully price two Federal Reserve increases by the end of January. The desk note said the probability it assigns to an October increase rose to 33 percent from 22 percent. At 2:36 PM ET and 3:09 PM ET to 3:20 PM ET two regional Federal Reserve presidents, per the news feed, called the report higher than hoped and discouraging. The ten-year yield index traded between 5.18 and 5.33 percent and closed at 5.19 percent against 5.21 percent on Tuesday. The 13-week bill yield index rose to 4.09 percent from 4.05 percent. No inflation-protected yield was captured. The dollar index closed at 102.55, up 0.37.
Technology headlines stacked up. At 12:40 PM ET the news feed carried the President's announcement of a 21 billion dollar semiconductor plant arrangement with a US chip foundry, jointly owned with Japan. At 1:25 PM ET and 1:50 PM ET it carried remarks from a cloud computing provider's chief executive that its backlog more than supports its debt and that its share drop reflected an irrational market. Then came the chip maker. At 1:34 PM ET to 1:35 PM ET the leading graphics-chip maker's chief executive said, per the news feed, that safety concerns are industry growing pains and that the company would cut off customers who build unsafe artificial intelligence. The phone maker featured twice. Items from the largest US phone maker's litigation with an artificial intelligence developer ran from 11:19 AM ET to 11:34 AM ET, and at 3:50 PM ET the news feed carried a report that the company plans to launch its artificial intelligence features in China. A central banker weighed in. At 3:18 PM ET to 3:20 PM ET a regional Federal Reserve president said, per the news feed, that hype around artificial intelligence could cause more tech investment and risk overheating, and that he is watching the financial stability implications. These are statements carried by the news feed and were not measured as results. The European lithography maker's results, released at 1:00 AM ET as the calendar lists them, were described by the news feed's 4:26 AM ET sentiment note as strong.
Gulf headlines ran through the session. The news feed carried at 9:33 AM ET an Iranian state media report of an explosion in Riyadh with reported damage to oil facilities, and at 1:38 PM ET a Houthi statement of a ballistic missile attack on Riyadh's main airport. At 3:03 PM ET and 3:24 PM ET it carried reports of attacks on and an explosion in Jeddah. These are statements carried by the news feed and were not confirmed as events. November WTI crude settled at 95.09, up 1.01 percent.
Implied volatility jumped. The Nasdaq-100 volatility index closed at 22.70, up 1.56 from 21.14, and the S&P 500 volatility index at 16.87, up 1.60. The volatility-of-volatility index closed at 94.45, up 9.07. The desk note said the at-the-money same-day straddle priced a move of about 43 basis points against a realised move more than four times larger, and that fixed-strike implied volatility rose about one point for this week's expiration while longer-dated implied volatility was little changed. December gold settled at 4,107.9, down 1.66 percent.
The cash close sits beneath every model line. The 5:20 PM ET Wednesday desk note carries Tuesday's closes in its reference column: 30,569 matches Tuesday's 30,569.48 cash close, and 743 is consistent with the fund's 743.57 Tuesday close. Against Wednesday's 29,950.82 close, the index sits 49.18 points beneath the 30,000 gamma concentration, 249.18 beneath the 30,200 put-side base, 312.18 beneath the 30,263 modeled gamma-flip level and 699.18 beneath the 30,650 modeled volatility threshold. One field was dropped. The note's call-side field for the index reads 29,475, beneath its own put-side field, so it is treated as low-confidence and excluded. Gamma tilt reads 1.146 for the index and 0.840 for the QQQ fund, with gamma notional of plus 4.704 million and minus 265.249 million. The note lists 30,000, 31,000, 30,500 and 30,300 as key strikes.
On the QQQ proxy the call-side ceiling sits at 760, the threshold at 746, the flip level at 742, the largest concentration at 740 and the put-side base at 725. The fund's 728.95 close sits 3.95 above that base and 13.05 beneath the flip level. Its console, read at about 6:20 PM ET and dated 2026-10-14, shows call gamma of minus 430.11 million against put gamma of minus 1.82 billion, one-month implied volatility of 18.54 percent against realised volatility of 14.97 percent, an implied-volatility rank of 24.82 percent and a put-to-call open-interest ratio of 1.42. Those figures changed from the previous read. They count as current. The high and low volatility point fields are inverted and excluded. In the review's interpretation, drawn from the QQQ fund proxy, a cash close beneath both the flip level and the put-side base with the fund's call and put gamma both negative places the contract in a zone where dealer positioning does not dampen moves, although the index's own gamma notional reads positive. The threshold and flip level are model outputs. Neither is an option strike.
Activity surged. Volume reached 731,907 contracts, the highest since the 795,240 of 10/01, against Tuesday's 532,591, a figure revised from the 529,213 carried in Wednesday's outlook. Open interest read 278,674 on the 2026-10-13 row against 281,129 on the 2026-10-12 row, and Wednesday's figure is not yet reported. The positioning report is dated October 6, 2026. It puts asset managers at 111,727 long against 37,929 short, leveraged funds at 51,349 long, up 3,199, against 70,561 short, down 2,312, a net short of 19,212, and dealers at 48,831 long against 121,393 short.
The trade map for Thursday
The primary setup is a short from 30,380 to 30,440. Wednesday printed a lower high and a lower low for a third lower settle, and the settle sits beneath the 5-day through 50-day averages. Negative direction leads on both windows. The composite swung to 8 percent sell with direction weakening, and the cash index closed beneath the modeled gamma-flip level with the fund's gamma negative. The band wraps the Pivot Point at 30,384.08, the momentum projection level at 30,385.70 and the 30,431.93 put-base equivalent, with its top 8.07 points above that equivalent. All of it sits above the settle. A fill there means price has climbed at least 197.25 points off the settle, so the thesis is that a rally into the Pivot Point stalls. The targets sit at 30,240, 8.07 above the 30,231.93 concentration equivalent, 30,070, 8.00 beneath Wednesday's low, and an extended 29,900, 23.33 above Pivot S1. Caveats remain. Both raw stochastics sit at 6.81 percent, the settle sits just beneath the 50-day average, and the chipmaker's results and producer prices can move the index sharply, so the review calls it an analyst judgment that the decline extends from a rally, with no measured edge behind it.
Now the arithmetic. From the 30,410 midpoint the risk to the stop is 170 points, 36.1 percent of the 14-day average true range of 470.55. The targets sit 170, 340 and 510 points beneath the midpoint. Exact multiples. The first target, 30,240, sits 57.25 points above the settle. The settle sits 197.25 points beneath the band bottom and 257.25 beneath its top, and the 6:25 PM ET quote widens the first gap to 312.25.
The scenario ranges are analyst judgment. The low-range case runs 29,824 to 30,541, the most likely 29,676 to 30,690 and the high-range case 29,562 to 30,804. Session by session the review expects roughly 29,850 to 30,400 through Globex, with a neutral to lower bias beneath the 30,380 to 30,440 band. London follows at 29,800 to 30,450, with the band the first meaningful resistance. The morning band runs 29,700 to 30,550 and the afternoon band 29,650 to 30,650. At writing the Thursday session had opened at 30,154.75 and traded from 30,062.00 to 30,158.50, and it was quoted at 30,067.75 at 6:25 PM ET, 115.00 points beneath the settle. The 4:30 PM ET bar had closed at 30,139.25, a post-settlement quote and not the settle.
Thursday's calendar starts overnight. Japanese machinery orders are listed at 7:50 PM ET Wednesday and Australian employment at 8:30 PM ET, both per the news-feed calendar and unconfirmed. A Federal Reserve vice chair speaks at 10:55 PM ET and the Taiwanese chipmaker reports at 2:00 AM ET, as the calendar lists them. Europe follows. UK output data are listed at 2:00 AM ET and euro-area industrial production at 5:00 AM ET, per the news-feed calendar and unconfirmed. Then the main event. Producer prices and retail sales for September print at 8:30 AM ET, as the calendar lists them, with the news-feed calendar listing 0.6 percent for monthly producer prices and 0.3 percent for retail sales. Weekly jobless claims and the Philadelphia and New York manufacturing surveys are listed at the same time, per the news-feed calendar and unconfirmed. Two more follow later. Business inventories follow at 10:00 AM ET and the weekly petroleum status report at 12:00 PM ET, as the calendar lists them. A Federal Reserve bank president is listed at 4:30 PM ET, per the news-feed calendar and unconfirmed. The Federal Reserve Chair's discussion with the International Monetary Fund's managing director is set for 11:30 PM ET. Import prices follow at 8:30 AM ET and industrial production at 9:15 AM ET on Friday, October 16, 2026, as the calendar lists them. The desk note lists monthly options expiration on Friday and the volatility-index expiration on 10/21, per the positioning note and unconfirmed, and a streaming company reports at about 4:01 PM ET on Tuesday, October 20, 2026, as the calendar lists it.
One path is weighted. In the review's analyst judgment the most probable path holds the contract between two standard deviations support at 29,675.65 and two standard deviations resistance at 30,689.85, with producer prices, yields and the chipmaker's results deciding the side. In that judgment a rally that fails beneath one standard deviation resistance at 30,541.32 is weighted above a sustained recovery. No measured frequency backs it. The alternative is a soft producer-price print or strong chipmaker results that carry the contract back above the 30,494.93 flip equivalent toward Pivot R1 at 30,690.17. Two releases matter most. In the review's judgment the September producer price index at 8:30 AM ET, together with the chipmaker's results at 2:00 AM ET, is the first-order influence on Thursday.
Wednesday's high came in the 11:00 PM ET bar the night before; Thursday's short band begins 197.25 points above the settle.
The complete data picture
Every number behind Thursday’s plan, charted first, then the full level lists, then the complete numeric reference underneath.
Full numeric reference, every remaining figure from the session review
1. Executive Summary
The December Nasdaq-100 contract settled at 30,182.75 on Wednesday, down 608.75 points or 1.98 percent from Tuesday's settle of 30,791.50, after trading between 30,891.50 and 30,078.00, an 813.50 point daily range. The settle finished at 12.9 percent of the range, and the range was 1.77 times the published 14-day average daily range of 459.70 points. Wednesday printed a lower high and a lower low against Tuesday and was the third consecutive lower settle. The 30,182.75 settle was the lowest since the 29,917.25 settle of 09/18, the 608.75 point decline the largest since the 999.00 point decline of 06/23, and the 813.50 point range the widest since the 958.75 point range of 09/21.
The September consumer price index printed at 8:30 AM ET, as the calendar lists it, with the news-feed calendar showing 3.7 percent for the year against a 3.6 percent forecast and 0.3 percent for the core month against 0.2 percent. In the 30-minute series the 8:30 AM ET bar opened at 30,844.00, traded down to 30,543.00 and closed at 30,557.00, and the session low of 30,078.00 printed in the 3:00 PM ET bar. The news feed carried at 9:05 AM ET that traders fully price two Federal Reserve increases by the end of January, and a market wrap carried by the feed said renewed losses in semiconductor shares and the stronger inflation report lifted rate-increase expectations. The semiconductor index closed at 11,684.38, down 4.30 percent, and the Nasdaq-100 cash index at 29,950.82, down 2.02 percent.
The composite multi-indicator read fell to 8 percent sell from 40 percent buy in the prior session's snapshot, with strength described as weak and direction as weakening. The desk note for the session said the semiconductor fund fell for a seventh consecutive session and that the probability it assigns to an October increase rose to 33 percent from 22 percent.
The Thursday session opens with the settle 3.08 points beneath the 50-day settlement average and 604.69 points beneath the 20-day, and producer prices and retail sales print at 8:30 AM ET, as the calendar lists them, after the Taiwanese chipmaker reports at 2:00 AM ET, as the calendar lists it. The published 14-day average true range of 470.55 points is 1.56 percent of the settle. The Primary Setup below is a short from the 30,380 to 30,440 band, around the Pivot Point at 30,384.08 and the 30,431.93 conversion of the put side support base, stopped at 30,580 above one standard deviation resistance at 30,541.32, with objectives at 30,240, 30,070 and an extended 29,900.
2. Price Action & Technical Structure
2.1 Intraday and Session Review
The Wednesday session opened at 30,791.50 at the Tuesday 6:00 PM ET reopen, level with Tuesday's settle, marked a daily high of 30,891.50 and a daily low of 30,078.00, and settled at 30,182.75. The 30-minute series for the session places the session high of 30,891.50 in the 11:00 PM ET bar on Tuesday evening and the session low of 30,078.00 in the 3:00 PM ET bar. The 8:00 AM ET bar closed at 30,839.75; the 8:30 AM ET bar, which contains the inflation release, fell from a 30,844.00 open to a 30,543.00 low and closed at 30,557.00, and the 9:30 AM ET bar traded down to 30,465.75 and closed at 30,474.50. The 3:00 PM ET bar that set the low closed at 30,192.75, and the 4:00 PM ET bar closed at 30,146.25. The daily high and low are full Globex session extremes and not extremes of the cash session.
After the settle, the chart's 4:30 PM ET bar closed at 30,139.25; that post-settlement quote is not used as the settlement anywhere in this review. Globex reopened at 6:00 PM ET, so the provider's displayed day open, high and low of 30,154.75, 30,158.50 and 30,062.00 belong to the new session dated Thursday, not to Wednesday, and are not used as Wednesday's range.
The session extremes used here are the completed-session inputs behind the published pivot ladder and were not read independently from a bar, back-solved from the outer pivot pairs and verified against every rung. Pivot R3 at 31,503.67 minus Pivot S3 at 29,063.17, divided by three, returns 813.50, and Pivot R2 at 31,197.58 minus Pivot S2 at 29,570.58, divided by two, returns the same 813.50. Three times the Pivot Point of 30,384.08 less the 30,182.75 settle gives a high plus low sum of 60,969.49, which the pair of 30,891.50 and 30,078.00 reproduces to within the rounding of the published Pivot Point, and that pair reproduces all seven published rungs. Independent corroboration: the provider's settlement row, the chart's completed Wednesday daily bar and the extremes of the 30-minute series carry the same 30,891.50 high and 30,078.00 low.
2.2 Daily Structure
Wednesday printed a lower high and a lower low against Tuesday: the 30,891.50 high sits 14.50 points beneath Tuesday's 30,906.00, and the 30,078.00 low sits 513.25 points beneath Tuesday's 30,591.25. The settle at 12.9 percent of the range leaves an upper shadow of 100.00 points above the 30,791.50 open and a lower shadow of 104.75 points beneath the settle on the daily bar. The sequence of session highs over the last six sessions reads 31,521.00, 31,466.00, 31,266.50, 31,289.25, 30,906.00 and 30,891.50, and the sequence of session lows reads 31,143.00, 30,792.00, 30,953.00, 30,844.25, 30,591.25 and 30,078.00. Settlements over the same six sessions ran 31,402.25, 30,969.50, 31,108.75, 30,898.25, 30,791.50 and 30,182.75.
Last week, October 5 through October 9, spanned 31,616.50 to 30,792.00, and Wednesday's 30,078.00 low sits 714.00 points beneath that span. The 52-week, 13-week and one-month high of 31,616.50 from 10/06 sits 1,433.75 points above the settle, and the one-month low of 29,053.00 sits 1,129.75 points beneath it. Over five sessions the contract fell 1,219.50 points from the 31,402.25 settle of 10/07, matching the provider's five-day change of minus 1,219.50.
No prior-quarter high or low was captured, so the 13-week extremes serve as the available quarterly reference: 31,616.50 above and 27,482.00 beneath.
2.3 4-Hour and Swing Structure
Daily ranges for the last eight sessions ran 413.50, 307.25, 378.00, 674.00, 313.50, 445.00, 314.75 and 813.50. The settlement changes over the same eight sessions read plus 256.00, plus 165.50, minus 81.00, minus 432.75, plus 139.25, minus 210.50, minus 106.75 and minus 608.75.
The retracement grid published for Thursday places the 50 percent retracement of the four-week range at 30,334.75 and the 38.2 percent retracement from the four-week high at 30,637.24 above the settle. Beneath the settle, the 38.2 percent retracement from the 13-week high sits at 30,037.12, the 38.2 percent retracement from the four-week low at 30,032.26 and the 50 percent retracement of the 13-week range at 29,549.25. No four-hour series was captured, so swing structure here rests on daily bars and the preserved 30-minute session.
2.4 Moving Averages
The averages cited in this subsection were computed from the provider's daily settlement series for the December contract, which holds 259 completed sessions through Wednesday. The 5-day average stands at 30,790.15, the 9-day at 31,023.97, the 20-day at 30,787.44, the 50-day at 30,185.83, the 100-day at 30,064.43 and the 200-day at 28,263.41.
The 30,182.75 settle sits 607.40 points beneath the 5-day average, 841.22 beneath the 9-day, 604.69 beneath the 20-day and 3.08 beneath the 50-day, and 118.32 points above the 100-day and 1,919.34 above the 200-day. The 5-day average fell 243.90 points from Tuesday's 31,034.05, because the 10/07 settle of 31,402.25 left the window and was replaced by 30,182.75. The 20-day rose 46.30 points from 30,741.14, because the 09/16 settle of 29,256.75 left that window, and the 50-day rose 0.37 points from 30,185.46. The 5-day average now sits 2.71 points above the 20-day.
The 20-day average sits above the 50-day because the last 20 settlements averaged 30,787.44 against 30,185.83 for the full 50, which means the 30 older settlements in the 50-day window averaged lower, at 29,784.76. The 50-day sits above the 100-day because the older 50 settlements in the 100-day window averaged lower, at 29,943.04. The projection grid gives the prices at which each average would be crossed on Thursday: 31,019.25 for the 9-day, 30,900.22 for the 18-day and 30,214.22 for the 40-day.
2.5 Oscillator and Trend Readings
The oscillator figures below are as published on the provider's technical page dated for the Thursday session and read after the 6:00 PM ET reopen; the page can substitute the live Globex price for the settle, so these readings carry that caveat. The 9-day relative strength reads 35.82, the 14-day relative strength 43.74 and the 20-day relative strength 47.61.
The 9-day raw stochastic reads 6.81 percent and the 14-day raw stochastic 6.81 percent, while the 14-day stochastic %K reads 28.10 percent and the 14-day stochastic %D 42.93 percent, so %K sits beneath %D in the lower half of the range.
The 9-day directional index ADX reads 23.62 with the 9-day +DI at 14.74 and the 9-day -DI at 31.58; the 14-day directional index ADX reads 17.16 with the 14-day +DI at 18.02 and the 14-day -DI at 27.07, so negative direction leads on both. The 9-day historic volatility reads 15.11 percent and the 14-day historic volatility 13.26 percent.
The composite multi-indicator read published for the Thursday session is 8 percent sell, against 40 percent buy in the prior session's snapshot, with signal strength described as weak and direction as weakening. The snapshot history reads 88 percent buy a week ago and 64 percent sell a month ago. The short-horizon group averages 40 percent sell, the medium-horizon group 25 percent sell and the long-horizon group 67 percent buy, and the composite trend indicator reads hold.
2.6 Volatility and Expected Range
The published 14-day average true range stands at 470.55 points and the 14-day average daily range at 459.70 points; the 9-day average true range is 476.16 with a 9-day average daily range of 464.64, and the 20-day average true range is 475.97 with a 20-day average daily range of 479.51. Wednesday's 813.50 point range was 1.77 times the 14-day average daily range.
Adding and subtracting the 14-day average true range of 470.55 points from the 30,182.75 settle frames Thursday between 29,712.20 and 30,653.30. The published standard-deviation bands are narrower because they are built from five settlements: one deviation spans 29,824.18 to 30,541.32, two spans 29,675.65 to 30,689.85 and three spans 29,561.69 to 30,803.81. These bands describe settlement dispersion, not intraday reach.
3. Key Levels
3.1 Resistance
Above the 30,182.75 settle, the 50-day settlement average at 30,185.83 and the 40-day average crossing price at 30,214.22 come first, with the 30,231.93 conversion of the largest gamma concentration just above. The 50 percent retracement of the four-week range at 30,334.75 follows, and the Pivot Point at 30,384.08, the momentum projection level at 30,385.70 and the 30,431.93 conversion of the put side support base form the band that anchors the setup. The 30,494.93 conversion of the modeled gamma-flip level, one standard deviation resistance at 30,541.32 and the 14-day relative strength midpoint projection at 30,566.37 form the next grouping. The 38.2 percent retracement from the four-week high at 30,637.24, two standard deviations resistance at 30,689.85, Pivot R1 at 30,690.17 and the 20-day settlement average at 30,787.44 come next, with Pivot R2 at 31,197.58 and Pivot R3 at 31,503.67 the extended references.
3.2 Support
Beneath the settle, Wednesday's 30,078.00 low comes first, followed by the 38.2 percent retracement from the 13-week high at 30,037.12 and the 38.2 percent retracement from the four-week low at 30,032.26. The published target price at 29,940.97, Pivot S1 at 29,876.67 and one standard deviation support at 29,824.18 form the next band, followed by the 40-day stall level at 29,804.00. The 3-10 day crossover stall level at 29,696.32, two standard deviations support at 29,675.65, Pivot S2 at 29,570.58, three standard deviations support at 29,561.69 and the 50 percent retracement of the 13-week range at 29,549.25 form the next grouping, with Pivot S3 at 29,063.17 and the 29,053.00 one-month low beyond.
4. Macro Drivers
4.1 Mag7 Earnings and AI Capex Cycle
The news feed carried at 1:34 PM ET to 1:35 PM ET remarks from the leading graphics-chip maker's chief executive that safety concerns are industry growing pains and that the company would cut off customers who build unsafe artificial intelligence, and at 1:25 PM ET and 1:50 PM ET remarks from a cloud computing provider's chief executive that its backlog more than supports its debt and that its share drop reflected an irrational market. At 12:40 PM ET it carried the President's announcement of a 21 billion dollar semiconductor plant arrangement with a US chip foundry, jointly owned with Japan, at 3:50 PM ET a report that the largest US phone maker plans to launch its artificial intelligence features in China, and at 11:19 AM ET to 11:34 AM ET items from that company's litigation with an artificial intelligence developer. At 3:18 PM ET to 3:20 PM ET a regional Federal Reserve president said hype around artificial intelligence could cause more tech investment and risk overheating, and that he is watching the financial stability implications of that investment. The Taiwanese chipmaker reports at 2:00 AM ET on Thursday, October 15, 2026, as the calendar lists it. These are statements carried by the news feed and not results measured.
4.2 Semiconductor Cycle and Tech Sector Rotation
The semiconductor index closed at 11,684.38 in the provider's daily record, down 524.41 points or 4.30 percent from Tuesday's 12,208.79. The desk note said the semiconductor fund declined for a seventh consecutive session, erasing roughly 1 trillion dollars of market value, while healthcare and consumer staples outperformed as capital rotated into defensive sectors. The Nasdaq-100 cash index fell 2.02 percent against 1.11 percent for the S&P 500 cash index and 0.09 percent for the Dow Jones Industrial Average, and the QQQ fund closed at 728.95, down 1.97 percent. A European lithography maker's results, released at 1:00 AM ET as the calendar lists them, were described by the news feed's 4:26 AM ET sentiment note as strong.
4.3 Fed Policy and Real Yields (Duration Sensitivity)
The consumer price index for September printed at 8:30 AM ET, as the calendar lists it, above forecast on the annual and core monthly measures. The news feed carried at 8:31 AM ET to 8:34 AM ET that rate futures fell as traders added to bets on an October increase, at 9:05 AM ET that traders fully price two increases by the end of January, and at 2:36 PM ET and 3:09 PM ET to 3:20 PM ET two regional Federal Reserve presidents calling the report higher than hoped and discouraging. The ten-year yield index traded between 5.18 and 5.33 percent and closed at 5.19 percent against 5.21 percent on Tuesday, while the 13-week bill yield index rose to 4.09 percent from 4.05 percent. No inflation-protected yield was captured, so the real-yield read rests on nominal yields only. The dollar index closed at 102.55, up 0.37.
4.4 Geopolitical Backdrop
The news feed carried at 9:33 AM ET an Iranian state media report of an explosion in Riyadh with reported damage to oil facilities, at 1:38 PM ET a Houthi statement of a ballistic missile attack on Riyadh's main airport, and at 3:03 PM ET and 3:24 PM ET reports of attacks on and an explosion in Jeddah. These are statements carried by the news feed and were not confirmed as events. November WTI crude settled at 95.09, up 1.01 percent.
4.5 Cross-Asset and Volatility
The Nasdaq-100 volatility index closed at 22.70, up 1.56 from 21.14, and the S&P 500 volatility index at 16.87, up 1.60. The volatility-of-volatility index closed at 94.45, up 9.07. The desk note said the at-the-money same-day straddle priced a move of about 43 basis points against a realised move more than four times larger, and that fixed-strike implied volatility rose about one point for this week's expiration while longer-dated implied volatility was little changed. December gold settled at 4,107.9, down 1.66 percent.
4.6 Institutional Positioning
The positioning report as of October 6, 2026, shown on the provider's overview, puts asset managers long at 111,727 contracts against short at 37,929, and leveraged funds long at 51,349, up 3,199, against short at 70,561, down 2,312, a leveraged net short of 19,212. Dealers held 48,831 long against 121,393 short. Open interest on the December contract is shown at 278,674 on Tuesday's 2026-10-13 row, against 281,129 on Monday's 2026-10-12 row; Wednesday's open interest had not been reported at the time of capture. Wednesday's volume of 731,907 contracts was the highest since the 795,240 of 10/01, against Tuesday's revised 532,591.
5. QQQ Options Flow Context (Proxy)
This review uses the QQQ fund as the proxy for the positioning data available, alongside the index levels published in the same desk note. The desk note read for this section is the 5:20 PM ET edition for Wednesday. Its reference prices are the prior session's closes, not Wednesday's: NDX 30,569 equals Tuesday's 30,569.48 cash close and QQQ 743 is consistent with the fund's 743.57 Tuesday close, and 30,569.48 less 2.02 percent gives 29,951.98, consistent with the provider's 29,950.82 close. Every index level below is read against Wednesday's 29,950.82 cash close.
On the Nasdaq-100 index the largest gamma concentration sits at NDX 30,000, the modeled volatility threshold at NDX 30,650, the modeled gamma-flip level at NDX 30,263 and the primary put side support base at NDX 30,200. The note's call side field for the index reads 29,475, beneath its own put side field, so that field is treated as low-confidence and excluded. The 29,950.82 cash close sits 49.18 points beneath the 30,000 concentration, 249.18 points beneath the put side support base, 312.18 points beneath the flip level and 699.18 points beneath the threshold. The note lists NDX 30,000, 31,000, 30,500 and 30,300 as key strikes. Gamma tilt reads 1.146 for the index and 0.840 for the fund, and gamma notional reads plus 4.704 million for the index and minus 265.249 million for the fund.
On the QQQ proxy the primary call side ceiling sits at 760, the modeled volatility threshold at 746, the modeled gamma-flip level at 742, the largest gamma concentration at 740 and the primary put side support base at 725. The fund's 728.95 close sits 3.95 above the put side support base and 13.05 beneath the flip level. The fund's positioning console, read at about 6:20 PM ET and marked as updated 2026-10-14, shows call gamma of minus 430.11 million against put gamma of minus 1.82 billion, one-month implied volatility of 18.54 percent against realised volatility of 14.97 percent, an implied-volatility rank of 24.82 percent and a put-to-call open-interest ratio of 1.42; these figures differ from the previous read, so they are treated as refreshed. Its high and low volatility point fields are inverted and excluded.
At the measured closing basis of 231.93 points, the December settlement of 30,182.75 less the 29,950.82 cash close, NDX 30,000 corresponds to 30,231.93 on the December contract, the put side support base at NDX 30,200 to 30,431.93, the modeled gamma-flip level at NDX 30,263 to 30,494.93 and the modeled volatility threshold at NDX 30,650 to 30,881.93. These are conversions made by this review; the source publishes no Nasdaq futures pair, and the modeled threshold and flip level are model outputs, not option strikes.
In this review's interpretation, drawn from the QQQ fund proxy and not from measured index or futures dealer flow (the index model's gamma notional is positive), a cash close beneath both the flip level and the put side support base, with the fund's call and put gamma both negative, places the contract in a zone where dealer positioning does not dampen moves, and the 30,431.93 put-base equivalent, now above the market, sits inside the band the setup in section 8 sells, 8.07 points beneath its top.
6. Forecast
6.1 Night Session (6:00 PM ET Wednesday to 3:00 AM ET Thursday, Globex and Asia)
Globex reopened at 6:00 PM ET and the December contract was quoted at 30,067.75 on the provider's page at 6:25 PM ET, 115.00 points beneath the settle. A Federal Reserve vice chair speaks at 10:55 PM ET, as the calendar lists it, and the Taiwanese chipmaker reports at 2:00 AM ET on Thursday, as the calendar lists it. Bias neutral to lower beneath the 30,380 to 30,440 band, expected Globex band roughly 29,850 to 30,400.
6.2 London Session (3:00 AM to 8:00 AM ET Thursday)
UK output data are listed at 2:00 AM ET and euro-area industrial production at 5:00 AM ET, both per the news-feed calendar and unconfirmed. Bias neutral to lower, expected band roughly 29,800 to 30,450, with the 30,380 to 30,440 band the first meaningful resistance.
6.3 Morning Session (9:30 AM to 12:00 PM ET Thursday, RTH Open)
Producer prices and retail sales for September print at 8:30 AM ET, as the calendar lists them, before this window opens, and the cash open at 9:30 AM ET is the first directional test of the session. Weekly jobless claims are listed at 8:30 AM ET, per the news-feed calendar and unconfirmed, and business inventories are scheduled at 10:00 AM ET, as the calendar lists them. Expected band roughly 29,700 to 30,550.
6.4 Afternoon Session (12:00 PM to 4:00 PM ET Thursday)
The weekly petroleum status report is scheduled for 12:00 PM ET, as the calendar lists it, and the cash close is at 4:00 PM ET. A Federal Reserve bank president is listed at 4:30 PM ET, per the news-feed calendar and unconfirmed. Expected band roughly 29,650 to 30,650.
6.5 Night Session Forward (6:00 PM ET Thursday)
The Friday session opens at 6:00 PM ET Thursday. The Federal Reserve Chair's discussion with the International Monetary Fund's managing director is scheduled for 11:30 PM ET, as the calendar lists it. Import prices are scheduled for 8:30 AM ET on Friday, October 16, 2026, as the calendar lists them.
6.6 Expected Range (Thursday Full Session)
Low-range scenario: 29,824 to 30,541; Mid-range scenario (most likely): 29,676 to 30,690; High-range scenario: 29,562 to 30,804.
6.7 Most Likely Path
In this review's analyst judgment the most probable path holds the contract between two standard deviations support at 29,675.65 and two standard deviations resistance at 30,689.85, with producer prices, yields and the chipmaker's results deciding the side. A rally that fails beneath one standard deviation resistance at 30,541.32 is weighted above a sustained recovery, because Wednesday printed a lower high and a lower low, the settle sits beneath the 5-day through 50-day settlement averages, negative direction leads on the 9-day and 14-day directional systems, the composite fell to 8 percent sell with direction described as weakening and the cash index closed beneath the modeled gamma-flip level. The alternative that would invalidate this reading is a soft producer-price print or strong chipmaker results that carry the contract back above the 30,494.93 flip-level conversion toward Pivot R1 at 30,690.17.
7. Thursday Economic Calendar
Globex reopened at 6:00 PM ET on Wednesday. Japanese machinery orders are listed at 7:50 PM ET and Australian employment at 8:30 PM ET, both per the news-feed calendar and unconfirmed. A Federal Reserve vice chair speaks at 10:55 PM ET, as the calendar lists it.
On Thursday, the Taiwanese chipmaker reports at 2:00 AM ET, as the calendar lists it. UK output data are listed at 2:00 AM ET and euro-area industrial production at 5:00 AM ET, both per the news-feed calendar and unconfirmed. Producer prices and retail sales for September print at 8:30 AM ET, as the calendar lists them, with the news-feed calendar listing 0.6 percent for monthly producer prices and 0.3 percent for retail sales. Weekly jobless claims and the Philadelphia and New York manufacturing surveys are listed at 8:30 AM ET, per the news-feed calendar and unconfirmed. Business inventories are scheduled at 10:00 AM ET, as the calendar lists them. A Federal Reserve bank president is listed at 4:30 PM ET, per the news-feed calendar and unconfirmed, and the Federal Reserve Chair's discussion with the International Monetary Fund's managing director is scheduled at 11:30 PM ET, as the calendar lists it.
Later in the window, import prices are scheduled for 8:30 AM ET on Friday, October 16, 2026, and industrial production for 9:15 AM ET on Friday, October 16, 2026, both as the calendar lists them. The desk note lists monthly options expiration on Friday, per the positioning note and unconfirmed, and the volatility-index expiration on 10/21, per the positioning note and unconfirmed. A streaming company reports at about 4:01 PM ET on Tuesday, October 20, 2026, as the calendar lists it. In this review's judgment the first-order influence on the Nasdaq-100 on Thursday is the September producer price index at 8:30 AM ET, as the calendar lists it, together with the Taiwanese chipmaker's results at 2:00 AM ET, as the calendar lists it.
8. Primary Trade Setup
Direction: Short
Rationale: Wednesday printed a lower high and a lower low for a third consecutive lower settle, the settle sits beneath the 5-day through 50-day settlement averages, negative direction leads on the 9-day and 14-day directional systems, the composite fell to 8 percent sell with direction described as weakening, and the cash index closed beneath the modeled gamma-flip level with negative fund gamma; a rally into the 30,380 to 30,440 band of the Pivot Point at 30,384.08 and the 30,431.93 conversion of the put side support base offers a short with a defined risk point above one standard deviation resistance at 30,541.32. Both the 9-day and 14-day raw stochastics sit at 6.81 percent, the settle sits just beneath the 50-day average and the chipmaker's results and producer prices can move the index sharply, so the setup is an analyst judgment that the decline extends from a rally, not a measured edge.
Entry Zone: 30,380 to 30,440
Stop Loss: 30,580 (above one standard deviation resistance at 30,541.32 and the 30,566.37 relative strength midpoint projection)
Target 1 (T1): 30,240 (8.07 above the 30,231.93 conversion of the largest gamma concentration)
Target 2 (T2): 30,070 (8.00 beneath Wednesday's 30,078.00 low)
Target 3 (T3, extended): 29,900 (23.33 above Pivot S1 at 29,876.67)
Risk-to-Reward: Approximately 1:1 to T1, 1:2 to T2, 1:3 to T3
Invalidation: A settle above one standard deviation resistance at 30,541.32 negates the thesis. Short of that, the edge is removed by acceptance above the entry band and not by a touch, defined as two consecutive 30-minute closes above 30,440.
Macro override: A soft producer-price print that pulls yields lower, or strong results from the Taiwanese chipmaker that lift semiconductor shares, would invalidate the short in real time. In that scenario a move through the 30,580 stop removes the setup, and the 38.2 percent retracement at 30,637.24 and Pivot R1 at 30,690.17 become the references within one 14-day average true range of 470.55 points.
Sources and methodology
This outlook is built from our session review of the December E-mini Nasdaq-100 contract, the December ’26 contract, prepared after Wednesday's close on October 14, 2026 for the Thursday, October 15, 2026 session. Wednesday's open, high, low and settle come from the provider's daily settlement record for the December contract, the 2026-10-14 row, and match the chart's completed daily bar. Wednesday's completed extremes are also the inputs behind the published pivot ladder: Pivot R3 at 31,503.67 less Pivot S3 at 29,063.17, divided by three, and Pivot R2 at 31,197.58 less Pivot S2 at 29,570.58, divided by two, both return 813.50, and three times the 30,384.08 Pivot Point less the settle gives 60,969.49, 0.01 from the 60,969.50 of the solved pair of 30,891.50 and 30,078.00. The chart's 30-minute bars for the session, from the 6:00 PM ET Tuesday bar through the 4:30 PM ET Wednesday bar, reproduce the same extremes; they place the high in the 11:00 PM ET bar and the low in the 3:00 PM ET bar, and every timed statement about Wednesday in this article rests on them. Only those figures and the review's statements are used to grade Wednesday's card. Globex reopened at 6:00 PM ET Wednesday, so the day open, high and low on the provider's overview belong to the Thursday session.
The moving averages were computed from the provider's 259-session daily settlement series; the oscillators are cited as published for the Thursday session, read after the 6:00 PM ET reopen. Volume and open interest come from the provider's daily record: the 2026-10-14 row reads 731,907 contracts with open interest not yet reported, and the 2026-10-13 row now reads 532,591 contracts and open interest of 278,674, where Wednesday's outlook carried 529,213 for Tuesday. The 2026-10-12 row reads open interest of 281,129. The desk note used is the 5:20 PM ET Wednesday edition, with Tuesday's closes in its reference column; every Nasdaq futures equivalent is the review's conversion at the 231.93 point measured basis, the settlement against the 4:00 PM ET cash close, and Tuesday's 222.02 basis is the figure carried in Wednesday's outlook. The QQQ fund is a proxy read alongside the index levels, and the reading that dealer positioning does not dampen moves is the review's interpretation from that proxy; its console, marked as updated 2026-10-14, changed from the previous read, and its high and low volatility point fields are excluded as inverted. The dollar index percentage is computed. Scenario ranges are analyst judgment, and items marked unconfirmed come from the news-feed calendar, the news feed, the desk note or the positioning note.
Wednesday’s outlook for this contract is here, and the S&P 500 contract’s Wednesday outlook covers the index that fell 1.11 percent in cash on Wednesday. Outlooks for ES, NQ, GC and CL are collected on the market outlook page, and our forward trading record is on the performance statement.



