
At 8:30 AM ET on Wednesday the price-index report landed soft. Core prices rose 3.0 percent year on year against a 3.3 percent forecast, per the news-feed calendar. The December Nasdaq-100 contract's 8:30 AM ET bar, which contained the release, traded from 30,607.50 to 30,779.50. Three hours later the 11:30 AM ET bar printed the 30,906.00 session high. Then the last half hour sold off. It traded down 177.50 points from its high.
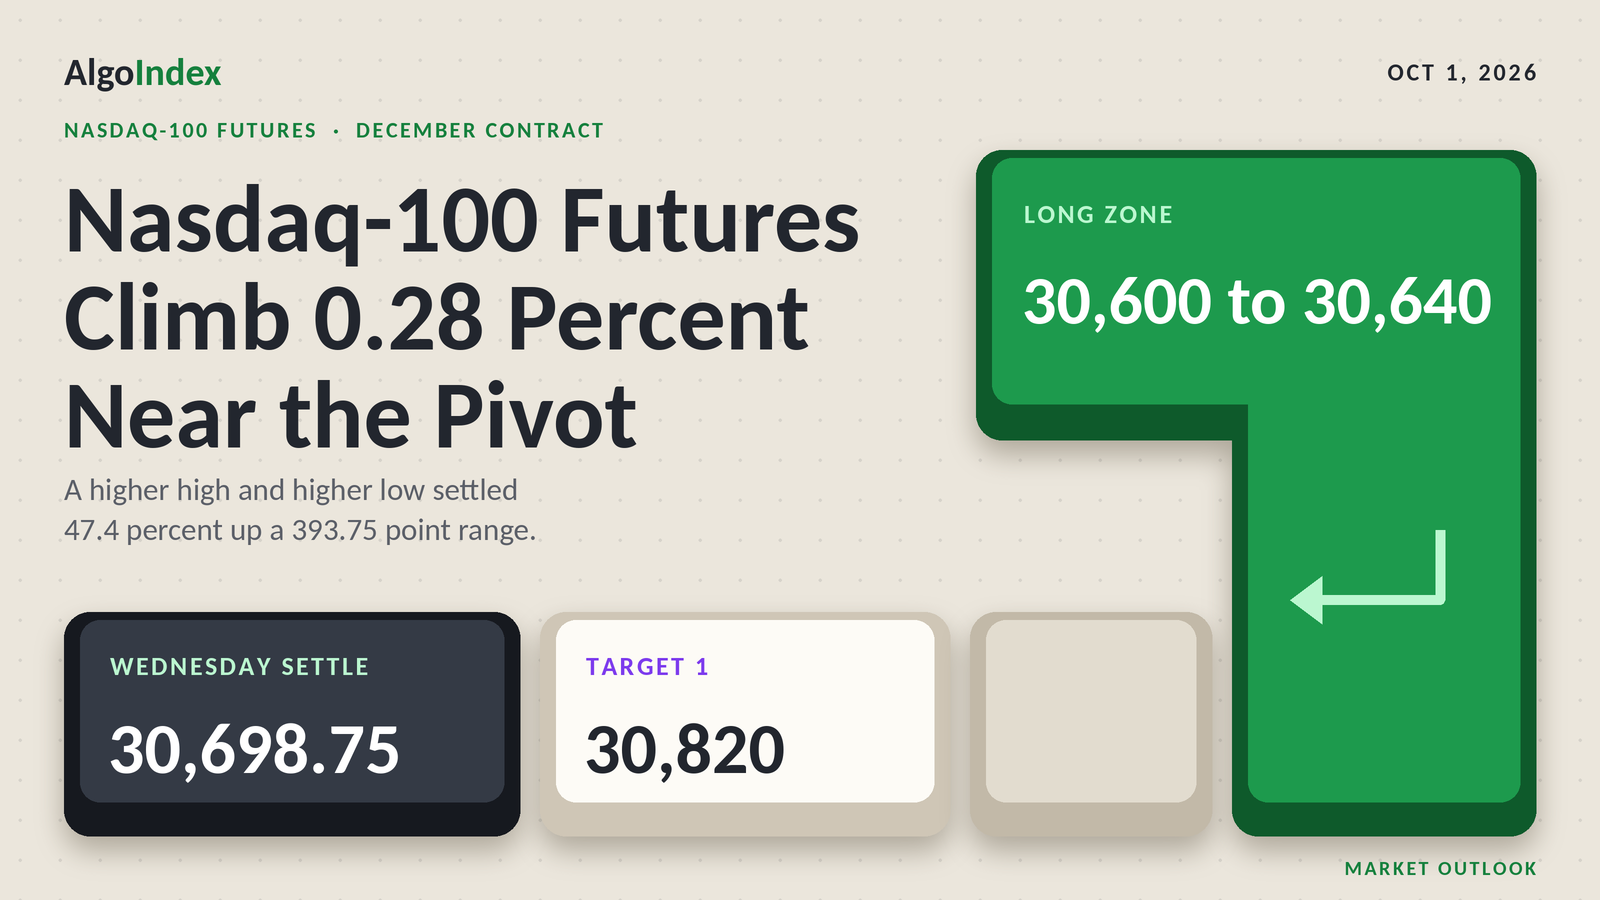
December Nasdaq-100 futures settled at 30,698.75, up 85.50 points or 0.28 percent from Tuesday's 30,613.25, after a 393.75 point range from 30,512.25 to 30,906.00. The settle sat at 47.4 percent of that range. It was the largest one-day gain since the 122.50 point advance of 09/25. The cash index closed at 30,408.50, up 0.23 percent, while the S&P 500 cash index fell 0.25 percent. Yields nevertheless closed higher, with the ten-year yield index at 5.29 percent, and provider commentary said stocks erased early gains as rising crude oil boosted inflation expectations.
December Nasdaq-100 futures settled at 30,698.75, up 85.50 points, at 47.4 percent of a 393.75 point range and 6.92 points beneath the Pivot Point at 30,705.67. Preliminary volume was 598,965 contracts, per the provider's daily record. Wednesday's open interest is not yet published. Tuesday's row reads 269,744. The composite multi-indicator read eased to 80 percent buy from 88 percent. The settle sits above the 9-day, 20-day, 50-day, 100-day and 200-day averages and beneath the 5-day. Overhead: the Pivot Point, the 30,706.85 5-day average and the 30,707.00 reopen, the 30,764.03 9-day crossing, the 30,790.25 gamma concentration, the 30,826.67 deviation band and the 30,879.65 to 30,920.31 group. Beneath: the 30,648.67 target price, the 30,636.50 post-settlement low, the 30,570.83 deviation band, the 30,517.85 to 30,505.33 group and the 30,477.19 band. The primary setup is a long from 30,600 to 30,640, stop 30,420, targets 30,820, 31,020 and 31,220. The first-order event is the 10:00 AM ET manufacturing survey, on the news-feed calendar and unconfirmed.
Wednesday settled 98.75 points above the 30,560 to 30,600 long band
Our Wednesday outlook set a long from 30,560 to 30,600 with a stop at 30,400 and targets at 30,760, 30,940 and 31,120. Wednesday's completed bar, on the provider's daily record, opened at 30,657.25, marked a high of 30,906.00 and a low of 30,512.25, and settled at 30,698.75. Tonight's review states the same open, high, low and settle. Price traded through the whole band. The low printed 47.75 points beneath its lower edge and stopped 112.25 points above the stop, which was never reached. The high ran 146.00 points through the 30,760 first target level and stopped 34.00 short of the 30,940 second target. The 31,120 extension stayed 214.00 points away.
The 30-minute series adds the order of the bars. The first bar to trade into the band was the 10:00 PM ET bar, whose low of 30,597.25 sat 2.75 points inside its upper edge. The 2:30 AM ET bar reached 30,539.75, 20.25 points beneath the band. The 30,512.25 low came later, in the 7:00 AM ET bar. The 8:30 AM ET bar was the first to trade above 30,760, reaching 30,779.50, and the 30,906.00 high followed in the 11:30 AM ET bar. Bars show sequence only. No fill and no result is asserted here. Settlement landed at 30,698.75, 98.75 points above the band's upper edge.
We weighted a Wednesday settle between 30,482.99 and 30,768.42 over a settle outside that band. Wednesday settled at 30,698.75, inside it and 69.67 points beneath its top. The overnight sketch held only in part. We had the Globex session holding above the 30,570.33 Pivot Point. The 10:30 PM ET bar's low of 30,571.00 sat 0.67 above it, and then the 2:30 AM ET bar traded 30.58 points beneath it. The expected Globex band of 30,480 to 30,760 contained the whole overnight session, which ran from 30,539.75 to the 30,737.00 high of the 8:00 PM ET bar.
Neither invalidation test triggered. The settle finished 283.58 points above the 30,415.17 Pivot S1 threshold, and the low stayed 29.26 points above 30,482.99, so no 30-minute close could fall beneath it. The macro override named a firm price-index print that lifts the ten-year yield above Tuesday's 5.29 percent session high. The print was soft. Core prices rose 3.0 percent against a 3.3 percent forecast, so that condition was not met, though the ten-year still closed at 5.29 percent. We grade the card as written.
A higher high, a higher low and a 177.50 point final half hour
Wednesday opened at 30,657.25 at the Tuesday 6:00 PM ET reopen, 44.00 points above Tuesday's settle. Asian hours reached 30,737.00 in the 8:00 PM ET bar and then eased. The 10:30 PM ET bar dipped to 30,571.00, and the 2:30 AM ET bar to 30,539.75. Europe leaned lower still. The 6:00 AM ET bar traded down to 30,572.00, and the 7:00 AM ET bar printed the 30,512.25 low before closing at 30,576.00. The session made its low first.
Then came the data. The 8:30 AM ET bar, which contained the personal income and outlays report, opened at 30,623.25, traded between 30,607.50 and 30,779.50 and closed at 30,714.25. Buyers pressed on at the cash open. The 9:30 AM ET bar ran from 30,683.00 to 30,843.75 and closed at 30,841.25, and the 11:30 AM ET bar printed the 30,906.00 high. From the 12:00 PM ET bar through the 3:00 PM ET bar, every print held between 30,760.50 and 30,896.75.
The final half hour gave much of it back. The 3:30 PM ET bar opened at 30,833.25, reached 30,858.25 and slid to 30,680.75, closing at 30,692.25. A news-feed market wrap described equities giving back gains in the final hour. Settlement followed at 30,698.75 at 4:00 PM ET. After the settle the 4:00 PM ET bar traded between 30,636.50 and 30,746.75, and the 4:30 PM ET bar closed at 30,725.75. The preserved provider series holds 46 bars from the reopen through that bar. The settle finished 41.50 points above the open, 207.25 beneath the high and 186.50 above the low.
Those extremes also come from the ladder. They are the completed-session inputs behind the published pivot ladder, back-solved from the outer pivot pairs and verified against every rung. The third resistance point at 31,292.83 minus the third support point at 30,111.58, divided by three, returns 393.75. The second pair, 31,099.42 and 30,311.92, divided by two, returns the same 393.75. Three times the Pivot Point, carried at its unrounded 30,705.667, less the settle gives a high plus low sum of 61,418.25. The pair of 30,906.00 and 30,512.25 reproduces all seven rungs. The chart's completed Wednesday bar reads 30,657.25, 30,906.00, 30,512.25 and 30,698.75.
Against Tuesday the bar stepped up at both ends. The high is 180.50 points above Tuesday's 30,725.50, and the low 140.25 above Tuesday's 30,372.00 on the provider's daily row. Travel widened a little. The 393.75 point range was 0.84 times the published 14-day average daily range of 466.48 points, against 353.50 on Tuesday. Preliminary volume rose to 598,965 contracts from 585,162 on Tuesday, per the provider's daily record. Tuesday's row now carries open interest of 269,744, the figure the provider's overview also shows, and Wednesday's is not yet published.
Last week still frames the move. The prior week, September 21 through September 25, spanned 31,094.75 to 29,904.00, and Wednesday traded inside it. Across five sessions the contract lost 66.00 points, or 0.21 percent, from the 30,764.75 settle of 09/23. The 13-week and one-month high of 31,094.75 sits 396.00 points above the settle, and the one-month low of 29,053.00 sits 1,645.75 points beneath. No prior-quarter high or low was captured, so the 13-week extremes serve as the available quarterly reference. Wednesday was the last session of the third quarter. The 52-week high on the December contract stands at 31,336, 637.25 points above the settle.
Settlements map the swing. The sequence from 09/18 reads 29,917.25, 30,784.75, 31,028.50, 30,764.75, 30,766.75, 30,889.25, 30,566.25, 30,613.25 and 30,698.75. Since the 31,028.50 settle of 09/22 the contract has held a 30,566.25 to 30,889.25 settlement band for six sessions. Wednesday's settle sits in its lower half. Daily ranges for the last seven sessions ran 395.50, 452.00, 457.50, 320.50, 564.00, 353.50 and 393.75. The retracement grid published for Thursday places the 38.2 percent retracement from the four-week high at 30,314.80 and the 50 percent retracement of the four-week range at 30,073.88, both beneath the settle. No four-hour series was captured, and the 30-minute series is the only intraday evidence used.
Averages still lean up. Computed from the provider's daily settlement series for the December contract, 259 completed sessions through Wednesday, the 5-day stands at 30,706.85, the 9-day at 30,669.94, the 20-day at 30,078.39, the 50-day at 29,742.68, the 100-day at 29,950.54 and the 200-day at 28,025.76. Only the 5-day sits overhead. The settle is 8.10 points beneath it, 28.81 above the 9-day, 620.36 above the 20-day, 956.08 above the 50-day and 748.21 above the 100-day.
Window arithmetic explains the jumps. The 9-day rose 106.19 points from Tuesday's 30,563.75 as the 09/17 settle of 29,743.00 left its window, and the 20-day rose 64.11 points from 30,014.28 as the 09/01 settle of 29,416.50 left. The 5-day fell 13.20 points from 30,720.05 as the 09/23 settle of 30,764.75 left. The 100-day sits above the 50-day because the older 50 of the last 100 settles averaged 30,158.41, higher than the latest 50. Crossing prices come next. The projection grid gives the prices at which each average would be crossed on Thursday: 30,764.03 for the 9-day, 30,141.85 for the 18-day and 29,984.62 for the 40-day.
Momentum firmed. The oscillator figures are as published on the provider's technical page dated for the Thursday session, read after the 6:00 PM ET reopen, so the most recent value in each may include live Globex trade after the settle. Relative strength reads 61.77 on the 9-day, 59.74 on the 14-day and 57.59 on the 20-day. Stochastics sit in the upper part of their range. The 14-day raw stochastic reads 80.60 percent, with %K at 77.05 percent beneath %D at 79.95 percent.
Direction reads positive above negative. On the 9-day the directional index reads 23.41, with positive direction at 27.12 and negative at 17.59; on the 14-day it reads 16.18, with positive direction at 25.66 against negative at 18.64. Historic volatility reads 16.58 percent on the 9-day and 16.06 percent on the 14-day. The composite multi-indicator read published for Thursday is 80 percent buy, down from 88 percent in the prior session's snapshot, with signal strength described as weak and direction as strengthening. A week ago it read 72 percent buy. A month ago, 24 percent. The short-horizon group averages 80 percent buy, the medium-horizon group 100 percent and the long-horizon group 33 percent.
Volatility frames Thursday. The published 14-day average true range stands at 454.71 points, 1.48 percent of the settle, and the 14-day average daily range at 466.48; the 9-day figures are 446.63 and 471.19, and the 20-day figures 471.14 and 433.48. One 14-day average true range either side of the settle spans 30,244.04 to 31,153.46. The published standard-deviation bands, built from five settlements, sit well inside it. One deviation spans 30,570.83 to 30,826.67, two span 30,517.85 to 30,879.65 and three span 30,477.19 to 30,920.31. Those bands describe settlement dispersion only.
A soft price-index print, a 5.29 percent ten-year and a memory-chip beat
The data came in soft. The calendar lists the personal income and outlays report at 8:30 AM ET on September 30, 2026. Core prices rose 3.0 percent year on year against a 3.3 percent forecast and 0.2 percent month on month against 0.3 percent, per the news-feed calendar. The priced probability of an October rate increase fell after the report: the news feed's premium desk put it at 34.9 percent from 44.8 percent at 11:20 AM ET, and provider commentary gave 37 percent from 52 percent on Tuesday. The two sources disagree. Neither is used as a level input.
Yields climbed anyway. The ten-year yield index closed at 5.29 percent, which provider commentary described as a 19-year high, and the thirty-year yield index closed at 5.64 percent. Provider commentary said stocks erased early gains as rising crude oil boosted inflation expectations. November crude settled at 90.42, up 1.16 percent. The dollar index closed at 101.45. No real-yield series was captured.
The broad market lagged. The S&P 500 cash index closed at 7,651.54, down 0.25 percent, and provider commentary said the Dow industrials fell 0.86 percent to a three-and-a-half-month low. Against that, the Nasdaq-100's 0.23 percent gain was a relative outperformance. The volatility index closed at 16.34, up 0.30 points, and the volatility-of-volatility index at 89.48. The technology fund closed at 739.77, up 0.25 percent, per the provider's daily record.
Chips stood still. The semiconductor index closed at 12,628.62, essentially unchanged from Tuesday's 12,629.16, so the cash session did not price the memory-chip maker's results. Those came after the close, with the call at 4:30 PM ET, which the calendar lists. Per the news feed, the company reported adjusted earnings of 33.42 dollars a share against a 31.83 dollar estimate, revenue of 54.23 billion dollars against 51.49 billion and an adjusted gross margin of 87 percent against 86.2 percent. Prepared remarks carried at 4:18 PM ET said memory and storage supply conditions are expected to be much tighter in fiscal 2027 and 2028 than in 2026.
Other technology headlines landed late. A large internet-search company introduced a new artificial-intelligence model after the close, with news-feed items between 4:04 PM and 4:07 PM ET giving pricing of 2 dollars per million input tokens and 10 dollars per million output tokens. An earlier news-feed item at 3:53 PM ET carried a report of internal skepticism about the model's performance. The President's technology adviser said at 4:22 PM ET that artificial-intelligence firms had agreed to external reviews. None of these items coincided with a measured move in the settle window. The reaction is not yet captured.
Provider commentary on crude said the maritime security agency reported three tankers struck in the Strait of Hormuz on Tuesday. Around the cash close, a press report carried on the news feed at 3:58 PM ET said a pilot had planned to seize control of an aircraft over Jordan and crash it in Israeli territory. At 4:59 PM ET the President said he had spoken to the Israeli prime minister about the incident. The equity reaction to these items is not captured beyond the post-settlement bars.
Positioning levels come from two surfaces, the technology fund and the cash index, used here as the proxy for the positioning dataset available. They reach futures only through the measured basis of 290.25 points, Wednesday's 30,698.75 settlement less the 30,408.50 cash close, both at 4:00 PM ET. No positioning report for the contract was captured, so none is asserted.
The desk note used is the 5:20 PM ET edition for Wednesday. Its reference prices are the prior session's closes. The cash index reference of 30,339 equals Tuesday's 30,339.33 cash close, and the fund reference of 737 equals Tuesday's 737.93. Every level is therefore read against Wednesday's closes, 30,408.50 for the cash index and 739.77 for the fund.
On the cash index the largest gamma concentration sits at 30,500, 91.50 points above the cash close. The modeled gamma-flip level at 29,810 and the modeled volatility threshold at 29,450 both sit well beneath it, and the primary put-side support base is 28,000. The key strikes are 30,500, 29,475, 30,000 and 31,000, and the combination levels 30,006, 30,248, 30,430 and 31,250. Gamma tilt reads 1.429 with a gamma notional of 9.814 million dollars, close to flat, and the 25-delta risk reversal reads minus 0.043. One oddity repeats. The call-side ceiling field reads 29,475, beneath both the close and the modeled gamma-flip level, so it is excluded from the level structure.
The fund reads differently. Its largest gamma concentration and primary put-side base both sit at 730, the modeled gamma-flip level at 736 and the modeled volatility threshold at 737, with the call-side ceiling at 760. The fund closed at 739.77, above the 736 to 737 pair. Gamma tilt reads 0.887 and the gamma notional minus 264.177 million dollars, so the proxy's dealers carry a net short gamma position, and the 25-delta risk reversal reads minus 0.028. Put volume of 1.314 million contracts exceeded call volume of 1.036 million. The fund console dated 2026-09-30 attributes 36.28 percent of the fund's gamma to the nearest expiration. Its high and low volatility point fields are treated as low confidence and excluded.
Flows were quiet. The desk note said the real-time hedging flow data for the Nasdaq-100 was relatively flat on the day while the negative reading was concentrated on the S&P 500 index side, which it attributed to likely end-of-quarter rebalancing rather than a bearish view. Sectors split. It reported software up 1.2 percent, the largest technology names up 0.4 percent, semiconductors up 0.2 percent and memory names down 1.5 percent. The note described the memory-chip maker as flat after its results. It sat within its implied move, with the stock's main gamma and delta strike at 1,000.
At the measured closing basis, cash 30,500 corresponds to 30,790.25 on the December contract, the modeled gamma-flip level at 29,810 to 30,100.25 and the modeled volatility threshold at 29,450 to 29,740.25. These are conversions made by this review. The source publishes no Nasdaq futures pair, and the modeled thresholds are not listed strikes. In this review's interpretation, the contract above 30,100.25 sits in a positive-gamma environment on the index and beneath the 30,790.25 concentration, which tends to dampen moves between them, while the proxy's net short gamma leaves room for larger moves if the fund breaks beneath 736.
The trade map for Thursday
The primary setup is a long from 30,600 to 30,640, a pullback into the zone above one standard deviation support at 30,570.83 and beneath the 30,648.67 target price. The case rests on the bar. Wednesday made a higher high and a higher low, settled above the 9-day, 20-day, 50-day and 100-day settlement averages, and the composite read holds at 80 percent buy with positive direction above negative direction. The stop at 30,420 sits beneath Pivot S1 at 30,505.33, the 30,512.25 session low and three standard deviations support at 30,477.19. The final-hour selling and a ten-year yield at 5.29 percent argue against chasing strength. So the setup is an analyst judgment against a rising-yield backdrop. The 14-day average true range of 454.71 points compares with a 200 point stop distance from the 30,620 midpoint.
Overhead the references start at the pivot. The Pivot Point at 30,705.67 sits 6.92 points above the settle, with the 5-day settlement average at 30,706.85 1.18 points beyond it and the 30,707.00 reopen just above both. The 9-day average crossing at 30,764.03 comes next. The cash desk note's 30,500 concentration translates to 30,790.25 in futures at the 290.25 point basis, beneath one standard deviation resistance at 30,826.67. Two standard deviations resistance at 30,879.65 and the 3-10-16 day projection stall at 30,885.71 sit 6.06 points apart. Pivot R1 at 30,899.08 sits 6.92 points beneath Wednesday's 30,906.00 high, and three standard deviations resistance at 30,920.31 sits above both. The 13-week and one-month high of 31,094.75 and Pivot R2 at 31,099.42 sit 4.67 points apart, with Pivot R3 at 31,292.83 and the 31,336 52-week high as the extended references.
Support starts just beneath the settle. The published target price at 30,648.67 and the 30,636.50 post-settlement low in the 4:00 PM ET bar come first. One standard deviation support at 30,570.83, two standard deviations support at 30,517.85, Wednesday's 30,512.25 low in the 7:00 AM ET bar and Pivot S1 at 30,505.33 form a 65.50 point group. Three standard deviations support at 30,477.19 sits beneath it. Lower down, the 38.2 percent retracement at 30,314.80 and Pivot S2 at 30,311.92 sit 2.88 points apart. The 18-day average crossing at 30,141.85, Pivot S3 at 30,111.58, the gamma-flip conversion at 30,100.25 and the 20-day settlement average at 30,078.39 are the deeper references.
Globex has reopened. The Thursday session opened at 30,707.00 at 6:00 PM ET, 8.25 points above the settle and 1.33 points above the Pivot Point, with the memory-chip maker's results in hand. The provider's overview showed a high of 30,740.50 and a low of 30,684.50 for the new session at the time of reading. None of those values is used as Wednesday's range. The Japanese central bank's quarterly business survey is listed at 7:50 PM ET and Japanese manufacturing survey data at 8:30 PM ET, both on the news-feed calendar and unconfirmed. Bias reads constructive above 30,648.67, with an expected Globex band of roughly 30,600 to 30,840. The reaction in Asian memory names is the first input.
Europe comes next. Swiss consumer prices at 2:30 AM ET, final manufacturing surveys for Germany at 3:55 AM ET and the euro area at 4:00 AM ET and the United Kingdom survey at 4:30 AM ET are all listed on the news-feed calendar and unconfirmed. Wednesday's European morning drifted to the session low, per the 30-minute series, so a hold above 30,570.83 in this window would mark a change in character. Bias reads neutral to constructive, with an expected band of roughly 30,560 to 30,860.
Then the data. The calendar lists a large consulting firm's results call at 8:00 AM ET. Weekly jobless claims are listed at 8:30 AM ET, forecast 200,000 against 197,000, on the news-feed calendar and unconfirmed. The cash open at 9:30 AM ET sets the first directional test. The manufacturing survey from the purchasing managers' institute is listed at 10:00 AM ET, forecast 55 against 54.6, on the news-feed calendar and unconfirmed, and the calendar lists construction spending and a Federal Reserve governor at the same time. Acceptance above 30,899.08 opens 31,094.75. A loss of 30,512.25 returns the contract to 30,314.80. The morning band runs roughly 30,520 to 30,960.
Speakers fill the afternoon. The calendar lists the Federal Reserve vice chair at 1:30 PM ET, the vice chair for supervision at 3:00 PM ET and a Federal Reserve governor at 3:30 PM ET. Wednesday's final half hour traded down 177.50 points from its high, per the 30-minute series, so the close is the window to test for a repeat. The afternoon band runs roughly 30,540 to 30,940 into the 4:00 PM ET settle.
Earnings and jobs close the week. An athletic-apparel maker's results follow the equity close at about 4:15 PM ET, which the calendar lists, and the calendar lists the employment report at 8:30 AM ET on October 2, 2026, so Thursday's night session carries positioning into Friday's release. For Thursday the review singles out one first-order event: the 10:00 AM ET manufacturing survey, on the news-feed calendar and unconfirmed, read through the yield response, with the overnight reaction to the memory-chip maker's results the first input before it.
Scenario bands overlap heavily. Across the full session the low-range case runs 30,560 to 30,860, the mid-range and most likely case 30,480 to 30,960 and the high-range case 30,300 to 31,100. All three nest. In this review's analyst judgment the most probable path holds the Globex session above the 30,648.67 target price as the memory-chip maker's results are digested, with a pullback toward the 30,570.83 to 30,640 area during the European hours. In the same judgment the 10:00 AM ET manufacturing survey, on the news-feed calendar and unconfirmed, and the yield response decide through the United States morning whether the contract returns to the 30,899.08 to 30,920.31 group. A settle between 30,570.83 and 30,920.31 is weighted above a settle outside that band, on three grounds. The composite read holds at 80 percent buy. The settle sits above the 9-day, 20-day, 50-day and 100-day averages. The range contracted. A yield breakout above Wednesday's close that repeats the final-hour selling and takes the contract through the 30,512.25 low would invalidate this reading.
Thursday opens 1.33 points above its pivot, with the chip results already in hand.
The complete data picture
Every number behind Thursday’s plan, charted first, then the full level map, then the complete numeric reference underneath.
Cash-index levels at the measured 290.25 point basis: the 30,500 gamma concentration translates to 30,790.25 in futures, the 29,810 modeled gamma flip to 30,100.25 and the 29,450 modeled volatility threshold to 29,740.25. No other cash level is translated.
Full numeric reference, every remaining figure from the session review
3.1 Resistance, level by level
The first overhead reference is the Pivot Point at 30,705.67, 6.92 points above the settle, with the 5-day settlement average at 30,706.85 1.18 points beyond it. The 9-day average crossing at 30,764.03 and one standard deviation resistance at 30,826.67 come next, then the 3-10-16 day projection stall at 30,885.71 and two standard deviations resistance at 30,879.65, 6.06 points apart.
Pivot R1 at 30,899.08 sits 6.92 points beneath Wednesday's 30,906.00 high, and three standard deviations resistance at 30,920.31 sits above both. Beyond that, the 13-week and one-month high of 31,094.75 and Pivot R2 at 31,099.42 sit 4.67 points apart, with Pivot R3 at 31,292.83 and the 52-week high of 31,336 on the December contract as the extended references.
3.2 Support, level by level
The published target price at 30,648.67 and the 30,636.50 post-settlement low in the 4:00 PM ET bar sit directly beneath the settle. One standard deviation support at 30,570.83, two standard deviations support at 30,517.85, Wednesday's 30,512.25 low in the 7:00 AM ET bar and Pivot S1 at 30,505.33 form a 65.50 point group beneath that.
Beneath that group, three standard deviations support at 30,477.19 comes first, then the 38.2 percent retracement from the four-week high at 30,314.80 and Pivot S2 at 30,311.92, 2.88 points apart. The 18-day average crossing at 30,141.85, Pivot S3 at 30,111.58 and the 20-day settlement average at 30,078.39 are the deeper references.
1. Executive Summary
The December Nasdaq-100 contract settled at 30,698.75 on Wednesday, up 85.50 points or 0.28 percent from Tuesday's 30,613.25 settle, after trading between 30,906.00 and 30,512.25, a 393.75 point daily range. The settle finished at 47.4 percent of the range, and the 393.75 point range was 0.84 times the published 14-day average daily range of 466.48 points. It was the largest one-day gain since the 122.50 point advance of 09/25, and the Nasdaq-100 cash index closed at 30,408.50, up 0.23 percent, while the S&P 500 cash index fell 0.25 percent.
The preserved 30-minute series fixes the order. The contract reopened Tuesday evening at 30,657.25 and printed the 30,512.25 daily low in the 7:00 AM ET bar. The 8:30 AM ET bar, which contained the personal income and outlays report released at 8:30 AM ET on September 30, 2026, as the calendar lists it, traded from 30,607.50 to 30,779.50. The 9:30 AM ET bar at the cash open reached 30,843.75. The 30,906.00 high printed in the 11:30 AM ET bar, and the 3:30 PM ET bar, the final half hour of the cash session, traded down from 30,858.25 to 30,680.75 and closed at 30,692.25. The settle at 30,698.75 followed at 4:00 PM ET.
The price-index report was softer than forecast, with core prices up 3.0 percent year on year against a 3.3 percent forecast, per the news-feed calendar, and the priced chance of an October rate increase fell. Yields nevertheless closed higher, with the ten-year yield index at 5.29 percent, and provider commentary said stocks erased early gains as rising crude oil boosted inflation expectations. A news-feed market wrap described equities giving back gains in the final hour. After the close, the memory-chip maker reported adjusted earnings of 33.42 dollars a share against a 31.83 dollar estimate and revenue of 54.23 billion dollars against 51.49 billion, per the news feed, and said memory supply conditions would be tighter in fiscal 2027 and 2028 than in 2026.
The published 14-day average true range stands at 454.71 points, 1.48 percent of the settle. The dealer-positioning dataset was read from the 5:20 PM ET desk note and the QQQ proxy later in the evening; section 5 places the largest Nasdaq-100 gamma concentration at NDX 30,500, above the cash close, and the modeled gamma-flip level at NDX 29,810, beneath it. The Primary Setup below is a long from the 30,600 to 30,640 zone above one standard deviation support, stopped beneath Pivot S1 at 30,505.33 and the session low, with objectives at 30,820, 31,020 and an extended 31,220.
2.1 Intraday and Session Review
The Wednesday session opened at 30,657.25 at the Tuesday 6:00 PM ET reopen, 44.00 points above Tuesday's settle, marked a daily high of 30,906.00 and a daily low of 30,512.25, and settled at 30,698.75 at 4:00 PM ET. The preserved 30-minute provider series, 46 bars from the reopen through the 4:30 PM ET bar, places the low in the 7:00 AM ET bar and the high in the 11:30 AM ET bar, so the session made its low first.
The Asian hours reached 30,737.00 in the 8:00 PM ET bar and then eased, with the 10:30 PM ET bar at 30,571.00 and the 2:30 AM ET bar at 30,539.75. The European morning drifted lower: the 6:00 AM ET bar traded down to 30,572.00 and the 7:00 AM ET bar printed the 30,512.25 low before closing at 30,576.00.
The 8:30 AM ET bar, which contained the price-index release, opened at 30,623.25, traded between 30,607.50 and 30,779.50 and closed at 30,714.25. The 9:30 AM ET bar at the cash open traded from 30,683.00 to 30,843.75 and closed at 30,841.25, and the 11:30 AM ET bar printed the 30,906.00 high. The bars from 12:00 PM ET through 3:00 PM ET held between 30,760.50 and 30,896.75. The 3:30 PM ET bar opened at 30,833.25, reached 30,858.25 and then traded down to 30,680.75, closing at 30,692.25 ahead of the 4:00 PM ET settlement at 30,698.75. After the settle, the 4:00 PM ET bar traded between 30,636.50 and 30,746.75 and the 4:30 PM ET bar closed at 30,725.75. The Thursday session reopened at 30,707.00.
The session extremes used here are the completed-session inputs behind the published pivot ladder and were not read independently from a bar, back-solved from the outer pivot pairs and verified against every rung. The third resistance point at 31,292.83 minus the third support point at 30,111.58, divided by three, returns 393.75, and the second resistance point at 31,099.42 minus the second support point at 30,311.92, divided by two, returns the same 393.75. Three times the Pivot Point, carried at its unrounded 30,705.667, less the 30,698.75 settle gives a high plus low sum of 61,418.25, and the resulting pair of 30,906.00 and 30,512.25 reproduces all seven published rungs. The chart's completed Wednesday daily bar reads 30,657.25, 30,906.00, 30,512.25 and 30,698.75, an independent confirmation of the same values.
Because Globex reopened at 6:00 PM ET, the provider's overview page now shows the Thursday session: its open of 30,707.00, high of 30,740.50 and low of 30,684.50 belong to the new session and are not used as Wednesday's range anywhere in this review.
2.2 Daily Structure
Wednesday printed a higher high and a higher low against Tuesday, whose high was 30,725.50, and recovered the Tuesday settle within the first bar. The settle sits 6.92 points beneath the Pivot Point at 30,705.67 published for Thursday, so the contract finished almost exactly at the ladder's center.
The prior week, September 21 through September 25, spanned 31,094.75 to 29,904.00, and Wednesday traded inside it. The 52-week high on the December contract, 31,336, sits 637.25 points above the settle, and the 13-week and one-month high of 31,094.75 sits 396.00 points above it. The one-month low of 29,053.00 sits 1,645.75 points beneath. Across five sessions the contract lost 66.00 points or 0.21 percent from the 30,764.75 settle of 09/23.
No prior-quarter high or low was captured, so the 13-week extremes serve as the available quarterly reference. Wednesday is the last session of the third quarter.
2.3 4-Hour and Swing Structure
The daily settlement sequence from 09/18 reads 29,917.25, 30,784.75, 31,028.50, 30,764.75, 30,766.75, 30,889.25, 30,566.25, 30,613.25 and 30,698.75. After the 31,028.50 settle of 09/22 the contract has held a 30,566.25 to 30,889.25 settlement band for six sessions, and Wednesday's settle sits in its lower half. Daily ranges for the last seven sessions ran 395.50, 452.00, 457.50, 320.50, 564.00, 353.50 and 393.75.
The retracement grid published for Thursday places the 38.2 percent retracement from the four-week high at 30,314.80 and the 50 percent retracement of the four-week range at 30,073.88, both beneath the settle. No four-hour series was captured; the 30-minute series in section 2.1 is the only intraday evidence used.
2.4 Moving Averages
The averages cited in this subsection were computed from the provider's daily settlement series for the December contract, which holds 259 completed sessions through Wednesday. The 5-day average stands at 30,706.85, the 9-day at 30,669.94, the 20-day at 30,078.39, the 50-day at 29,742.68, the 100-day at 29,950.54 and the 200-day at 28,025.76.
The 30,698.75 settle sits 8.10 points beneath the 5-day average and 28.81 points above the 9-day, 620.36 above the 20-day, 956.08 above the 50-day and 748.21 above the 100-day. The 9-day average rose 106.19 points from Tuesday's 30,563.75 as the 09/17 settle of 29,743.00 left the window, and the 20-day rose 64.11 points from 30,014.28 as the 09/01 settle of 29,416.50 left. The 5-day fell 13.20 points from 30,720.05 as the 09/23 settle of 30,764.75 left.
The 100-day average sits above the 50-day because the older 50 of the last 100 settles averaged 30,158.41, higher than the 29,742.68 average of the most recent 50. The projection grid gives the prices at which each average would be crossed on Thursday: 30,764.03 for the 9-day, 30,141.85 for the 18-day and 29,984.62 for the 40-day.
2.5 Oscillator and Trend Readings
The oscillator figures below are as published on the provider's technical page dated for the Thursday session, which was read after the 6:00 PM ET reopen, so the most recent value in each may include live Globex trade after the settle. Relative strength reads 61.77 on the 9-day, 59.74 on the 14-day and 57.59 on the 20-day.
Stochastics sit in the upper part of their range: the 14-day raw stochastic reads 80.60 percent, with the 14-day %K at 77.05 percent and %D at 79.95 percent. The directional system reads positive direction above negative direction. On the 9-day the directional index reads 23.41 with positive direction at 27.12 and negative direction at 17.59; on the 14-day it reads 16.18 with positive direction at 25.66 over negative at 18.64. Historic volatility reads 16.58 percent on the 9-day and 16.06 percent on the 14-day.
The composite multi-indicator read published for Thursday is 80 percent buy, down from 88 percent buy in the prior session's snapshot, with signal strength described as weak and direction as strengthening. The snapshot history reads 72 percent buy a week ago and 24 percent buy a month ago. The short-horizon group averages 80 percent buy, the medium-horizon group 100 percent buy and the long-horizon group 33 percent buy.
2.6 Volatility and Expected Range
The published 14-day average true range stands at 454.71 points and the 14-day average daily range at 466.48 points; the 9-day figures are 446.63 and 471.19, and the 20-day figures 471.14 and 433.48. Wednesday's 393.75 point range was 0.84 times the 14-day average daily range.
A one-range projection using the 14-day average true range of 454.71 points, applied to the 30,698.75 settle, frames Thursday between 30,244.04 and 31,153.46. The published standard-deviation bands are built from five settlements: one deviation spans 30,570.83 to 30,826.67, two spans 30,517.85 to 30,879.65 and three spans 30,477.19 to 30,920.31. These bands describe settlement dispersion, not intraday reach.
4.1 Mag7 Earnings and AI Capex Cycle
A large internet-search company introduced a new artificial-intelligence model after the close, with news-feed items between 4:04 PM and 4:07 PM ET giving pricing of 2 dollars per million input tokens and 10 dollars per million output tokens; an earlier news-feed item at 3:53 PM ET carried a report of internal skepticism about the model's performance. The President's technology adviser said at 4:22 PM ET that artificial-intelligence firms had agreed to external reviews. None of these items coincided with a measured move in the settle window, and the reaction to them is not yet captured.
4.2 Semiconductor Cycle and Tech Sector Rotation
The memory-chip maker's fiscal fourth-quarter results were released after the close, with the call at 4:30 PM ET, which the calendar lists: adjusted earnings of 33.42 dollars a share against a 31.83 dollar estimate, revenue of 54.23 billion dollars against 51.49 billion, and an adjusted gross margin of 87 percent against 86.2 percent, per the news feed. Prepared remarks carried at 4:18 PM ET said memory and storage supply conditions are expected to be much tighter in fiscal 2027 and 2028 than in 2026. The semiconductor index closed at 12,628.62, essentially unchanged from Tuesday's 12,629.16, so the cash session did not price the results.
4.3 Fed Policy and Real Yields (Duration Sensitivity)
The personal income and outlays report was released at 8:30 AM ET on September 30, 2026, as the calendar lists it. Core prices rose 3.0 percent year on year against a 3.3 percent forecast and 0.2 percent month on month against 0.3 percent, per the news-feed calendar. The priced probability of an October rate increase fell after the report: the news feed's premium desk put it at 34.9 percent from 44.8 percent at 11:20 AM ET, and provider commentary gave 37 percent from 52 percent on Tuesday. The two sources disagree and neither is used as a level input. The ten-year yield index still closed at 5.29 percent, which provider commentary described as a 19-year high. The thirty-year yield index closed at 5.64 percent. No real-yield series was captured.
4.4 Geopolitical Backdrop
Provider commentary on crude said the maritime security agency reported three tankers struck in the Strait of Hormuz on Tuesday. Around the cash close, a press report carried on the news feed at 3:58 PM ET said a pilot had planned to seize control of an aircraft over Jordan and crash it in Israeli territory, and at 4:59 PM ET the President said he had spoken to the Israeli prime minister about the incident. The equity reaction to these items is not captured beyond the post-settlement bars in section 2.1.
4.5 Cross-Asset and Volatility
The S&P 500 cash index closed at 7,651.54, down 0.25 percent, and provider commentary said the Dow industrials fell 0.86 percent to a three-and-a-half-month low, so the Nasdaq-100's 0.23 percent gain was a relative outperformance. The volatility index closed at 16.34, up 0.30 points, and the volatility-of-volatility index at 89.48. The dollar index closed at 101.45. November crude settled at 90.42, up 1.16 percent. The QQQ fund closed at 739.77, up 0.25 percent, per the provider's daily record.
4.6 Institutional Positioning
The measured futures basis at the close was 290.25 points, the 30,698.75 settlement at 4:00 PM ET less the 30,408.50 cash close at 4:00 PM ET, both from the provider's daily records. No positioning report for the contract was captured. The provider's overview shows open interest on the December contract at 269,744; the daily row for Wednesday carries no open interest figure, so no change is asserted.
5. QQQ Options Flow Context (Proxy)
The desk note read for this section is the 5:20 PM ET edition for Wednesday, read at 8:32 PM ET. Its reference prices are the prior session's closes, not Wednesday's: NDX 30,339 equals Tuesday's 30,339.33 cash close and QQQ 737 equals Tuesday's 737.93, so every level below is read against Wednesday's 30,408.50 cash close and 739.77 fund close rather than against the reference column.
On the Nasdaq-100 index the largest gamma concentration sits at NDX 30,500, 91.50 points above the cash close, and the modeled gamma-flip level at NDX 29,810 and the modeled volatility threshold at NDX 29,450 both sit well beneath it. The primary put side support base is NDX 28,000. The call-side ceiling field reads NDX 29,475, beneath both the close and the modeled gamma-flip level, which is the same inverted reading recorded in earlier editions, so it is excluded from the level structure. The note lists NDX 30,500, 29,475, 30,000 and 31,000 as key strikes and NDX 30,006, 30,248, 30,430 and 31,250 as combination levels. Gamma tilt on the index reads 1.429 with a gamma notional of 9.814 million dollars, close to flat, and the 25-delta risk reversal reads minus 0.043.
On the QQQ proxy the largest gamma concentration and the primary put side support base both sit at 730, the modeled gamma-flip level at 736 and the modeled volatility threshold at 737, with the primary call side ceiling at 760. The fund closed at 739.77, above the 736 to 737 pair. Gamma tilt reads 0.887 and the gamma notional minus 264.177 million dollars, so the proxy's dealers carry a net short gamma position, and the 25-delta risk reversal reads minus 0.028. Put volume of 1.314 million contracts exceeded call volume of 1.036 million. The QQQ console dated 2026-09-30 attributes 36.28 percent of the fund's gamma to the nearest expiration; its high and low volatility point fields are treated as low-confidence and excluded.
The desk note's narrative said the real-time hedging flow data for the Nasdaq-100 was relatively flat on the day while the negative reading was concentrated on the S&P 500 index side, which it attributed to likely end-of-quarter rebalancing rather than a bearish view, and it reported software up 1.2 percent, the largest technology names up 0.4 percent, semiconductors up 0.2 percent and memory names down 1.5 percent. It described the memory-chip maker as flat after its results and within its implied move, with the stock's main gamma and delta strike at 1,000.
At the measured closing basis of 290.25 points, NDX 30,500 corresponds to 30,790.25 on the December contract, the modeled gamma-flip level at NDX 29,810 to 30,100.25 and the modeled volatility threshold at NDX 29,450 to 29,740.25. These are conversions made by this review; the source publishes no Nasdaq futures pair, and the modeled thresholds are not listed strikes. The review uses the QQQ fund as the positioning proxy for the Nasdaq-100 contract, a choice made for the dataset available, and it remains secondary to technical structure and to the large-cap and semiconductor drivers in section 4. In this review's interpretation, the contract above 30,100.25 sits in a positive-gamma environment on the index and beneath the 30,790.25 concentration, which tends to dampen moves between them, while the proxy's net short gamma leaves room for larger moves if the fund breaks beneath 736.
6.1 Night Session (6:00 PM ET Wednesday to 3:00 AM ET Thursday, Globex and Asia)
The Thursday session reopened at 30,707.00 at 6:00 PM ET, 8.25 points above the settle and 1.33 points above the Pivot Point at 30,705.67, with the memory-chip maker's results in hand. The Japanese central bank's quarterly business survey is listed at 7:50 PM ET, per the news-feed calendar and unconfirmed. Bias constructive above 30,648.67, expected Globex band roughly 30,600 to 30,840, with the reaction to the memory-chip maker's results in Asian memory names the first input.
6.2 London Session (3:00 AM to 8:00 AM ET Thursday)
The European morning carries final manufacturing surveys for Germany at 3:55 AM ET and the euro area at 4:00 AM ET, both per the news-feed calendar and unconfirmed. Wednesday's European morning drifted to the session low, per the 30-minute series, so a hold above 30,570.83 in this window would mark a change in character. Bias neutral to constructive, expected band roughly 30,560 to 30,860.
6.3 Morning Session (9:30 AM to 12:00 PM ET Thursday, RTH Open)
Weekly jobless claims are listed at 8:30 AM ET and the manufacturing survey from the purchasing managers' institute at 10:00 AM ET, forecast 55 against 54.6, both per the news-feed calendar and unconfirmed. A large consulting firm's results call is scheduled for 8:00 AM ET, construction spending for 10:00 AM ET and a Federal Reserve governor for 10:00 AM ET, all of which the calendar lists. The cash open at 9:30 AM ET sets the first directional test. Acceptance above 30,899.08 opens 31,094.75; a loss of 30,512.25 returns the contract to 30,314.80. Expected band roughly 30,520 to 30,960.
6.4 Afternoon Session (12:00 PM to 4:00 PM ET Thursday)
The Federal Reserve vice chair speaks at 1:30 PM ET, the vice chair for supervision at 3:00 PM ET and a Federal Reserve governor at 3:30 PM ET, all of which the calendar lists. Wednesday's final half hour traded down 177.50 points from its high, per the 30-minute series, so the close is the window to test for a repeat. Expected band roughly 30,540 to 30,940.
6.5 Night Session Forward (6:00 PM ET Thursday)
An athletic-apparel maker's results follow the equity close at about 4:15 PM ET, which the calendar lists, and the employment report is scheduled for 8:30 AM ET on October 2, 2026, as the calendar lists it, so Thursday's night session carries positioning into Friday's release.
6.6 Expected Range (Thursday Full Session)
Low-range scenario: 30,560 to 30,860; Mid-range scenario (most likely): 30,480 to 30,960; High-range scenario: 30,300 to 31,100.
6.7 Most Likely Path
In this review's analyst judgment the most probable path holds the Globex session above the 30,648.67 target price as the memory-chip maker's results are digested, with a pullback toward the 30,570.83 to 30,640 area during the European hours. Through the United States morning the 10:00 AM ET manufacturing survey, per the news-feed calendar and unconfirmed, and the yield response decide whether the contract returns to the 30,899.08 to 30,920.31 group, and a settle between 30,570.83 and 30,920.31 is weighted above a settle outside that band, because the composite read holds at 80 percent buy, the settle sits above the 9-day, 20-day, 50-day and 100-day averages and the range contracted. The alternative that would invalidate this reading is a yield breakout above Wednesday's close that repeats the final-hour selling and takes the contract through the 30,512.25 low.
7. Thursday Economic Calendar
The Thursday session reopened at 6:00 PM ET Wednesday. The Japanese quarterly business survey is listed at 7:50 PM ET and Japanese manufacturing survey data at 8:30 PM ET, both per the news-feed calendar and unconfirmed. The European morning lists Swiss consumer prices at 2:30 AM ET, final manufacturing surveys for Germany at 3:55 AM ET and the euro area at 4:00 AM ET and the United Kingdom survey at 4:30 AM ET, all per the news-feed calendar and unconfirmed.
The United States morning carries a large consulting firm's results call at 8:00 AM ET, which the calendar lists, weekly jobless claims at 8:30 AM ET, forecast 200,000 against 197,000, per the news-feed calendar and unconfirmed, and the manufacturing survey from the purchasing managers' institute at 10:00 AM ET, forecast 55 against 54.6, per the news-feed calendar and unconfirmed. Construction spending is scheduled for 10:00 AM ET, as the calendar lists it, and a Federal Reserve governor speaks at 10:00 AM ET, as the calendar lists it. The Federal Reserve vice chair speaks at 1:30 PM ET, as the calendar lists it, the vice chair for supervision at 3:00 PM ET and a Federal Reserve governor at 3:30 PM ET, both of which the calendar lists, and an athletic-apparel maker's results follow at about 4:15 PM ET, which the calendar lists.
The single first-order event for the Nasdaq-100 contract on Thursday is the 10:00 AM ET manufacturing survey, per the news-feed calendar and unconfirmed, through the yield response, with the overnight reaction to the memory-chip maker's results the first input before it. The employment report follows at 8:30 AM ET on October 2, 2026, as the calendar lists it.
8. Primary Trade Setup
Direction: Long
Rationale: Wednesday made a higher high and a higher low, settled above the 9-day, 20-day, 50-day and 100-day settlement averages, and the composite read holds at 80 percent buy with positive direction above negative direction; a pullback into the zone above one standard deviation support offers a long with a defined risk point beneath Pivot S1 and the session low. The final-hour selling and a ten-year yield at 5.29 percent argue against chasing strength, so the setup is an analyst judgment against a rising-yield backdrop.
Entry Zone: 30,600 to 30,640
Stop Loss: 30,420 (beneath Pivot S1 at 30,505.33, the 30,512.25 session low and three standard deviations support at 30,477.19)
Target 1 (T1): 30,820 (6.67 points beneath one standard deviation resistance at 30,826.67)
Target 2 (T2): 31,020 (above three standard deviations resistance at 30,920.31 and beneath the 31,094.75 one-month high)
Target 3 (T3, extended): 31,220 (above Pivot R2 at 31,099.42 and beneath Pivot R3 at 31,292.83)
Risk-to-Reward: Approximately 1:1 to T1, 1:2 to T2, 1:3 to T3
Invalidation: A settle beneath Pivot S1 at 30,505.33 negates the thesis. Short of that, the edge is removed by two consecutive 30-minute closes beneath the 30,512.25 session low.
Macro override: A disappointing reaction to the memory-chip maker's results across semiconductors, a hot prices-paid reading that pushes the ten-year yield through Wednesday's close, or a geopolitical escalation that lifts the volatility index would invalidate the long in real time, and the 30,311.92 to 30,314.80 pair becomes the reference within one 14-day average true range of 454.71 points.
Alternate setup: the session review states none.
Sources and methodology
This outlook is built from our session review of the December E-mini Nasdaq-100 contract, NQZ26, the December ’26 contract, prepared after Wednesday's close on September 30, 2026 for the Thursday, October 1 session. The contract was verified before any level was used: the explicit December symbol was used at the provider, the chart's continuous symbol maps to the same contract, the chart's completed Wednesday bar equals the provider's settlement row, and the provider's previous close of 30,698.75 is reproduced by the chart title within its two-decimal rounding. Because Globex reopened at 6:00 PM ET, the day high, day low and open on the provider's overview belong to the Thursday session and are never presented as Wednesday's range. Wednesday's extremes are the completed-session inputs behind the published pivot ladder, back-solved from the outer pivot pairs, verified against all seven rungs and reproduced by the chart's daily bar; both printed before the settle, per the 30-minute series. Statements about the order of prices within Wednesday's session rest on the preserved 30-minute provider series, which also orders the prints used to grade the prior card.
The settlement averages were computed from the provider's 259-row daily settlement series and are shown to two decimals; that series also supplies the seven closes charted above. Volume and open interest come from the provider's daily record: the 2026-09-30 row reads preliminary volume of 598,965 contracts with open interest not yet published, and the 2026-09-29 row now reads volume of 585,162, open interest of 269,744 and a low of 30,372.00, where Wednesday's outlook carried a preliminary 572,387, no open interest and a 30,372.25 low. The review's 353.50 point range for Tuesday matches the revised row. The oscillator readings are cited as published, with the reopen caveat. The desk note is the 5:20 PM ET edition for Wednesday and the fund console is dated 2026-09-30, both read at 8:32 PM to 8:33 PM ET; the desk note's reference prices are Tuesday's closes and are used as such. Cash-denominated levels are translated with the measured 290.25 point basis, the 4:00 PM ET settlement against the 4:00 PM ET cash close from the same provider. The inverted cash-index call-side field and the console's volatility-point fields are excluded from the level structure. The gold, dollar, fund and volatility-index changes are computed from the provider's Wednesday and Tuesday closes. The 52-week high cited is 31,336 on the December contract. Every catalyst whose release time had passed when data collection began, at 6:18 PM ET, is recorded as completed, including the memory-chip maker's results. Scenario ranges, session bands and the path weighting are analyst judgment and carry no calibration. Items marked unconfirmed come from the news-feed calendar or press reports and were not matched on the calendar used for confirmed times.
Wednesday’s outlook for this contract is here and the broad-index outlook for the same date is here. Outlooks for ES, NQ, GC and CL are collected on the market outlook page, and our forward trading record is on the performance statement.



