
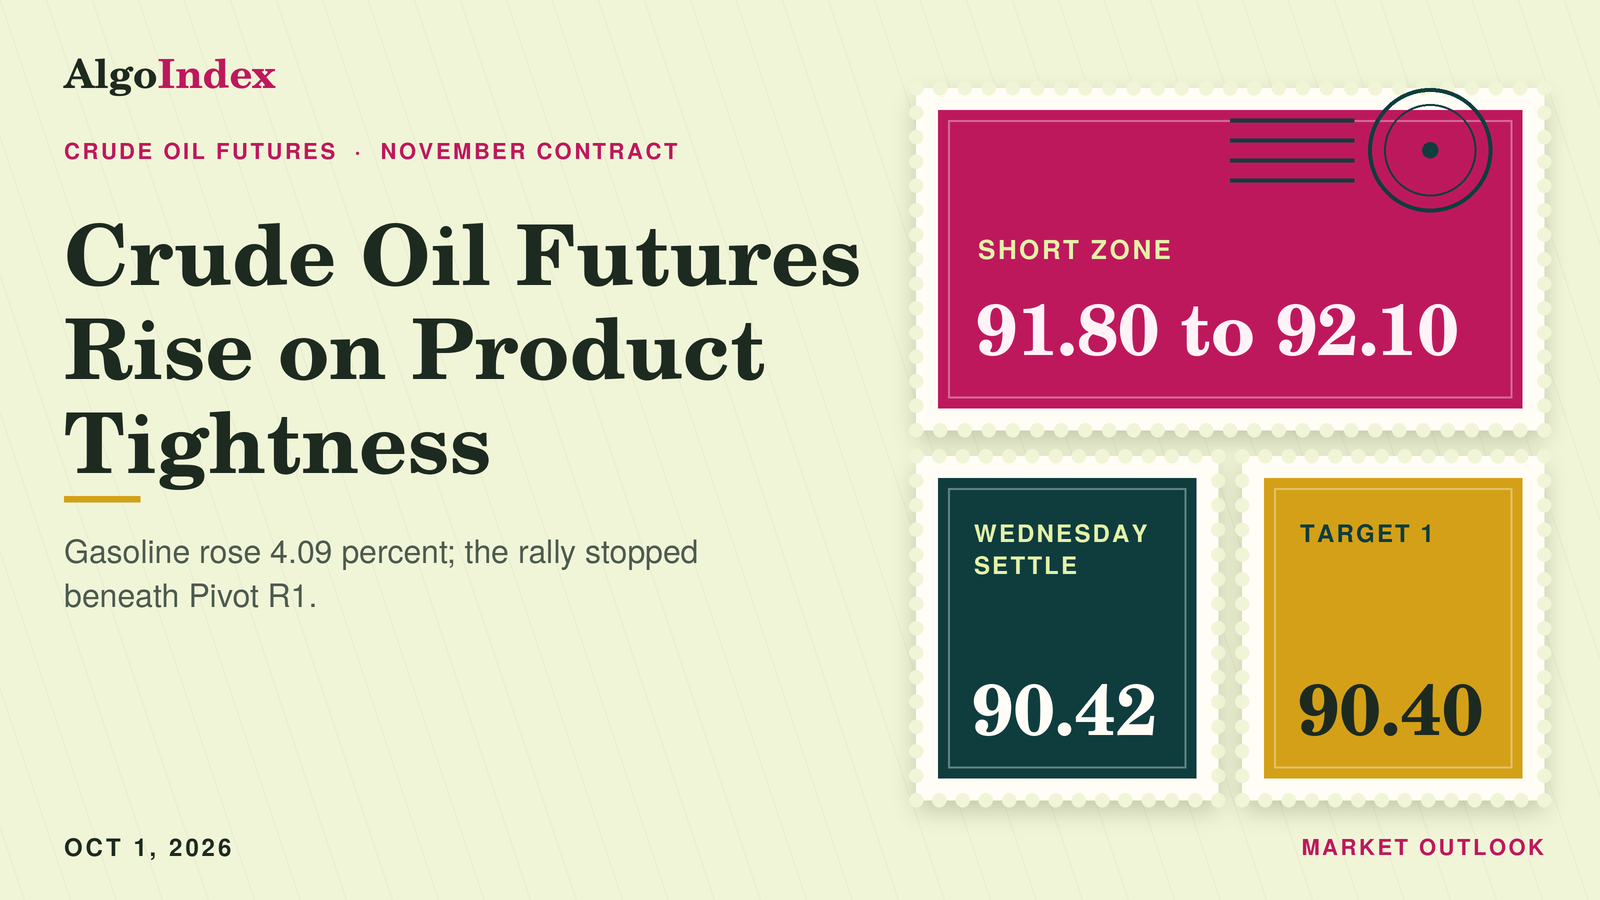
In the 11:00 AM ET bar on Wednesday, November crude reached 91.96 and went no higher. It settled at 90.42 at 2:30 PM ET, up 1.04 points or 1.16 percent from Tuesday's 89.38. That was the largest one-day gain since the 2.45 point advance of 09/24. The contract traded between 91.96 and 88.58, a 3.38 point range, and finished at 54.4 percent of that range. Volume printed 263,549 contracts on the provider's dated daily record for Wednesday, against 335,169 on Tuesday's row.
The low came first. The provider's 30-minute series puts the 88.58 print in the 6:00 PM ET bar on Tuesday evening, the first bar of the reopened session, and the 3:00 AM ET bar traded down to 88.59, one cent above it. Then Europe bid. The contract rose to 90.61 in the 5:00 AM ET bar, traded between 90.13 and 91.10 in the 8:30 AM ET bar that contained the price-index release, and printed its high in the 11:00 AM ET bar. It faded from there. The 2:00 PM ET bar traded down to 90.33 before the settlement, and post-settlement electronic trade held between 90.26 and 90.90.
Wednesday's range shrank. Tuesday had covered 5.96 points, and Wednesday's 3.38 was 0.75 times the published 14-day average daily range of 4.52 even as the direction reversed. Provider commentary tied the rally to product tightness. It said Russia extended its ban on most diesel exports through October, that the maritime security agency reported three tankers struck in the Strait of Hormuz on Tuesday, and that weekly government gasoline inventories fell to a nearly 12-year low while distillate stocks unexpectedly declined. The crude line itself showed a build of 0.922 million barrels against a forecast draw of 0.71 million, per the news-feed calendar. Gasoline rose 4.09 percent. Heating oil rose 3.95 percent. Brent's November contract settled at 103.53, up 0.94 or 0.92 percent per the news feed at 2:53 PM ET, so WTI outperformed and the Brent premium narrowed to 13.11 from 13.21. Crude remains the most volatile of the four instruments covered here. Its published 14-day average true range of 4.12 points is 4.56 percent of the settle.
November WTI settled at 90.42, up 1.16 percent, at 54.4 percent of a 91.96 to 88.58 range. The high stalled ten cents under R1. The first overhead references are the 90.90 post-settlement high and the 91.20 stochastic threshold, with the 91.81 average crossing and the 92.06 to 92.08 pair above. Support starts at the 90.32 Pivot Point and the 90.33 settle-window low, then the 89.81 to 89.56 group and Pivot S1 at 88.68. The primary setup is a short from 91.80 to 92.10, stop 93.40, targets 90.40, 89.00 and 87.60. Thursday carries the manufacturing survey at 10:00 AM ET, per the news-feed calendar and unconfirmed. It is the first-order event for crude.
Wednesday's short, graded against the bar
Wednesday's outlook set a short from a rebound into 89.80 to 90.20 at the 89.81 retracement, with a stop at 91.40, targets at 88.50, 87.20 and 85.80, and an outright invalidation on a settle above the 90.97 Pivot Point. Wednesday opened at 89.00, marked a 91.96 high and an 88.58 low, and settled at 90.42; the dated 09/30 row of the provider's daily record carries the same four prices. The low came before the band. The 88.58 print sits in the 6:00 PM ET reopen bar, whose high was 89.14. The band first traded in the 9:00 PM ET bar, which reached 89.89.
We put the stop at 91.40. The 9:00 AM ET bar traded through it to a 91.50 high, and the 91.96 session high followed in the 11:00 AM ET bar, 56 cents above the stop. No target traded. After the band first traded, the lowest print was 88.59 in the 3:00 AM ET bar, nine cents above the 88.50 first target; the 88.58 session low, eight cents above it, had come earlier, in the reopen bar. The 30-minute series shows that order across bars. It does not show fills, and this outlook asserts no result for the card.
A clause turned against the card before the stop level traded. It removed the edge on acceptance above the 90.35 relative-strength line, defined as two consecutive 30-minute closes above 90.35 with the 89.81 retracement held beneath. That came early. The 6:00 AM ET and 6:30 AM ET bars closed at 90.39 and 90.57, with lows of 90.09 and 90.06, both above 89.81. By the card's own terms the edge was gone in the European morning, before the 9:00 AM ET bar reached 91.40. The outright invalidation did not trigger. The settle sat 55 cents beneath 90.97.
The macro override named a confirmed attack on vessels in the Strait of Hormuz, an Iranian withdrawal from the talks or a weekly inventory report showing a large draw. Provider commentary reported three tankers struck in the Strait on Tuesday, citing the maritime security agency, and that report was not independently confirmed. The 10:30 AM ET report showed a crude build of 0.922 million barrels, per the news-feed calendar. Nothing captured tonight shows an Iranian withdrawal.
The range work missed high. The low-range case, 87.60 to 90.00, gave way by 1.96 at the high and by 42 cents at the settle. The most likely band, 86.80 to 90.60, held the settle 18 cents inside its top, while the high ran 1.36 over it. The high-range case, 85.40 to 91.80, held the low and the settle. Its top gave way by 16 cents.
The path call missed by seven cents. That outlook weighted a settle between 87.19 and 90.35 above a settle outside it, and Wednesday settled at 90.42. The 30-minute series scores the session bands. Globex, 87.80 to 90.00, traded 88.58 to 89.99 through the 2:30 AM ET bar, inside the band by one cent at the top. London, 87.60 to 90.30, ran 61 cents over its top at 90.91. The United States morning, 87.40 to 90.90, traded up to 91.96, 1.06 over, and the afternoon, 87.20 to 90.60, reached 91.57 in the 12:30 PM ET bar, 97 cents over, before the settle.
The low first, the high about 17 hours later
Wednesday opened at the Tuesday 6:00 PM ET reopen at 89.00, 38 cents beneath Tuesday's settle, and the first bar printed the 88.58 daily low. Asia stayed quiet. From the 6:30 PM ET bar through the 2:30 AM ET bar the contract held between 88.96 and 89.99. The 3:00 AM ET bar opened at 89.74, traded down to 88.59 and closed at 89.22. That low sat one cent above the reopen low.
Europe did the buying. The 4:30 AM ET bar closed at 90.16, the 5:00 AM ET bar reached 90.61 and the 7:30 AM ET bar 90.91. The 8:30 AM ET bar contained the personal income and outlays report; it opened at 90.43, traded between 90.13 and 91.10 and closed at 90.36. The 9:00 AM ET bar reached 91.50. The 10:30 AM ET bar, which contained the weekly petroleum status report, traded between 91.05 and 91.74 and closed at 91.59, 24 cents above its open. The 11:00 AM ET bar printed the 91.96 high.
Then the midday bars drifted lower. The 12:30 PM ET bar reached down to 90.87, the 1:30 PM ET bar to 90.63, and the 2:00 PM ET bar traded down to 90.33 before the 2:30 PM ET settlement at 90.42. Provider commentary said crude fell from its best level after the dollar index recovered from early losses. The series shows the fade, and the dollar record shows the recovery. The two are not time-matched, so no ordering is asserted.
Post-settlement trade barely moved. The 2:30 PM ET bar traded between 90.36 and 90.90, and the 4:30 PM ET bar between 90.26 and 90.48, closing at 90.34. The Thursday session reopened at 90.40. The provider's overview page now shows that new session, with a 90.51 high and a 90.24 low, and neither is used as Wednesday's range.
The extremes are the completed-session inputs behind the published pivot ladder, back-solved from its outer pairs. The third resistance point at 95.44 minus the third support point at 85.30, divided by three, returns 3.38, and 93.70 minus 86.94, divided by two, returns the same. Three times the 90.32 Pivot Point less the 90.42 settle gives a 180.54 high-plus-low sum, and 91.96 with 88.58 reproduces all seven rungs. The ladder checks out. The chart's completed Wednesday bar reads 89.00, 91.96, 88.58 and 90.42, and the provider's settlement row carries the same four figures.
Both extremes stepped down again. The 91.96 high sits 2.78 points beneath Tuesday's 94.74 and the 88.58 low 20 cents beneath Tuesday's 88.78. That low is the weakest print since the 88.18 low of 09/08. The prior week, September 21 through September 25, spanned 97.22 to 88.67, and Wednesday's low sits nine cents beneath that range. The 52-week, 13-week and one-month high of 101.69, set on 09/15/26, sits 11.27 points above the settle, and the one-month low of 82.47, set on 08/31/26, 7.95 points beneath it. Across five sessions the contract lost 1.74 points or 1.89 percent from the 92.16 settle of 09/23. No prior-quarter high or low was captured, so the 13-week extremes stand in as the quarterly reference. Wednesday closed the third quarter.
Twelve settles tell the swing: 100.75, 97.51, 97.23, 96.08, 92.37, 90.52, 92.16, 94.61, 92.41, 92.60, 89.38 and 90.42. The session highs since Monday read 96.54, 94.74 and 91.96. Each sat lower than the one before. Wednesday's settle recovered a third of Tuesday's 3.22 point loss. Daily ranges for the last seven sessions ran 5.17, 4.35, 5.55, 3.24, 5.29, 5.96 and 3.38.
The retracement grid published for Thursday places the 38.2 percent retracement from the four-week low at 89.81, 61 cents beneath the settle, the 50 percent retracement of the four-week range at 92.08 and the 38.2 percent retracement from the four-week high at 94.35. The 38.2 percent retracement from the 13-week high sits at 88.47 and the 50 percent retracement of the 13-week range at 84.39. No four-hour series was captured. The 30-minute series is the only intraday evidence.
The averages come from the provider's daily settlement series for the November contract, 259 completed sessions through Wednesday. The 5-day stands at 91.88, the 9-day at 92.28, the 20-day at 93.27, the 50-day at 85.44, the 100-day at 81.60 and the 200-day at 74.64. The settle sits 1.46 points beneath the 5-day, 1.86 beneath the 9-day and 2.85 beneath the 20-day, and 4.98 points above the 50-day.
The 20-day still rose. It climbed 13 cents from Tuesday's 93.14 because the 09/01 settle of 87.75 left its window and 90.42 replaced it. The 9-day fell 76 cents from 93.04 as the 09/17 settle of 97.23 left, and the 5-day fell 35 cents from 92.23 as the 09/23 settle of 92.16 left. The projection grid puts Thursday's 9-day crossing at 91.81. The 18-day crossing sits at 94.15 and the 40-day at 87.56.
Relative strength sits near the middle. Oscillators are cited as published for the Thursday session. That page was read after the 6:00 PM ET reopen, so the latest value in each may reflect live Globex trade instead of the settle. Relative strength reads 45.22 on the 9-day, 50.13 on the 14-day and 52.83 on the 20-day. Stochastics remain near the bottom of their range. The 9-day raw stochastic reads 19.51 percent and the 14-day 14.04 percent, with the 14-day %K at 16.56 percent and %D at 25.91 percent. The 14-3 day raw stochastic's 20 percent threshold sits at 91.20 and its 30 percent threshold at 92.51.
Direction still points up. On the 9-day the directional index reads 26.59 with positive direction at 18.64 and negative at 16.69; the 14-day reads 27.58, positive at 21.29 over negative at 16.20. Historic volatility runs 34.76 percent on the 9-day and 37.15 percent on the 14-day. The composite multi-indicator read for Thursday fell to 16 percent buy from 24 percent in the prior session's snapshot, with signal strength described as soft and direction as weakest. It read 32 percent a week ago and 80 percent a month ago. The short-horizon group averages 20 percent sell, the medium-horizon group 25 percent buy and the long-horizon group 67 percent buy.
Volatility sets the scale. The published 14-day average true range stands at 4.12 points and the 14-day average daily range at 4.52; the 9-day figures are 4.38 and 4.68, the 20-day figures 3.90 and 4.27. Wednesday's 3.38 point range was 0.75 times the 14-day average daily range. A one-range projection from 90.42 on the 14-day average true range frames Thursday between 86.30 and 94.54. The published deviation bands are narrower because they are built from five settlements: one deviation spans 88.38 to 92.46, two spans 87.54 to 93.30 and three spans 86.89 to 93.95. The bands describe settlement dispersion and say nothing about intraday reach.
Diesel curbs, reported tanker strikes and a crude build
Products outran crude. November gasoline settled at 3.2605 dollars a gallon, up 0.1282 or 4.09 percent, and November heating oil at 4.6881, up 0.1781 or 3.95 percent, per the provider's daily record. Both product margins widened on the settlement arithmetic. The gasoline margin, 42 gallons times the gasoline settle less the WTI settle, went to 46.52 from 42.18, and the heating oil margin to 106.48 from 100.04. The expiring October contracts settled at 3.4378 for gasoline and 4.9569 for diesel, per the news feed at 2:31 PM ET. No refinery utilisation figure and no seasonal demand series were captured.
Russia supplied the product-side signal. Provider commentary said Russia extended its ban on most diesel exports through October, a measure the commentary said began in July and described as a response to Ukrainian drone attacks on refineries. No producer-alliance statement was captured on Wednesday's feeds. Investment-bank commentary carried on the news feed said that with flows through the Saudi East-West crude line restored, regional exports are about 11 percent beneath pre-war levels. Both are descriptions from the sources named. Neither is a measurement taken here.
Crude stocks rose anyway. The calendar listed the weekly petroleum status report at 10:30 AM ET, and the news-feed calendar recorded a crude build of 0.922 million barrels against a forecast draw of 0.71 million and a prior build of 2.969 million. Provider commentary said gasoline inventories fell to a nearly 12-year low and distillate stocks unexpectedly declined. Those two figures were not captured, so no volume is asserted for them. The industry group's estimate on Tuesday evening had shown a crude build of 1.019 million barrels, so the government crude line confirmed a build while the product lines drove the price. No strategic reserve figure was captured on Wednesday's feeds.
The Strait stayed in the reporting. Provider commentary said the maritime security agency reported three tankers struck in the Strait of Hormuz on Tuesday, and said attacks on vessels transiting the Strait continue. The attacks are reported by that commentary and were not independently confirmed. After the settle, a press report carried on the news feed at 3:58 PM ET said a pilot had planned to seize control of an aircraft over Jordan and crash it in Israeli territory. Two remarks followed. At 4:57 PM ET the President said gasoline prices will drop after the Iran war ends, and at 4:59 PM ET he said he had spoken to the Israeli prime minister about the incident. All of these items were carried after the 2:30 PM ET settlement, so none of them coincided with the settle-window price action.
Elsewhere the reporting thinned. An energy-news article on the feed at 6:01 PM ET described foreign oil companies returning to Caracas. No production figure accompanied it. A state news agency report on the feed at 2:46 PM ET said three Syrian power plants went out of service after a gas line explosion.
Rates stayed high. The dollar index closed at 101.45, up 0.08 points, after a session low of 101.03 per the provider's daily record, and provider commentary said the dollar shook off early losses after yields rose. The ten-year yield index closed at 5.29 percent, which provider commentary described as a 19-year high, and the thirty-year at 5.64 percent. Inflation came in under forecast. The price-index report showed core inflation of 3.0 percent year on year against a 3.3 percent forecast and 0.2 percent month on month against 0.3 percent, per the news-feed calendar. The third estimate of second-quarter output rose to 2.2 percent against 1.5 percent.
The private payroll survey showed 90,000 against 74,500 and the Chicago purchasing managers' index 58.8 against 51, both per the news-feed calendar. The priced probability of an October rate increase fell after the report. A news-feed item at 11:20 AM ET put it at 34.9 percent from 44.8 percent, and provider commentary gave 37 percent from 52 percent on Tuesday. The two sources disagree. Neither is used as a level input.
Equities split. The S&P 500 cash index closed at 7,651.54, down 0.25 percent, and the Nasdaq-100 cash index at 30,408.50, up 0.23 percent. Gold's December contract settled at 4,186.7, up 7.0 points or 0.17 percent. In our interpretation crude's product-led rally added to the inflation pressure on yields that offset the softer price-index report.
Positioning data did not move. The positioning report as of September 22, 2026 is unchanged since Tuesday. Managed money held 223,190 contracts long against 121,362 short, a net long of 101,828. Commercials held 847,389 long against 1,017,278 short, a net short of 169,889, and swap dealers 111,924 long against 584,713 short. The next report covers positions as of Tuesday, September 29. The provider's overview shows open interest on the November contract at 289,255, the figure on Tuesday's dated row, and Wednesday's row carries 294,853. The daily rows have shifted their open interest values between captures, so no change in open interest is asserted for Wednesday.
One gap is deliberate. No dealer-positioning dataset was read for crude: no gamma map, no options concentration levels and no flow attribution, and none is borrowed from another instrument. The positioning inputs for crude are the weekly positioning report, the weekly inventory report, the Brent spread and the product margins.
The trade map for Thursday
Overhead, the first references sit close. The 90.90 post-settlement high in the 2:30 PM ET bar and the stochastic 20 percent threshold at 91.20 come first, followed by the 9-day average crossing at 91.81. Pivot R1 at 92.06 and the 50 percent retracement at 92.08 sit two cents apart. Wednesday's 91.96 high stopped ten cents beneath R1. One deviation resistance at 92.46 and the stochastic 30 percent threshold at 92.51 follow, then two deviation resistance at 93.30 and the 20-day settlement average at 93.27. The extended set sits higher. Pivot R2 at 93.70, three deviation resistance at 93.95, the 18-day average crossing at 94.15 and the 94.35 retracement from the four-week high are the extended references.
Beneath the settle, the Pivot Point at 90.32 and the 90.33 settle-window low in the 2:00 PM ET bar sit one cent apart. The 90.26 post-settlement low sits seven cents lower. The settle is ten cents above the Pivot Point and six cents above the 14-day relative-strength 50 percent line at 90.36. Both now count as support. The 89.81 retracement, the 89.58 three-and-ten day crossover stall and the 89.56 published target price form the next group. Pivot S1 at 88.68 sits ten cents above the 88.58 session low. Beneath it come the 88.57 18-day average stall, the 88.47 retracement from the 13-week high and one deviation support at 88.38. The 40-day crossing at 87.56 and two deviation support at 87.54 sit two cents apart. Pivot S2 at 86.94, three deviation support at 86.89 and Pivot S3 at 85.30 are the deeper references.
The primary setup is a short from a rebound into 91.80 to 92.10, around the 91.81 average crossing and Pivot R1. Wednesday's rally stopped at 91.96, beneath Tuesday's 94.74 and ten cents beneath R1. The settle sits 2.85 points beneath the 20-day settlement average. The composite read fell to 16 percent buy. Direction reads weakest. A rebound into the crossing and the pivot offers a short with a defined risk point above two deviation resistance. The directional readings still show positive direction above negative and the product complex is tight, so the setup is an analyst judgment against a live supply risk. The stop sits 1.45 from the 91.95 entry midpoint.
The reopen sits beneath the entry band. The Thursday session reopened at 90.40 at 6:00 PM ET, two cents beneath the settle and eight cents above the Pivot Point. Asia gets two Japanese releases. The Japanese central bank's quarterly business survey is listed at 7:50 PM ET and Japanese manufacturing survey data at 8:30 PM ET, per the news-feed calendar and unconfirmed. The night session starts on the 90.32 Pivot Point with the 89.81 to 89.56 group beneath, so the first test is whether Wednesday's rally holds above 90.32. Bias is neutral, skewed lower beneath 90.32. The expected Globex band is roughly 89.50 to 91.20, and a fresh Strait incident is the risk that would lift it toward 91.81.
Europe lists Swiss consumer prices at 2:30 AM ET, final manufacturing surveys for Germany at 3:55 AM ET and the euro area at 4:00 AM ET, the United Kingdom survey at 4:30 AM ET and euro area unemployment at 5:00 AM ET, all per the news-feed calendar and unconfirmed. Wednesday's advance began in this window, per the 30-minute series, as the product complex firmed. The diesel export ban cited in provider commentary carries into the European trading day. Bias is neutral. The expected band runs roughly 89.30 to 91.40.
Thursday's New York morning carries weekly jobless claims at 8:30 AM ET, forecast 200,000 against 197,000, per the news-feed calendar and unconfirmed. The manufacturing survey from the purchasing managers' institute follows at 10:00 AM ET, forecast 55 against 54.6, with its prices-paid component forecast at 73, also per the news-feed calendar and unconfirmed. The calendar lists construction spending and remarks from a Federal Reserve governor at 10:00 AM ET. A hold beneath the 91.81 average crossing through the morning keeps the 89.56 to 89.81 group in reach; acceptance above 92.08 returns the contract toward 92.46 and 93.27. Expected band roughly 89.20 to 91.90.
The Federal Reserve vice chair speaks at 1:30 PM ET, on the calendar, and crude settles at 2:30 PM ET. Wednesday's afternoon faded from the 91.96 high to a 90.33 settle-window low. A repeat would put the Pivot Point back in play into the settle. Expected band roughly 89.10 to 91.60.
After the pit closes, the vice chair for supervision speaks at 3:00 PM ET and a Federal Reserve governor at 3:30 PM ET, and Nike's results follow the equity close at about 4:15 PM ET, all on the calendar. The employment report is scheduled for 8:30 AM ET on October 2, 2026, so Thursday's night session carries positioning into Friday's release. The provider lists the November contract's expiration as 10/20/26.
Three scenarios frame the full session. The low-range case runs 89.30 to 91.40, the mid-range case, which is the most likely, 88.60 to 92.10, and the high-range case 87.40 to 93.30. None carries a derived frequency. In our analyst judgment the most probable path holds Globex around the 90.32 Pivot Point as the market weighs Wednesday's product-led rally against the inventory build, with rotation between the 89.81 retracement and the 91.20 stochastic threshold through the European hours. In the same judgment, the 10:00 AM ET manufacturing survey, per the news-feed calendar and unconfirmed, and the dollar's response to it decide whether the contract revisits the 91.81 to 92.08 band. A settle between 89.56 and 92.06 is weighted above a settle outside that band. Three readings carry that weighting. Wednesday printed a lower high, the composite read fell to 16 percent buy and the settle sits beneath the 5-day, 9-day and 20-day averages. A confirmed escalation in the Strait or a further Russian product restriction would invalidate this reading and put the 92.46 to 93.30 band in play.
Wednesday's rally stopped ten cents short of Pivot R1. Thursday reopened eight cents above the pivot beneath it.
The complete data picture
Every number behind Thursday’s plan, charted first, then the full level lists, then the complete numeric reference underneath.
Full numeric reference, every remaining figure from the session review
Carried below in the review’s own order: the level notes from sections 3.1 and 3.2, the executive summary from section 1, sections 2.1 to 2.6, sections 4.1 to 4.6, the coverage note from section 5, the session-by-session forecast from section 6, the Thursday calendar from section 7 and the primary setup from section 8.
3.1 Resistance and 3.2 Support, level notes
The settle sits ten cents above the Pivot Point at 90.32 and six cents above the 14-day relative-strength 50 percent line at 90.36, so both now sit beneath price and are treated as support. The first overhead references are the 90.90 post-settlement high in the 2:30 PM ET bar and the stochastic 20 percent threshold at 91.20, followed by the 9-day average crossing at 91.81. Pivot R1 at 92.06 and the 50 percent retracement at 92.08 sit two cents apart, with Wednesday's 91.96 high ten cents beneath Pivot R1. One standard deviation resistance at 92.46 and the stochastic 30 percent threshold at 92.51 follow, then two standard deviations resistance at 93.30 and the 20-day settlement average at 93.27. Pivot R2 at 93.70, three standard deviations resistance at 93.95, the 18-day average crossing at 94.15 and the 38.2 percent retracement from the four-week high at 94.35 are the extended references.
The Pivot Point at 90.32 and the 90.33 settle-window low in the 2:00 PM ET bar sit one cent apart directly beneath the settle, with the 90.26 post-settlement low in the 4:30 PM ET bar seven cents lower. The 38.2 percent retracement from the four-week low at 89.81, the 3-10 day crossover stall at 89.58 and the published target price at 89.56 form the next group. Beneath that, Pivot S1 at 88.68 sits ten cents above the 88.58 session low, with the 18-day average stall at 88.57, the 38.2 percent retracement from the 13-week high at 88.47 and one standard deviation support at 88.38 below it. The 40-day average crossing at 87.56 and two standard deviations support at 87.54 sit two cents apart, and Pivot S2 at 86.94, three standard deviations support at 86.89 and Pivot S3 at 85.30 are the deeper references.
1. Executive Summary
The November crude contract settled at 90.42 on Wednesday, up 1.04 points or 1.16 percent from Tuesday's 89.38 settle, after trading between 91.96 and 88.58, a 3.38 point daily range. It was the largest one-day gain since the 2.45 point advance of 09/24, and the settle finished at 54.4 percent of the range. The 3.38 point range was 0.75 times the published 14-day average daily range of 4.52 points, so the session contracted after Tuesday's 5.96 point range even as the direction reversed.
The provider's 30-minute series fixes the order and the windows. The 88.58 daily low printed in the 6:00 PM ET bar on Tuesday evening, the first bar of the reopened session, and the 3:00 AM ET bar traded down to 88.59, one cent above it. The contract then rose through the European morning to 90.61 in the 5:00 AM ET bar, traded between 90.13 and 91.10 in the 8:30 AM ET bar that contained the price-index release, and printed the 91.96 high in the 11:00 AM ET bar. From there it faded into the settle: the 2:00 PM ET bar traded down to 90.33 before the 2:30 PM ET settlement at 90.42, and post-settlement electronic trade held between 90.26 and 90.90.
Provider commentary tied the rally to product tightness: Russia extended its ban on most diesel exports through October, the maritime security agency reported three tankers struck in the Strait of Hormuz on Tuesday, and weekly government gasoline inventories fell to a nearly 12-year low while distillate stocks unexpectedly declined. The crude line itself showed a build of 0.922 million barrels against a forecast draw of 0.71 million, per the news-feed calendar. The November gasoline contract rose 4.09 percent and heating oil 3.95 percent, so both product margins widened sharply. Brent's November contract settled at 103.53, up 0.94 or 0.92 percent per the news feed at 2:53 PM ET, so WTI outperformed and the Brent premium narrowed to 13.11 from 13.21.
Crude remains the most volatile of the four instruments covered here; the published 14-day average true range of 4.12 points is 4.56 percent of the settle. The primary setup below is a short from the 91.80 to 92.10 band around the 9-day average crossing and Pivot R1, stopped above two standard deviations resistance, with objectives at 90.40, 89.00 and an extended 87.60.
2.1 Intraday and Session Review
The Wednesday session opened at 89.00 at the Tuesday 6:00 PM ET reopen, 38 cents beneath Tuesday's settle, marked a daily high of 91.96 and a daily low of 88.58, and settled at 90.42 at 2:30 PM ET. The provider's 30-minute series, 46 bars from the reopen through the 4:30 PM ET bar, places the low in the 6:00 PM ET bar and the high in the 11:00 AM ET bar, so the session made its low first and its high about 17 hours later.
The Asian hours were contained: from the 6:30 PM ET bar through the 2:30 AM ET bar the contract held between 88.96 and 89.99. The 3:00 AM ET bar opened at 89.74 and traded down to 88.59 before closing at 89.22, one cent above the reopen low. The advance began in the European morning. The 4:30 AM ET bar closed at 90.16, the 5:00 AM ET bar reached 90.61 and the 7:30 AM ET bar reached 90.91.
The 8:30 AM ET bar, which contained the personal income and outlays report, opened at 90.43, traded between 90.13 and 91.10 and closed at 90.36. The 9:00 AM ET bar reached 91.50 and the 10:30 AM ET bar, which contained the weekly petroleum status report, traded between 91.05 and 91.74. The 11:00 AM ET bar printed the 91.96 high. The midday bars then drifted lower, the 12:30 PM ET bar reaching 90.87 and the 1:30 PM ET bar 90.63, and the 2:00 PM ET bar traded down to 90.33 before the settlement at 90.42. Provider commentary said crude fell from its best level after the dollar index recovered from early losses; the series shows the fade, and the dollar record in section 4.5 shows the recovery, but the two are not time-matched here, so no ordering is asserted.
After the 2:30 PM ET settlement, electronic trade was narrow. The 2:30 PM ET bar traded between 90.36 and 90.90, and the 4:30 PM ET bar traded between 90.26 and 90.48 and closed at 90.34. The Thursday session reopened at 90.40.
The session extremes used here are the completed-session inputs behind the published pivot ladder, back-solved from the outer pivot pairs and verified against every rung. The third resistance point at 95.44 minus the third support point at 85.30, divided by three, returns 3.38, and the second resistance point at 93.70 minus the second support point at 86.94, divided by two, returns the same 3.38. Three times the Pivot Point of 90.32 less the 90.42 settle gives a high plus low sum of 180.54, and the resulting pair of 91.96 and 88.58 reproduces all seven published rungs. The chart's completed Wednesday daily bar reads 89.00, 91.96, 88.58 and 90.42, an independent confirmation of the same values, and the provider's settlement row carries the same four figures.
Because Globex reopened at 6:00 PM ET, the provider's overview page now shows the Thursday session: its open of 90.40, high of 90.51 and low of 90.24 belong to the new session and are not used as Wednesday's range anywhere here.
2.2 Daily Structure
Wednesday printed a lower high and a lower low against Tuesday: the 91.96 high sits 2.78 points beneath Tuesday's 94.74, and the 88.58 low sits 20 cents beneath Tuesday's 88.78. The 88.58 low is the lowest print since the 88.18 low of 09/08, and it printed in the first bar of the session, on Tuesday evening.
The prior week, September 21 through September 25, spanned 97.22 to 88.67, and Wednesday's low sits nine cents beneath that range. The 52-week, 13-week and one-month high of 101.69, set on 09/15/26, sits 11.27 points above the settle, and the one-month low of 82.47, set on 08/31/26, sits 7.95 points beneath it. Across five sessions the contract lost 1.74 points or 1.89 percent from the 92.16 settle of 09/23.
No prior-quarter high or low was captured, so the 13-week extremes serve as the available quarterly reference. Wednesday is the last session of the third quarter.
2.3 4-Hour and Swing Structure
The daily settlement sequence after the 09/15 peak reads 100.75, 97.51, 97.23, 96.08, 92.37, 90.52, 92.16, 94.61, 92.41, 92.60, 89.38 and 90.42. The session highs since Monday read 96.54, 94.74 and 91.96, each lower than the one before, while Wednesday's settle recovered a third of Tuesday's 3.22 point loss. Daily ranges for the last seven sessions ran 5.17, 4.35, 5.55, 3.24, 5.29, 5.96 and 3.38.
The retracement grid published for Thursday places the 38.2 percent retracement from the four-week low at 89.81, 61 cents beneath the settle, the 50 percent retracement of the four-week range at 92.08 and the 38.2 percent retracement from the four-week high at 94.35. The 38.2 percent retracement from the 13-week high sits at 88.47 and the 50 percent retracement of the 13-week range at 84.39. No four-hour series was captured; the 30-minute series in section 2.1 is the only intraday evidence used.
2.4 Moving Averages
The averages cited in this subsection were computed from the provider's daily settlement series for the November contract, 259 completed sessions through Wednesday. The 5-day average stands at 91.88, the 9-day at 92.28, the 20-day at 93.27, the 50-day at 85.44, the 100-day at 81.60 and the 200-day at 74.64.
The 90.42 settle sits 1.46 points beneath the 5-day average, 1.86 beneath the 9-day and 2.85 beneath the 20-day, and 4.98 points above the 50-day. The 20-day average rose 13 cents from Tuesday's 93.14, because the 09/01 settle of 87.75 left the window and was replaced by 90.42. The 9-day average fell 76 cents from 93.04 as the 09/17 settle of 97.23 left its window, and the 5-day fell 35 cents from 92.23 as the 09/23 settle of 92.16 left.
The projection grid gives the prices at which each average would be crossed on Thursday: 91.81 for the 9-day, 94.15 for the 18-day and 87.56 for the 40-day.
2.5 Oscillator and Trend Readings
The oscillator figures below are as published on the provider's technical page dated for the Thursday session, which was read after the 6:00 PM ET reopen, so the most recent value in each may include live Globex trade as well as the settle. Relative strength reads 45.22 on the 9-day, 50.13 on the 14-day and 52.83 on the 20-day.
Stochastics remain near the bottom of their range. The 9-day raw stochastic reads 19.51 percent and the 14-day 14.04 percent, with the 14-day %K at 16.56 percent and %D at 25.91 percent. The published grid places the 14-3 day raw stochastic 20 percent threshold at 91.20 and its 30 percent threshold at 92.51.
The directional system still reads positive direction above negative direction. On the 9-day the directional index reads 26.59 with positive direction at 18.64 and negative direction at 16.69; on the 14-day it reads 27.58 with positive direction at 21.29 over negative at 16.20. Historic volatility reads 34.76 percent on the 9-day and 37.15 percent on the 14-day.
The composite multi-indicator read published for Thursday is 16 percent buy, down from 24 percent buy in the prior session's snapshot, with signal strength described as soft and direction as weakest. The snapshot history reads 32 percent buy a week ago and 80 percent buy a month ago. The short-horizon group averages 20 percent sell, the medium-horizon group 25 percent buy and the long-horizon group 67 percent buy.
2.6 Volatility and Expected Range
The published 14-day average true range stands at 4.12 points and the 14-day average daily range at 4.52 points; the 9-day figures are 4.38 and 4.68, and the 20-day figures 3.90 and 4.27. Wednesday's 3.38 point range was 0.75 times the 14-day average daily range.
A one-range projection from the 90.42 settle using the 14-day average true range frames Thursday between 86.30 and 94.54. The published standard-deviation bands are narrower because they are built from five settlements: one deviation spans 88.38 to 92.46, two spans 87.54 to 93.30 and three spans 86.89 to 93.95. These bands describe settlement dispersion and say nothing about intraday reach.
4.1 OPEC and Supply Policy (Quotas, Compliance, Saudi and Russia Signals)
No producer-alliance statement was captured on Wednesday's feeds. The Russian supply signal was on the product side: provider commentary said Russia extended its ban on most diesel exports through October, a measure the commentary said began in July. Investment-bank commentary carried on the news feed said that with flows through the Saudi East-West crude line restored, regional exports are about 11 percent beneath pre-war levels. Both are descriptions from the sources named, not measurements taken here.
4.2 Inventory Data (Crude Stocks, Gasoline, Distillates, Cushing, Strategic Reserve)
The calendar listed the weekly petroleum status report at 10:30 AM ET on September 30, 2026, and the news-feed calendar recorded a crude build of 0.922 million barrels against a forecast draw of 0.71 million and a prior build of 2.969 million. Provider commentary said gasoline inventories fell to a nearly 12-year low and distillate stocks unexpectedly declined; the gasoline and distillate figures themselves were not captured, so no volume is asserted for them. The 10:30 AM ET bar that contained the release traded between 91.05 and 91.74 and closed at 91.59, 24 cents above its open, and the 91.96 high followed in the next bar.
The industry group's estimate on Tuesday evening had shown a crude build of 1.019 million barrels, so the government crude line confirmed a build while the product lines drove the price. No strategic reserve figure was captured on Wednesday's feeds.
4.3 Geopolitical Backdrop (Middle East, Iran, Russia and Ukraine, Venezuela)
Provider commentary said the maritime security agency reported three tankers struck in the Strait of Hormuz on Tuesday, and said attacks on vessels transiting the Strait continue; the attacks are reported by that commentary and were not independently confirmed. After the settle, a press report carried on the news feed at 3:58 PM ET said a pilot had planned to seize control of an aircraft over Jordan and crash it in Israeli territory, and at 4:59 PM ET the President said he had spoken to the Israeli prime minister about the incident. At 4:57 PM ET the President said gasoline prices will drop after the Iran war ends. All of these items were carried after the 2:30 PM ET settlement, so none of them coincided with the settle-window price action.
On the Russia and Ukraine side, provider commentary described the diesel export ban as a response to Ukrainian drone attacks on refineries. On Venezuela, an energy-news article on the feed at 6:01 PM ET described foreign oil companies returning to Caracas; no production figure accompanied it. A state news agency report on the feed at 2:46 PM ET said three Syrian power plants went out of service after a gas line explosion.
4.4 Demand and Refining (Refinery Utilisation, Crack Spreads, Seasonal Pattern)
The product complex outperformed crude by a wide margin. The November gasoline contract settled at 3.2605 dollars a gallon, up 0.1282 or 4.09 percent, and the November heating oil contract settled at 4.6881, up 0.1781 or 3.95 percent, per the provider's daily record. Both product margins widened on the settlement arithmetic: the gasoline margin, 42 gallons times the gasoline settle less the WTI settle, went to 46.52 from 42.18, and the heating oil margin to 106.48 from 100.04.
The expiring October contracts settled at 3.4378 for gasoline and 4.9569 for diesel, per the news feed at 2:31 PM ET. No refinery utilisation figure and no seasonal demand series were captured, so neither is asserted.
4.5 Dollar and Cross-Asset (Dollar Index, Commodities Complex, Equity Risk Appetite)
The dollar index closed at 101.45, up 0.08 points, after a session low of 101.03 per the provider's daily record, and provider commentary said the dollar shook off early losses after yields rose. The ten-year yield index closed at 5.29 percent, which provider commentary described as a 19-year high. The thirty-year yield index closed at 5.64 percent. The price-index report showed core inflation of 3.0 percent year on year against a 3.3 percent forecast and 0.2 percent month on month against 0.3 percent, per the news-feed calendar, and the third estimate of second-quarter output rose to 2.2 percent against 1.5 percent. The private payroll survey showed 90,000 against 74,500 and the Chicago purchasing managers' index 58.8 against 51, both per the news-feed calendar.
The priced probability of an October rate increase fell after the report: a news-feed item at 11:20 AM ET put it at 34.9 percent from 44.8 percent, and provider commentary gave 37 percent from 52 percent on Tuesday. The two sources disagree and neither is used as a level input. Equities were mixed: the S&P 500 cash index closed at 7,651.54, down 0.25 percent, and the Nasdaq-100 cash index at 30,408.50, up 0.23 percent. Gold's December contract settled at 4,186.7, up 7.0 points or 0.17 percent. In our interpretation crude's product-led rally added to the inflation pressure on yields that offset the softer price-index report.
4.6 Institutional Positioning (Commitments Data, Money Manager and Commercial Hedger, Speculator Length)
The positioning report as of September 22, 2026, unchanged since Tuesday, shows managed money long 223,190 contracts against short 121,362, a net long of 101,828. Commercials held 847,389 long against 1,017,278 short, a net short of 169,889, and swap dealers held 111,924 long against 584,713 short. The next report covers positions as of Tuesday, September 29.
The provider's overview shows open interest on the November contract at 289,255, the figure on Tuesday's dated row; Wednesday's dated row carries 294,853. The daily rows have shifted their open interest values between captures, so no change in open interest is asserted for Wednesday.
5. No liquid options proxy
Crude is covered here without a positioning dataset. There is no dealer-positioning surface read for this instrument, no gamma map, no options concentration levels and no flow attribution, and none is inferred from any other instrument. Every level in sections 3.1 and 3.2 originates in published pivot arithmetic, published standard-deviation bands, published retracement and moving-average projections, settlement averages computed from the provider's daily record, the completed-session extremes described in section 2.1, or bars in the provider's 30-minute series.
This is a statement about coverage, not about the existence of listed crude options. The positioning inputs used for crude are the weekly positioning report, the weekly inventory report, the Brent spread and the product margins.
Night Session (6:00 PM ET Wednesday to 3:00 AM ET Thursday, Globex and Asia)
The Thursday session reopened at 90.40 at 6:00 PM ET, two cents beneath the settle and eight cents above the Pivot Point at 90.32. The Japanese central bank's quarterly business survey is listed at 7:50 PM ET, per the news-feed calendar and unconfirmed. The night session starts on the 90.32 Pivot Point with the 89.81 to 89.56 group beneath, so the first test is whether Wednesday's rally holds above 90.32. Bias neutral with a lower skew beneath 90.32, expected Globex band roughly 89.50 to 91.20, with a fresh Strait incident the risk that would lift it toward 91.81.
London Session (3:00 AM ET to 8:00 AM ET Thursday)
The European morning carries final manufacturing surveys for Germany at 3:55 AM ET and the euro area at 4:00 AM ET, both per the news-feed calendar and unconfirmed. Wednesday's advance began in this window, per the 30-minute series, as the product complex firmed; the diesel export ban cited in provider commentary carries into the European trading day. Bias neutral, expected band roughly 89.30 to 91.40.
Morning Session (9:00 AM ET to 12:00 PM ET Thursday, United States Open and Pit Session)
Weekly jobless claims are listed at 8:30 AM ET and the manufacturing survey from the purchasing managers' institute at 10:00 AM ET, with a forecast of 55 against 54.6, both per the news-feed calendar and unconfirmed. Construction spending and remarks from a Federal Reserve governor follow at 10:00 AM ET, both on the calendar. A hold beneath the 91.81 average crossing through the morning keeps the 89.56 to 89.81 group in reach; acceptance above 92.08 returns the contract toward 92.46 and 93.27. Expected band roughly 89.20 to 91.90.
Afternoon Session (12:00 PM ET to 2:30 PM ET Thursday, NYMEX Pit Close)
The Federal Reserve vice chair speaks at 1:30 PM ET, on the calendar, and crude's settlement falls at 2:30 PM ET. Wednesday's afternoon faded from the 91.96 high to a 90.33 settle-window low, so a repeat would put the Pivot Point back in play into the settle. Expected band roughly 89.10 to 91.60.
Night Session Forward (6:00 PM ET Thursday)
Further Federal Reserve remarks are scheduled at 3:00 PM ET and 3:30 PM ET, and Nike's results follow the equity close at about 4:15 PM ET, all on the calendar. The employment report is scheduled for 8:30 AM ET on October 2, 2026, on the calendar, so Thursday's night session carries positioning into Friday's release.
Expected Range (Thursday Full Session)
Low-range scenario: 89.30 to 91.40. Mid-range scenario (most likely): 88.60 to 92.10. High-range scenario: 87.40 to 93.30.
Most Likely Path
In our analyst judgment the most probable path holds the Globex session around the 90.32 Pivot Point as the market weighs Wednesday's product-led rally against the inventory build. The base case in that judgment has rotation between the 89.81 retracement and the 91.20 stochastic threshold through the European hours. In the same judgment, through the United States morning the 10:00 AM ET manufacturing survey, per the news-feed calendar and unconfirmed, and the dollar's response to it decide whether the contract revisits the 91.81 to 92.08 band, and a settle between 89.56 and 92.06 is weighted above a settle outside that band, because Wednesday printed a lower high, the composite read fell to 16 percent buy and the settle sits beneath the 5-day, 9-day and 20-day averages. The alternative that would invalidate this reading is a confirmed escalation in the Strait or a further Russian product restriction, which would put the 92.46 to 93.30 band in play.
7. Thursday Economic Calendar
The Thursday session reopened at 6:00 PM ET Wednesday. The Japanese quarterly business survey is listed at 7:50 PM ET and Japanese manufacturing survey data at 8:30 PM ET, both per the news-feed calendar and unconfirmed. The European morning lists Swiss consumer prices at 2:30 AM ET, final manufacturing surveys for Germany at 3:55 AM ET and the euro area at 4:00 AM ET, the United Kingdom survey at 4:30 AM ET and euro area unemployment at 5:00 AM ET, all per the news-feed calendar and unconfirmed.
The United States morning carries weekly jobless claims at 8:30 AM ET, forecast 200,000 against 197,000, per the news-feed calendar and unconfirmed, and the manufacturing survey from the purchasing managers' institute at 10:00 AM ET, forecast 55 against 54.6, with its prices-paid component forecast at 73, per the news-feed calendar and unconfirmed. Construction spending is scheduled for 10:00 AM ET, on the calendar, and a Federal Reserve governor speaks at 10:00 AM ET, on the calendar. The Federal Reserve vice chair speaks at 1:30 PM ET, on the calendar, and crude settles at 2:30 PM ET. The vice chair for supervision speaks at 3:00 PM ET and a Federal Reserve governor at 3:30 PM ET, both on the calendar, and Nike's results follow at about 4:15 PM ET, on the calendar.
The November contract's expiration is listed as 10/20/26 by the provider. The single first-order event for crude on Thursday is the 10:00 AM ET manufacturing survey, per the news-feed calendar and unconfirmed, through the dollar and yields, with Strait headlines the unscheduled risk in both directions. The employment report follows at 8:30 AM ET on October 2, 2026, on the calendar.
8. Primary Trade Setup
Direction: Short
Rationale: Wednesday's rally stopped at a 91.96 high, beneath Tuesday's 94.74 and ten cents beneath Pivot R1 at 92.06, and the settle sits 2.85 points beneath the 20-day settlement average while the composite read fell to 16 percent buy with direction weakest; a rebound into the 9-day average crossing and Pivot R1 offers a short with a defined risk point above two standard deviations resistance. The directional readings still show positive direction above negative direction and the product complex is tight, so the setup is an analyst judgment against a live supply risk.
Entry Zone: 91.80 to 92.10
Stop Loss: 93.40 (above two standard deviations resistance at 93.30 and the 20-day settlement average at 93.27)
Target 1 (T1): 90.40 (eight cents above the Pivot Point at 90.32)
Target 2 (T2): 89.00 (32 cents above Pivot S1 at 88.68)
Target 3 (T3, extended): 87.60 (six cents above two standard deviations support at 87.54)
Risk-to-Reward: Approximately 1:1 to T1, 1:2 to T2, 1:3 to T3, from the 91.95 entry midpoint against a 1.45 point stop distance
Invalidation: A settle above two standard deviations resistance at 93.30 negates the thesis. Short of that, the edge is removed by acceptance above 92.46 rather than by a touch, defined as two consecutive 30-minute closes above 92.46.
Macro override: A confirmed attack on vessels in the Strait of Hormuz with transit halted, a further Russian export restriction extending to crude, or a sharp dollar decline after the manufacturing survey would add to the supply premium. In that scenario the short is wrong immediately, and the 93.30 to 94.35 band becomes the reference within one 14-day average true range of 4.12 points.
Sources and methodology
This outlook is built from our session review of the November NYMEX WTI crude contract, CLX26, the November ’26 month, tracked on the continuous CL1! chart and prepared after Wednesday’s close on September 30, 2026 for the Thursday, October 1, 2026 session. The contract domain was checked before any level was used: the daily chart’s reading of 90.17 with its stated change of minus 0.28 percent returns 90.42, the provider’s published previous close, and the chart’s completed Wednesday bar equals the provider’s settlement row, so chart and levels sit on the same November contract. The day high, day low and open shown on the provider’s overview page belong to the Thursday session and are not presented anywhere here as Wednesday’s range.
Wednesday’s session extremes are the completed-session inputs behind the published pivot ladder, back-solved from the outer pivot pairs, checked against all seven published rungs and reproduced by the chart’s daily bar. The 5-day, 9-day, 20-day, 50-day, 100-day and 200-day averages were computed from the provider’s 259-session daily settlement series. Volume and open interest are quoted from the dated rows of that daily record for 09/29 and 09/30; the partial row dated 10/01 belongs to the reopened session and is not used. The 09/29 row now reads volume 335,169 and open interest 289,255, where Tuesday evening’s outlook cited the 313,854 and 294,853 published at that time. Oscillator readings are cited as published, with the reopen caveat stated. Every intraday ordering claim rests on the provider’s 30-minute series for Wednesday, 46 bars from the reopen through the 4:30 PM ET bar. No dealer-positioning dataset was read for crude, so no gamma, dealer-positioning or options-flow claim is made. Items marked unconfirmed come from the news-feed calendar captured for this session; catalysts whose time had passed at 6:18 PM ET, when collection began, are recorded as completed. Scenario ranges are analyst judgment and carry no calibration. Wednesday’s grade uses Wednesday’s open, high, low and settle as stated in tonight’s review and the dated 09/30 row of the daily record, which agree, the 30-minute series for the order of prints, and the setup card as published on Wednesday’s outlook.
Not captured, and stated nowhere as a figure: a four-hour series, a prior-quarter high or low, a producer-alliance statement, the weekly gasoline and distillate volumes, a refinery utilisation figure, a seasonal demand series, a strategic reserve figure, and a Venezuela production figure.
Wednesday’s outlook for this contract is here, and Wednesday’s gold outlook is here. Outlooks for the equity index, technology index, gold and crude contracts are collected on the market outlook page, and our forward trading record is on the performance statement.



