
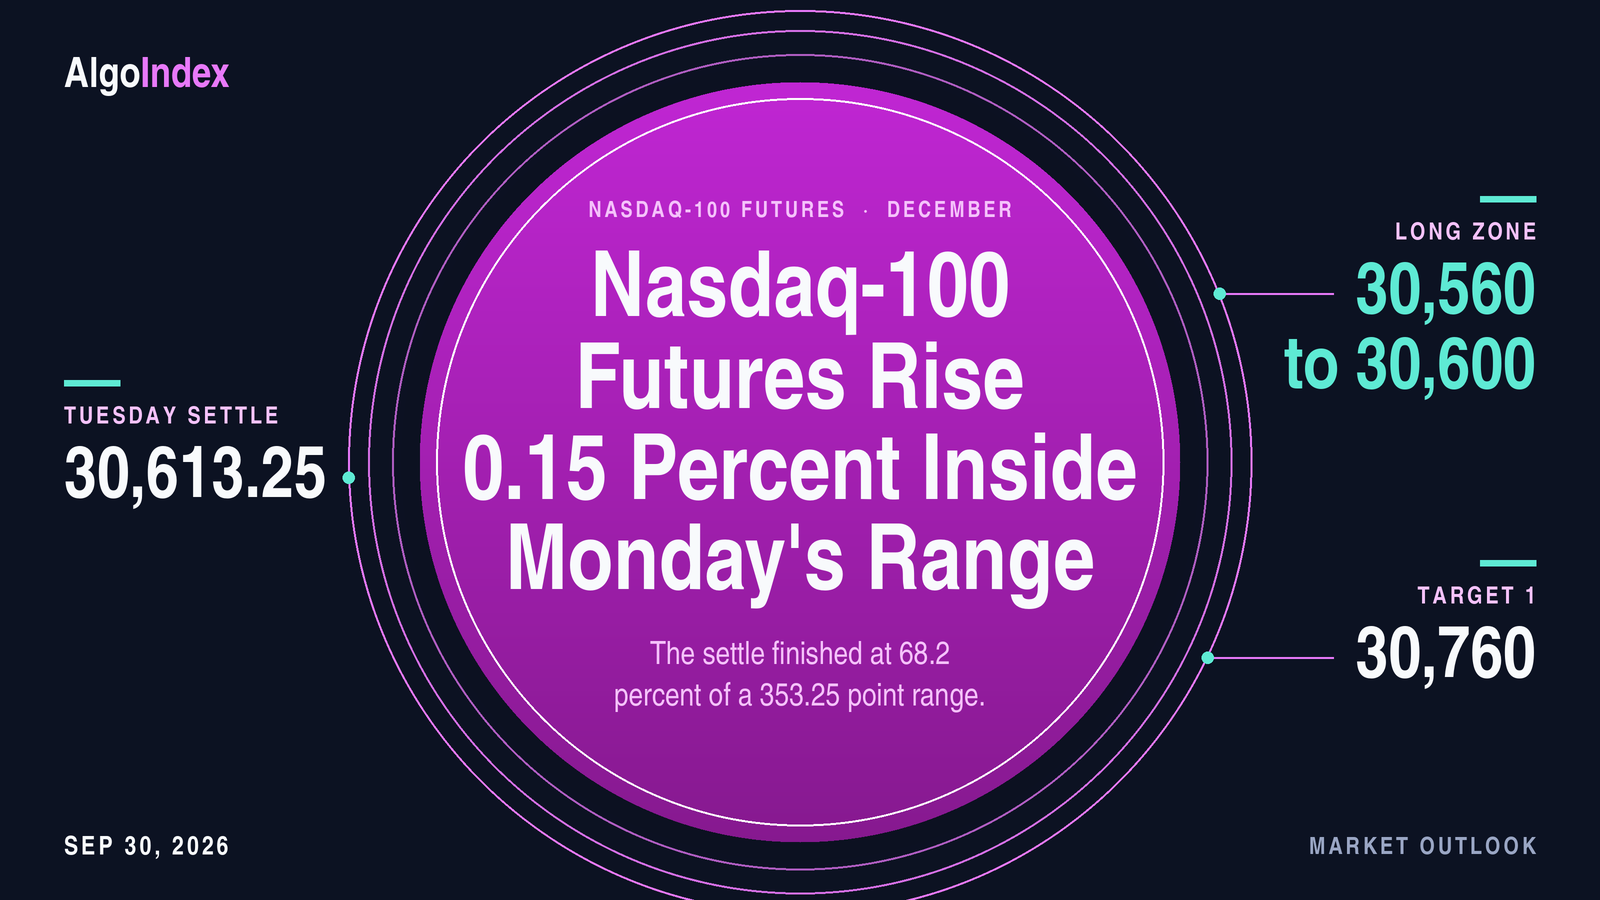
At 5.29 percent, the ten-year yield index printed a session high on Tuesday (provider record read at 6:46 PM ET) that provider commentary called a new 19-year high. It closed at 5.26 percent, up 2 basis points. The Nasdaq-100 rose anyway. December Nasdaq-100 futures settled at 30,613.25, up 47.00 points or 0.15 percent from Monday's 30,566.25. Chips did the lifting.
Tuesday traded a 353.25 point band from 30,725.50 down to 30,372.25, entirely inside Monday's 564.00 point session, and settled at 68.2 percent of it. The preserved 30-minute series puts the low in the 1:30 AM ET bar and the high in the 9:30 AM ET bar, eight hours later. The cash hours then rotated beneath 30,700. The cash index closed at 30,339.33, up 62.52 points or 0.21 percent, while the S&P 500 cash index fell 0.17 percent and the semiconductor index gained 1.32 percent. In this review's interpretation the semiconductor gain carried the index while the broader market absorbed the rate pressure.
December Nasdaq-100 futures settled at 30,613.25, up 47.00 points, at 68.2 percent of a 353.25 point inside-day range and 42.92 points above the Pivot Point at 30,570.33. Preliminary volume was 572,387 contracts, per the provider's daily record. Tuesday's open interest is not yet published. Monday's row reads 271,485. The composite multi-indicator read held at 88 percent buy. The settle sits above the 9-day, 20-day, 50-day, 100-day and 200-day averages and beneath the 5-day. Overhead: the 30,657.25 reopen, the 30,666.34 9-day crossing, Tuesday's 30,725.50 high, the 30,743.51 to 30,773.92 group and the 30,797.46 to 30,858.08 band. Beneath: the 30,585.11 target price, the Pivot Point, the 30,482.99 to 30,482.22 pair, the 30,429.04 to 30,415.17 pair and the 30,387.64 to 30,356.75 band. The primary setup is a long from 30,560 to 30,600, stop 30,400, targets 30,760, 30,940 and 31,120. The first-order release is the personal income and outlays report at 8:30 AM ET, which the calendar lists.
Tuesday settled 13.25 points inside the 30,600 short band
Our Tuesday outlook set a short from 30,600 to 30,660 with a stop at 30,815 and targets at 30,445, 30,260 and 30,075. Tuesday's completed bar, on the provider's daily record, opened at 30,560.50, marked a high of 30,725.50 and a low of 30,372.25, and settled at 30,613.25. Tonight's review states the same open, high, low and settle. Price traded through the whole band. The high printed 65.50 points above its upper edge and stopped 89.50 points beneath the stop, which was never reached. The low ran 72.75 points through the 30,445 first target level and stopped 112.25 short of the 30,260 second target. The 30,075 extension stayed 297.25 points away.
The 30-minute series adds the order of the bars. The 6:00 PM ET bar, the first after the reopen, reached 30,616.00, 16.00 points into the band. The 30,372.25 low came later, in the 1:30 AM ET bar. The contract then climbed back through the band to 30,717.75 in the 8:00 AM ET bar and the 30,725.50 high in the 9:30 AM ET bar. Bars show sequence only. No fill and no result is asserted here. Settlement landed at 30,613.25, 13.25 points above the band's lower edge and 46.75 beneath its upper edge.
We weighted a Tuesday settle between 30,308.42 and 30,737.36 over a settle outside that band. Tuesday settled at 30,613.25, inside it and 124.11 points beneath its top. The overnight sketch fared worse. We had the overnight and European hours holding between 30,395.14 and the 30,614.58 Pivot Point. The very first bar printed 30,616.00, 1.42 points above the pivot, the 1:30 AM ET low sat 22.89 points beneath 30,395.14, and the 8:00 AM ET bar reached 30,717.75, 103.17 above the pivot.
Neither invalidation test triggered. The settle finished 259.17 points beneath the 30,872.42 Pivot R1 threshold, and the high stayed 11.86 points beneath 30,737.36, so no 30-minute close could reach it. The macro override named a soft labour reading that pulls the ten-year yield well below 5.20 percent. The job openings report came in beneath forecast, yet the ten-year closed at 5.26 percent, up 2 basis points, so that leg did not trigger. Its other leg was a de-escalation in the Strait of Hormuz that drops crude sharply. Crude fell 3.48 percent. Tonight's review reports the Iran talks as unresolved and names no such de-escalation, so that leg is left unscored. We grade the card as written.
An inside day that settled at 68.2 percent
Tuesday opened at 30,560.50 at the Monday 6:00 PM ET reopen, 5.75 points beneath Monday's settle. The evening bars leaned lower. From the 30,616.00 high of the 6:00 PM ET bar the contract slid to 30,409.25 in the 11:00 PM ET bar and to the 30,372.25 low in the 1:30 AM ET bar. Then it turned. The 2:00 AM ET bar opened at 30,432.50 and reached 30,527.75, and the European hours extended the recovery to 30,635.25 in the 4:00 AM ET bar and 30,717.75 in the 8:00 AM ET bar.
The cash open came in a wide bar. The 9:30 AM ET bar spanned 30,725.50 to 30,545.50, took in the session high and closed at 30,608.25; the series does not show the order of those two prints inside the bar. The 10:00 AM ET bar, which contained the job openings and consumer confidence releases, traded from 30,589.25 to 30,698.50 and closed at 30,670.00. Sellers came back at 11:00 AM ET. That bar opened at 30,663.00 and dropped to 30,531.25, and the 12:30 PM ET bar reached 30,504.50, the low of the cash hours.
Buyers answered at 2:00 PM ET. The bar opened at 30,522.75 and reached 30,621.75, a move that coincided with a 2:00 PM ET news-feed item in which the New York Fed president said one further rate increase is likely this year if the economy meets expectations; the series does not establish causation. The contract settled at 30,613.25 at 4:00 PM ET. Trade after the settle closed the 4:30 PM ET bar at 30,652.75. The preserved provider series holds 46 bars from the reopen through that bar. The settle finished 52.75 points above the open, 112.25 beneath the high and 241.00 above the low.
Those extremes also come from the ladder. They are the completed-session inputs behind the published pivot ladder, back-solved from the outer pivot pairs and verified against every rung. The third resistance point at 31,121.67 minus the third support point at 30,061.92, divided by three, returns 353.25. The second pair, 30,923.58 and 30,217.08, divided by two, returns the same 353.25. Three times the 30,570.33 Pivot Point less the settle gives a high plus low sum of 61,097.74. The pair of 30,725.50 and 30,372.25 reproduces all seven rungs. The chart's completed Tuesday bar reads 30,560.50, 30,725.50, 30,372.25 and 30,613.25.
Against Monday the bar sits inside at both ends. The high is 195.25 points beneath Monday's 30,920.75 and the low 15.50 above Monday's 30,356.75. The settle recovered 47.00 of Monday's 323.00 point loss. Travel narrowed. The 353.25 point range was 0.75 times the published 14-day average daily range of 471.75 points. Preliminary volume fell to 572,387 contracts from 678,480 on Monday, per the provider's daily record, where Monday's row now carries open interest of 271,485 and Tuesday's is not yet published. Tuesday's outlook carried Monday's preliminary 662,634.
Last week still frames the move. The prior week, September 21 through September 25, spanned 31,094.75 to 29,904.00, and Tuesday sits inside it. Across five sessions the contract lost 415.25 points, or 1.34 percent, from the 31,028.50 settle of 09/22. The one-month and 13-week high of 31,094.75, set on 09/23/26, sits 481.50 points above the settle, and the one-month low of 29,053.00, set on 09/16/26, sits 1,560.25 points beneath it. No prior-quarter high or low was captured, so the 13-week extremes serve as the available quarterly reference. The 52-week high on the December contract stands at 31,336, 722.75 points above the settle.
Settlements map the swing. The sequence from 09/18 reads 29,917.25, 30,784.75, 31,028.50, 30,764.75, 30,766.75, 30,889.25, 30,566.25 and 30,613.25. The swing high remains the 31,094.75 high of 09/23. Monday's 30,356.75 is the swing low inside the pullback, and Tuesday approached it without breaking. Daily ranges for the last seven sessions ran 958.75, 395.50, 452.00, 457.50, 320.50, 564.00 and 353.25. The retracement grid published for Wednesday places the 38.2 percent retracement from the four-week high at 30,314.80, 57.45 points beneath Tuesday's low, and the 50 percent retracement of the four-week range at 30,073.88. No four-hour series was captured, and the 30-minute series is the only intraday evidence used.
Averages still lean up. Computed from the provider's daily settlement series for the December contract, 259 completed sessions through Tuesday, and shown to two decimals, the 5-day stands at 30,720.05, the 9-day at 30,563.75, the 20-day at 30,014.28, the 50-day at 29,721.05, the 100-day at 29,935.52 and the 200-day at 28,003.10. The 200-day spans sessions in which the December contract was deferred and thinly traded. That carries a caveat. The settle sits 106.80 points beneath the 5-day, 49.50 above the 9-day and about 599 points above the 20-day.
Window arithmetic explains the jumps. The 9-day rose 150.72 points because the 09/16 settle of 29,256.75 left its window, and the 5-day fell 83.05 points as the 09/22 settle of 31,028.50 left. The 100-day sits above the 50-day because the older 50 settles in the 100-day window averaged about 30,150.00, higher than the latest 50. Crossing prices come next. The projection grid gives the prices at which each average would be crossed on Wednesday: 30,666.34 for the 9-day, 30,092.53 for the 18-day and 29,964.53 for the 40-day.
Momentum held up. The oscillator figures are as published on the provider's technical page dated for the Wednesday session, read after the 6:00 PM ET reopen, so the most recent value in each may include live Globex trade after the settle. Relative strength reads 59.93 on the 9-day, 58.59 on the 14-day and 56.81 on the 20-day. Stochastics sit in the upper part of their range. The 9-day raw stochastic reads 73.93 percent and the 14-day 76.42 percent, with %K at 80.16 percent beneath %D at 82.91 percent. The published grid places the 14-3 day raw stochastic 70 percent threshold at 30,482.22 and its 80 percent threshold at 30,686.40.
Direction leans positive, with a weak trend reading. On the 9-day the directional index reads 23.67, with positive direction at 25.09 and negative at 19.50; on the 14-day it reads 16.21, with positive direction at 24.33 against negative at 19.87. Historic volatility reads 17.53 percent on the 9-day and 17.07 percent on the 14-day. The composite multi-indicator read published for Wednesday is 88 percent buy, unchanged from the prior session's snapshot, with signal strength described as weak and direction as average. A week ago it read 72 percent buy. A month ago, 40 percent. The short-horizon and medium-horizon groups each average 100 percent buy and the long-horizon group 33 percent buy.
Volatility frames Wednesday. The published 14-day average true range stands at 459.38 points, 1.50 percent of the settle, and the 14-day average daily range at 471.75; the 9-day average true range is 453.21 and the 20-day 475.20. One 14-day average true range either side of the settle spans 30,153.87 to 31,072.63. The published standard-deviation bands, built from five settlements, sit well inside it. One deviation spans 30,482.99 to 30,743.51, two span 30,429.04 to 30,797.46 and three span 30,387.64 to 30,838.86. The desk note's implied one-day move of 0.67 percent for the broad index is the only options-implied range captured.
A 5.29 percent ten-year and a 1.32 percent chip gain
Rates pressed again. The ten-year yield index closed at 5.26 percent, up 2 basis points, after its 5.29 percent session high (provider record read at 6:46 PM ET), a new 19-year high in provider commentary. The thirty-year closed at 5.59 percent, and the desk note said thirty-year yields reached their highest level since 2002. In a 2:00 PM ET news-feed item the New York Fed president said one further rate increase is likely this year if the economy meets expectations. In a 4:05 PM ET item he said rising yields show tighter financial conditions at the margin. The desk note reported that the priced probability of an October increase fell to 45 percent from 70 percent after his remarks, and provider commentary gave 52 percent. The two sources disagree. Neither is used as a level input, and no real-yield series was captured.
The data came in soft. The job openings report showed 7.079 million openings against a 7.2275 million forecast, and consumer confidence printed 81.9 against 89, per the news-feed calendar; provider commentary described the latter as a 12-year low. The dollar index closed at 101.37, a two-month high in provider commentary. Crude's November contract settled at 89.38, down 3.48 percent, and the decline eased part of the energy pressure on inflation expectations. Gold's December contract settled at 4,179.7, up 0.27 percent. A news-feed market wrap described stocks and bonds as falling on inflation concerns that kept yields elevated.
Chips carried the index. The semiconductor index closed at 12,629.16, up 163.92 points or 1.32 percent, per the provider's daily record, and provider commentary cited strength in chipmakers as a support for the broad market. The Nasdaq-100 cash index outperformed the S&P 500 cash index by about 0.37 percentage points, 0.21 percent against minus 0.17 percent. The volatility index closed at 16.04, down 0.03, and its own volatility index at 89.71, down 1.31.
Technology headlines arrived late. The equities feed carried a meeting between the President and technology chief executives between 3:44 PM and 4:11 PM ET. Data centers came up. The President said an artificial-intelligence coordinator would be named in three to four days and discussed their locations, and the meeting was reported alongside the graphics-chip maker's chief executive, who said there is no conflict between artificial-intelligence innovation and safety. After the close the feed carried reports on an artificial-intelligence developer's listing filing and on 30 billion dollars of new credit facilities for an electric-vehicle maker. None of these items moved the settled contract, since most arrived near or after the 4:00 PM ET settle. The memory-chip maker reports after the close on September 30, 2026, with the call at 4:30 PM ET, which the calendar lists.
Iran stayed unresolved. A press report on the news feed at 2:31 PM ET said mediators are pushing to break the deadlock, and the Iranian president's office said at 3:24 PM ET that Iran will not compromise on nuclear rights. A press report at 7:49 AM ET said the President backs Russia sanction relief tied to a prisoner release.
Positioning levels come from two surfaces, the technology fund and the cash index, used here as the proxy for the positioning dataset available. They reach futures only through the measured basis of 273.92 points, Tuesday's 30,613.25 settlement less the 30,339.33 cash close, both at 4:00 PM ET. No weekly positioning figures for the Nasdaq-100 contract were captured, so none is asserted.
The desk note used is the edition published at 5:18 PM ET on Tuesday, September 29. Its reference price column carries the prior session's close, and it checks out: the cash index reference of 30,276 matches Monday's 30,276.81 cash close, and the fund reference of 736 matches Monday's 736.53 close. For the fund the model reads a modeled volatility threshold at 736, a modeled gamma-flip level at 740, a primary gamma concentration at 730, a call-side ceiling at 760 and a put-side base at 730, with gamma tilt 0.897 and gamma notional minus 280.55 million dollars. The fund closed at 737.93 on the provider's daily record. That is 1.93 above the modeled volatility threshold and 2.07 beneath the modeled gamma-flip level.
On the cash index the model reads a modeled volatility threshold at 29,450, a modeled gamma-flip level at 29,748 and a primary gamma concentration at 30,000, with gamma tilt 1.418 and gamma notional 9.617 million dollars. The cash close sits 339.33 points above 30,000 and 160.67 points beneath 30,500. The mapped key levels are 30,000, 29,475, 30,500 and 29,500, and the mapped confluence levels are 30,004, 30,610, 30,216 and 31,246. One oddity repeats. The published call-side and put-side fields, 29,475 and 29,500, sit beneath the cash close and invert their usual order, so they are recorded and left out of the level structure. At the measured basis the 30,500 key level translates to about 30,773.92 in futures and the 30,000 concentration to about 30,273.92.
Both models read negative. The fund's positioning console, dated 2026-09-29, showed a current price of 738.98 against a previous close of 736.53, call gamma of minus 765 million dollars, put gamma of minus 3 billion dollars and next-expiry gamma at 15.48 percent of the total. Two console fields are set aside. The console's high-volatility-point and low-volatility-point fields are excluded as low confidence, because that pair is known to be unreliable. Dampening looks thin. In this review's interpretation the fund sitting between its modeled volatility threshold and its modeled gamma-flip level leaves dealer hedging with little dampening effect into Wednesday's data.
The trade map for Wednesday
The primary setup is a long from 30,560 to 30,600, a pullback into the band around the Pivot Point at 30,570.33 and the published target price at 30,585.11. The case rests on the bar. Tuesday was an inside day that settled at 68.2 percent of its range, the cash index outperformed the broad index with the semiconductor index up 1.32 percent, and the composite read holds at 88 percent buy. The stop at 30,400 sits 15.17 points beneath Pivot S1 at 30,415.17 and 27.75 above Tuesday's 30,372.25 low. Yields sit near 19-year highs ahead of the price-index report. So the setup is an analyst judgment against a live rate risk. The 14-day average true range of 459.38 points compares with a 180 point stop distance from the 30,580 midpoint.
Overhead the references start at the reopen. The 30,657.25 reopen and the 9-day average crossing at 30,666.34 come first, followed by the 30,686.40 threshold for an 80 percent stochastic reading and Tuesday's 30,725.50 high. One standard deviation resistance at 30,743.51 and Pivot R1 at 30,768.42 sit 24.91 points apart. The cash desk note's 30,500 key level translates to about 30,773.92 in futures at the 273.92 point basis. Above that, two standard deviations resistance at 30,797.46, three standard deviations resistance at 30,838.86 and the 14-day %K stall at 30,858.08 form the next band. The three-and-ten day crossover stall at 30,911.54, Monday's 30,920.75 high and Pivot R2 at 30,923.58 sit above it. The four-week high of 31,094.75 and Pivot R3 at 31,121.67 are the extended references.
Support starts just beneath the settle. The published target price at 30,585.11 and the Pivot Point at 30,570.33 come first, with the 9-day settlement average at 30,563.75 6.58 points lower. One standard deviation support at 30,482.99 and the 70 percent stochastic threshold at 30,482.22 sit together. Two standard deviations support at 30,429.04 and Pivot S1 at 30,415.17 follow. Beneath that, three standard deviations support at 30,387.64, Tuesday's 30,372.25 low and Monday's 30,356.75 low form a 30.89 point band. The 38.2 percent retracement at 30,314.80 and the cash desk note's 30,000 primary gamma concentration, about 30,273.92 in futures terms, come next, with Pivot S2 at 30,217.08 beneath them.
Globex has reopened. The Wednesday session opened at 30,657.25 at 6:00 PM ET, 44.00 points above the settle, and the provider's overview showed a high of 30,703.25 and a low of 30,655.00 for the new session at the time of reading. None of those values is used as Tuesday's range. Chinese manufacturing survey data and Australian consumer prices are listed at 9:30 PM ET on the news-feed calendar and unconfirmed. Tuesday's evening session drifted lower to the session low, so the first test is whether the reopen holds above the 30,570.33 Pivot Point. Bias reads neutral to mildly higher above 30,570, with an expected Globex band of roughly 30,480 to 30,760.
Europe comes next. United Kingdom output data at 2:00 AM ET, French consumer prices at 2:45 AM ET, German unemployment at 3:55 AM ET and German consumer prices at 8:00 AM ET, forecast 3.1 percent year on year, are all listed on the news-feed calendar and unconfirmed. Tuesday's recovery toward the high came in this window. Bias neutral, with an expected band of roughly 30,450 to 30,780.
Then the data. The private payroll survey is listed at 8:15 AM ET, forecast 74,000 against 38,000, on the news-feed calendar and unconfirmed. The calendar lists the personal income and outlays report and the third estimate of second-quarter output at 8:30 AM ET, and the news-feed calendar lists core price-index forecasts of 3.3 percent year on year and 0.3 percent month on month. The cash open at 9:30 AM ET sets the session's first directional test after those releases. The Chicago purchasing managers' index is listed at 9:45 AM ET, forecast 51 against 47.1, on the news-feed calendar and unconfirmed, and the calendar lists the weekly petroleum status report at 10:30 AM ET. A firm price-index print that lifts yields again points the contract back toward the 30,415 to 30,483 band. A soft print keeps the 30,743.51 to 30,797.46 band in reach. The morning band runs roughly 30,400 to 30,800.
Quarter-end closes the afternoon. A regional Federal Reserve president is listed at 1:30 PM ET on the news-feed calendar and unconfirmed, and the calendar lists a Federal Reserve governor at 3:25 PM ET. Wednesday is the last session of the quarter, and the desk note flagged quarter-end pension rebalancing. The afternoon band runs roughly 30,450 to 30,800 into the 4:00 PM ET settle.
Chips return after the bell. The memory-chip maker reports after the equity close, with the call at 4:30 PM ET, which the calendar lists; as a large semiconductor name its release is a direct input for the index. Further Federal Reserve speakers are listed at 5:10 PM ET and 6:00 PM ET on the news-feed calendar and unconfirmed. The calendar lists the employment report at 8:30 AM ET on October 2, 2026. For Wednesday the review singles out one first-order event: the personal income and outlays report at 8:30 AM ET, read through its effect on the ten-year yield, with the memory-chip results after the close as the second.
Scenario bands overlap heavily. Across the full session the low-range case runs 30,500 to 30,760, the mid-range and most likely case 30,400 to 30,820 and the high-range case 30,150 to 31,070. In this review's analyst judgment the most probable path holds the Globex session above the 30,570.33 Pivot Point, and the 8:30 AM ET personal income and outlays report on September 30, 2026 sets the direction of the United States session. In the same judgment a settle between 30,482.99 and 30,768.42 is weighted above a settle outside that band. Tuesday was an inside day that settled at 68.2 percent of its range. The composite read holds at 88 percent buy. The semiconductor index led. Yields remain near their highs, though. A firm price-index print that lifts the ten-year yield above Tuesday's 5.29 percent session high (provider record read at 6:46 PM ET) would invalidate this reading and put the 30,356.75 to 30,372.25 lows back in play.
The price-index report lands at 8:30 AM ET with the ten-year 3 basis points beneath its 5.29 percent session high.
The complete data picture
Every number behind Wednesday’s plan, charted first, then the full level map, then the complete numeric reference underneath.
Cash-index levels at the measured 273.92 point basis: the 30,500 cash key level translates to about 30,773.92 in futures and the 30,000 primary gamma concentration to about 30,273.92. No other cash level is translated.
Full numeric reference, every remaining figure from the session review
3.1 Resistance, level by level
The first overhead references are the 30,657.25 reopen and the 9-day average crossing at 30,666.34, followed by the stochastic 80 percent threshold at 30,686.40 and Tuesday's 30,725.50 high. One standard deviation resistance at 30,743.51 and Pivot R1 at 30,768.42 sit 24.91 points apart, and the cash index's 30,500 mapped level, translated with the measured basis of 273.92 points, sits at about 30,773.92 in futures terms.
Above that, two standard deviations resistance at 30,797.46, three standard deviations resistance at 30,838.86 and the 14-day %k stall at 30,858.08 form the next band, with the three-and-ten day crossover stall at 30,911.54, Monday's 30,920.75 high and Pivot R2 at 30,923.58 above it. The four-week high of 31,094.75 and Pivot R3 at 31,121.67 are the extended references.
3.2 Support, level by level
The published target price at 30,585.11 and the Pivot Point at 30,570.33 sit directly beneath the settle, with the 9-day settlement average at 30,563.75 6.58 points lower. One standard deviation support at 30,482.99 and the stochastic 70 percent threshold at 30,482.22 sit together, and two standard deviations support at 30,429.04 and Pivot S1 at 30,415.17 follow.
Beneath that, three standard deviations support at 30,387.64, Tuesday's 30,372.25 low and Monday's 30,356.75 low form a 30.89 point band. The 38.2 percent retracement from the four-week high at 30,314.80 and the cash index's 30,000 primary gamma concentration, about 30,273.92 in futures terms at the measured basis, follow, with Pivot S2 at 30,217.08 beneath them.
1. Executive Summary
The December Nasdaq-100 contract settled at 30,613.25 on Tuesday, up 47.00 points or 0.15 percent from Monday's 30,566.25 settle. The daily row spans 30,725.50 to 30,372.25, a 353.25 point range, and the settle finished at 68.2 percent of it. Tuesday was an inside day against Monday's 564.00 point session, and the range was 0.75 times the published 14-day average daily range of 471.75 points. The cash index closed at 30,339.33, up 62.52 points or 0.21 percent, while the S&P 500 cash index fell 0.17 percent, so technology outperformed the broad index on the day.
The preserved 30-minute series shows the path. From the Monday 6:00 PM ET reopen at 30,560.50 the contract drifted lower through the evening and printed the 30,372.25 session low in the 1:30 AM ET bar. It then recovered through the European morning to 30,717.75 in the 8:00 AM ET bar, and the 9:30 AM ET bar, which contained the cash open, spanned 30,725.50 to 30,545.50, taking in the session high. The United States session then rotated beneath 30,700: the 12:30 PM ET bar reached a 30,504.50 low for the cash hours, the 2:00 PM ET bar opened at 30,522.75 and reached 30,621.75, and the contract settled at 30,613.25 at 4:00 PM ET.
The macro backdrop pulled in two directions. The ten-year yield index printed a 5.29 percent session high (provider record read at 6:46 PM ET), a new 19-year high in provider commentary, and the dollar index closed at a two-month high, while the job openings report and the consumer confidence index both came in beneath forecast and crude fell 3.48 percent. The semiconductor index rose 1.32 percent and provider commentary cited strength in chipmakers. The composite multi-indicator read is unchanged at 88 percent buy.
The Primary Setup below is a long from the 30,560 to 30,600 band around the Pivot Point and the published target price, stopped beneath Pivot S1 at 30,415.17, with objectives at 30,760, 30,940 and an extended 31,120.
2.1 Intraday and Session Review
The Tuesday session opened at 30,560.50 at the Monday 6:00 PM ET reopen, 5.75 points beneath Monday's settle, marked a high of 30,725.50 and a low of 30,372.25, and settled at 30,613.25 at 4:00 PM ET. The preserved 30-minute provider series, 46 bars from the reopen through the 4:30 PM ET bar, places the low in the 1:30 AM ET bar and the high in the 9:30 AM ET bar, so the session made its low first and its high eight hours later, and both extremes fall before the settle.
The evening bars carried the contract from the 30,616.00 high of the 6:00 PM ET bar down to 30,409.25 in the 11:00 PM ET bar and to the 30,372.25 low in the 1:30 AM ET bar. The 2:00 AM ET bar opened at 30,432.50 and reached 30,527.75, and the European hours extended the recovery to 30,635.25 in the 4:00 AM ET bar and 30,717.75 in the 8:00 AM ET bar. The 9:30 AM ET bar, which contained the cash open, spanned 30,725.50 to 30,545.50 and closed at 30,608.25; the series does not show the order of those two prints inside the bar.
The 10:00 AM ET bar, which contained the job openings and consumer confidence releases, traded from 30,589.25 to 30,698.50 and closed at 30,670.00. The 11:00 AM ET bar opened at 30,663.00 and traded down to 30,531.25, and the 12:30 PM ET bar reached 30,504.50, the low of the cash hours. The 2:00 PM ET bar opened at 30,522.75 and reached 30,621.75, a move that coincided with a 2:00 PM ET news-feed item in which the New York Fed president said one further rate increase is likely this year if the economy meets expectations; the series does not establish causation. The contract settled at 30,613.25, and electronic trade after the settle closed the 4:30 PM ET bar at 30,652.75. The Wednesday session reopened at 30,657.25.
The session extremes used here are the completed-session inputs behind the published pivot ladder and were not read independently from a bar, back-solved from the outer pivot pairs and verified against every rung. The third resistance point at 31,121.67 minus the third support point at 30,061.92, divided by three, returns 353.25, and the second resistance point at 30,923.58 minus the second support point at 30,217.08, divided by two, returns the same 353.25. Three times the Pivot Point of 30,570.33 less the 30,613.25 settle gives a high plus low sum of 61,097.74, and the resulting pair of 30,725.50 and 30,372.25 reproduces all seven published rungs. The chart's completed Tuesday daily bar reads 30,560.50, 30,725.50, 30,372.25 and 30,613.25, an independent confirmation of the same values. The provider's cheat sheet carried a Tuesday date in its header while being built on the Tuesday session; the arithmetic above shows the ladder applies to Wednesday.
Because Globex reopened at 6:00 PM ET, the provider's overview page now shows the Wednesday session: its open of 30,657.25, high of 30,703.25 and low of 30,655.00 belong to the new session and are not used as Tuesday's range anywhere in this review.
2.2 Daily Structure
Tuesday traded entirely inside Monday's range: the 30,725.50 high sits beneath Monday's 30,920.75 high, and the 30,372.25 low sits 15.50 points above Monday's 30,356.75 low. The settle recovered 47.00 of Monday's 323.00 point loss. The prior week, September 21 through September 25, spanned 31,094.75 to 29,904.00, and Tuesday sits inside it.
Across five sessions the contract lost 415.25 points or 1.34 percent from the 31,028.50 settle of 09/22. The one-month and 13-week high of 31,094.75, set on 09/23/26, sits 481.50 points above the settle, and the one-month low of 29,053.00, set on 09/16/26, sits 1,560.25 points beneath it.
No prior-quarter high or low was captured, so the 13-week extremes serve as the available quarterly reference.
2.3 4-Hour and Swing Structure
The daily settlement sequence from 09/18 reads 29,917.25, 30,784.75, 31,028.50, 30,764.75, 30,766.75, 30,889.25, 30,566.25 and 30,613.25. The swing high remains the 31,094.75 high of 09/23, and the swing low inside the pullback is Monday's 30,356.75, which Tuesday approached without breaking. Daily ranges for the last seven sessions ran 958.75, 395.50, 452.00, 457.50, 320.50, 564.00 and 353.25.
The retracement grid published for Wednesday places the 38.2 percent retracement from the four-week high at 30,314.80 and the 50 percent retracement of the four-week range at 30,073.88. No four-hour series was captured; the 30-minute series in section 2.1 is the only intraday evidence used.
2.4 Moving Averages
The averages cited in this subsection were computed from the provider's daily settlement series for the December contract, which holds 259 completed sessions through Tuesday, and are shown to two decimals. The 5-day average stands at 30,720.05, the 9-day at 30,563.75, the 20-day at 30,014.28, the 50-day at 29,721.05, the 100-day at 29,935.52 and the 200-day at 28,003.10. The 200-day figure spans sessions in which the December contract was deferred and thinly traded, so it carries that caveat.
The 30,613.25 settle sits 106.80 points beneath the 5-day average and 49.50 points above the 9-day, and about 599 points above the 20-day. The 9-day average rose 150.72 points from Monday because the 09/16 settle of 29,256.75 left its window, and the 5-day fell 83.05 points as the 09/22 settle of 31,028.50 left. The 100-day average sits above the 50-day, which means the older 50 settles in the 100-day window averaged about 30,150.00, higher than the latest 50.
The projection grid gives the prices at which each average would be crossed on Wednesday: 30,666.34 for the 9-day, 30,092.53 for the 18-day and 29,964.53 for the 40-day.
2.5 Oscillator and Trend Readings
The oscillator figures below are as published on the provider's technical page dated for the Wednesday session, which was read after the 6:00 PM ET reopen, so the most recent value in each may include live Globex trade after the settle. Relative strength reads 59.93 on the 9-day, 58.59 on the 14-day and 56.81 on the 20-day.
Stochastics sit in the upper part of their range. The 9-day raw stochastic reads 73.93 percent and the 14-day 76.42 percent, with the 14-day %K at 80.16 percent and %D at 82.91 percent. The published grid places the 14-3 day raw stochastic 70 percent threshold at 30,482.22 and its 80 percent threshold at 30,686.40.
The directional system leans positive with a weak trend reading. On the 9-day the directional index reads 23.67 with positive direction at 25.09 and negative direction at 19.50; on the 14-day it reads 16.21 with positive direction at 24.33 against negative at 19.87. Historic volatility reads 17.53 percent on the 9-day and 17.07 percent on the 14-day.
The composite multi-indicator read published for Wednesday is 88 percent buy, unchanged from the prior session's snapshot, with signal strength described as weak and direction as average. The snapshot history reads 72 percent buy a week ago and 40 percent buy a month ago. The short-horizon and medium-horizon groups each average 100 percent buy and the long-horizon group 33 percent buy.
2.6 Volatility and Expected Range
The published 14-day average true range stands at 459.38 points, 1.50 percent of the settle, and the 14-day average daily range at 471.75 points; the 9-day average true range is 453.21 and the 20-day is 475.20. Tuesday's 353.25 point range was 0.75 times the 14-day average daily range.
The 14-day average true range of 459.38 points, applied either side of the 30,613.25 settle, frames Wednesday between 30,153.87 and 31,072.63. The published standard-deviation bands are built from five settlements: one deviation spans 30,482.99 to 30,743.51, two spans 30,429.04 to 30,797.46 and three spans 30,387.64 to 30,838.86. The desk note's implied one-day move of 0.67 percent for the broad index is the only options-implied range captured.
4.1 Mag7 Earnings and AI Capex Cycle
The equities feed carried a meeting between the President and technology chief executives between 3:44 PM and 4:11 PM ET, in which he said an artificial-intelligence coordinator would be named in three to four days, discussed data-center locations and was reported alongside the graphics-chip maker's chief executive, who said there is no conflict between artificial-intelligence innovation and safety. After the close the feed carried reports on an artificial-intelligence developer's listing filing and on 30 billion dollars of new credit facilities for an electric-vehicle maker. None of these items moved the settled contract, since most arrived near or after the 4:00 PM ET settle. The memory-chip maker's quarterly results follow the close on September 30, 2026 with the call at 4:30 PM ET, as the calendar lists it.
4.2 Semiconductor Cycle and Tech Sector Rotation
The semiconductor index closed at 12,629.16, up 163.92 points or 1.32 percent, per the provider's daily record, and provider commentary cited strength in chipmakers as a support for the broad market. The Nasdaq-100 cash index outperformed the S&P 500 cash index by about 0.37 percentage points, 0.21 percent against minus 0.17 percent. In this review's interpretation the semiconductor gain carried the index while the broader market absorbed the rate pressure.
4.3 Fed Policy and Real Yields (Duration Sensitivity)
The ten-year yield index closed at 5.26 percent, up 2 basis points, after a 5.29 percent session high (provider record read at 6:46 PM ET), and the thirty-year closed at 5.59 percent; the desk note said thirty-year yields reached their highest level since 2002. In a 2:00 PM ET news-feed item the New York Fed president said one further rate increase is likely this year if the economy meets expectations, and in a 4:05 PM ET item he said rising yields show tighter financial conditions at the margin. The desk note reported that the priced probability of an October increase fell to 45 percent from 70 percent after his remarks, and provider commentary gave 52 percent; the two sources disagree and neither is used as a level input. No real-yield series was captured.
4.4 Geopolitical Backdrop
The United States and Iran negotiations remained unresolved in the captured reporting: a press report on the news feed at 2:31 PM ET said mediators are pushing to break the deadlock, and the Iranian president's office said at 3:24 PM ET that Iran will not compromise on nuclear rights. A press report at 7:49 AM ET said the President backs Russia sanction relief tied to a prisoner release. Crude's 3.48 percent decline eased part of the energy pressure on inflation expectations.
4.5 Cross-Asset and Volatility
The volatility index closed at 16.04, down 0.03, and its own volatility index at 89.71, down 1.31. The dollar index closed at 101.37, a two-month high in provider commentary. Crude's November contract settled at 89.38 and gold's December contract at 4,179.7, up 0.27 percent. The job openings report showed 7.079 million openings against a 7.2275 million forecast, and consumer confidence printed 81.9 against 89, per the news-feed calendar; provider commentary described the latter as a 12-year low. A news-feed market wrap described stocks and bonds as falling on inflation concerns that kept yields elevated.
4.6 Institutional Positioning
No weekly positioning figures for the Nasdaq-100 contract were captured, so none is asserted. The composite read's 88 percent buy and the fund's options book in section 5 are the positioning inputs available.
5. QQQ Options Flow Context (Proxy)
The technology exchange-traded fund and the cash index are the flow surfaces for this contract; the review uses the fund and the cash index as the proxy for the positioning dataset available. Levels from them are cash or fund values and are translated into futures terms only with the measured basis of 273.92 points stated, which is Tuesday's 30,613.25 settlement less the 30,339.33 cash close, both at 4:00 PM ET.
The desk note used here is the edition published at 5:18 PM ET on Tuesday, September 29. Its reference price column is the prior session's close, not Tuesday's, and it checks out: the cash index reference of 30,276 matches Monday's 30,276.81 cash close, and the fund reference of 736 matches Monday's 736.53 close. For the fund the model reads a modeled volatility threshold at 736, a modeled gamma-flip level at 740, a primary gamma concentration at 730, a call-side ceiling at 760 and a put-side base at 730, with gamma tilt 0.897 and gamma notional minus 280.55 million dollars. The fund closed at 737.93 on the provider's daily record, 1.93 above the modeled volatility threshold and 2.07 beneath the modeled gamma-flip level.
For the cash index the model reads a modeled volatility threshold at 29,450, a modeled gamma-flip level at 29,748 and a primary gamma concentration at 30,000, with gamma tilt 1.418 and gamma notional 9.617 million dollars. The published call-side and put-side fields for the cash index, 29,475 and 29,500, sit beneath the cash close and invert their usual order, so they are recorded and not used for level structure. The mapped key levels are 30,000, 29,475, 30,500 and 29,500, and the mapped confluence levels are 30,004, 30,610, 30,216 and 31,246. The cash close sits 339.33 points above 30,000 and 160.67 points beneath 30,500.
The fund's positioning console, dated 2026-09-29, showed a current price of 738.98 against a previous close of 736.53, call gamma of minus 765 million dollars, put gamma of minus 3 billion dollars and next-expiry gamma at 15.48 percent of the total. The console's high-volatility-point and low-volatility-point fields are excluded as low-confidence per the known defect in that pair of fields. Both the desk table's gamma notional and the console's aggregate read negative for the fund tonight. In this review's interpretation the fund sitting between its modeled volatility threshold and its modeled gamma-flip level leaves dealer hedging with little dampening effect into Wednesday's data.
6.1 Night Session (6:00 PM ET Tuesday to 3:00 AM ET Wednesday, Globex and Asia)
The Wednesday session reopened at 30,657.25 at 6:00 PM ET, 44.00 points above the settle. Chinese manufacturing survey data and Australian consumer prices are listed at 9:30 PM ET, per the news-feed calendar and unconfirmed. Tuesday's evening session drifted lower to the session low, so the first test is whether the reopen holds above the 30,570.33 Pivot Point. Bias neutral to mildly higher above 30,570, expected Globex band roughly 30,480 to 30,760.
6.2 London Session (3:00 AM to 8:00 AM ET Wednesday)
The European morning carries German unemployment at 3:55 AM ET and German consumer prices at 8:00 AM ET, forecast 3.1 percent year on year, both per the news-feed calendar and unconfirmed. Tuesday's recovery toward the high came in this window. Bias neutral, expected band roughly 30,450 to 30,780.
6.3 Morning Session (9:30 AM to 12:00 PM ET Wednesday, RTH Open)
The private payroll survey at 8:15 AM ET, forecast 74,000, is listed per the news-feed calendar and unconfirmed, and the personal income and outlays report is scheduled for 8:30 AM ET, as the calendar lists it, with a core year-on-year forecast of 3.3 percent on the news-feed calendar. The cash open at 9:30 AM ET sets the session's first directional test after those releases. A firm price-index print that lifts yields again points the contract back toward the 30,415 to 30,483 band; a soft print keeps the 30,743.51 to 30,797.46 band in reach. Expected band roughly 30,400 to 30,800.
6.4 Afternoon Session (12:00 PM to 4:00 PM ET Wednesday)
A regional Federal Reserve president is listed at 1:30 PM ET, per the news-feed calendar and unconfirmed, and a Federal Reserve governor speaks at 3:25 PM ET, as the calendar lists it. Wednesday is the last session of the quarter, and the desk note flagged quarter-end pension rebalancing. Expected band roughly 30,450 to 30,800 into the 4:00 PM ET settle.
6.5 Night Session Forward (6:00 PM ET Wednesday)
The memory-chip maker's quarterly results follow the equity close with the call at 4:30 PM ET, as the calendar lists it; as a large semiconductor name the release is a direct input for the index. Further Federal Reserve speakers are listed at 5:10 PM ET and 6:00 PM ET, per the news-feed calendar and unconfirmed. The employment report is scheduled for 8:30 AM ET on October 2, 2026, as the calendar lists it.
6.6 Expected Range (Wednesday Full Session)
Low-range scenario: 30,500 to 30,760; Mid-range scenario (most likely): 30,400 to 30,820; High-range scenario: 30,150 to 31,070.
6.7 Most Likely Path
In this review's analyst judgment the most probable path holds the Globex session above the 30,570.33 Pivot Point, and the personal income and outlays report at 8:30 AM ET on September 30, 2026, as the calendar lists it, sets the direction of the United States session. A settle between 30,482.99 and 30,768.42 is weighted above a settle outside that band, because Tuesday was an inside day that settled at 68.2 percent of its range, the composite read holds at 88 percent buy and the semiconductor index led, while yields remain near their highs. The alternative that would invalidate this reading is a firm price-index print that lifts the ten-year yield above Tuesday's 5.29 percent session high (provider record read at 6:46 PM ET), which would put the 30,356.75 to 30,372.25 lows back in play.
7. Wednesday Economic Calendar
The Wednesday session reopened at 6:00 PM ET Tuesday. Chinese manufacturing survey data and Australian consumer prices are listed at 9:30 PM ET, per the news-feed calendar and unconfirmed. The European morning lists United Kingdom output data at 2:00 AM ET, French consumer prices at 2:45 AM ET, German unemployment at 3:55 AM ET and German consumer prices at 8:00 AM ET, all per the news-feed calendar and unconfirmed.
The United States morning carries the private payroll survey at 8:15 AM ET, forecast 74,000 against 38,000, per the news-feed calendar and unconfirmed, then the personal income and outlays report and the third estimate of second-quarter output at 8:30 AM ET, both as the calendar lists it; the news-feed calendar lists core price-index forecasts of 3.3 percent year on year and 0.3 percent month on month. The Chicago purchasing managers' index is listed at 9:45 AM ET, forecast 51 against 47.1, per the news-feed calendar and unconfirmed, and the weekly petroleum status report follows at 10:30 AM ET, as the calendar lists it. A regional Federal Reserve president is listed at 1:30 PM ET, per the news-feed calendar and unconfirmed, and a Federal Reserve governor speaks at 3:25 PM ET, as the calendar lists it. The memory-chip maker's results follow the equity close with the call at 4:30 PM ET, as the calendar lists it.
The single first-order event for the contract on Wednesday is the personal income and outlays report at 8:30 AM ET, through its effect on the ten-year yield, with the memory-chip maker's results after the close as the second.
8. Primary Trade Setup
Direction: Long
Rationale: Tuesday was an inside day that settled at 68.2 percent of its range, the cash index outperformed the broad index with the semiconductor index up 1.32 percent, and the composite read holds at 88 percent buy; a pullback into the Pivot Point at 30,570.33 and the published target price at 30,585.11 offers a long with a defined risk point beneath Pivot S1 at 30,415.17. Yields sit near 19-year highs ahead of the price-index report, so the setup is an analyst judgment against a live rate risk.
Entry Zone: 30,560 to 30,600
Stop Loss: 30,400 (beneath Pivot S1 at 30,415.17 and above Tuesday's 30,372.25 low)
Target 1 (T1): 30,760 (above one standard deviation resistance at 30,743.51 and beneath Pivot R1 at 30,768.42)
Target 2 (T2): 30,940 (above Pivot R2 at 30,923.58)
Target 3 (T3, extended): 31,120 (above the four-week high of 31,094.75 and beneath Pivot R3 at 31,121.67)
Risk-to-Reward: Approximately 1:1 to T1, 1:2 to T2, 1:3 to T3
Invalidation: A settle beneath Pivot S1 at 30,415.17 negates the thesis. Short of that, the edge is removed by acceptance beneath the 30,482.99 one standard deviation support, defined as two consecutive 30-minute closes beneath 30,482.99.
Macro override: A firm price-index print that lifts the ten-year yield above Tuesday's 5.29 percent session high (provider record read at 6:46 PM ET) would restore the rate pressure. In that scenario the long is wrong immediately, and the 30,217.08 Pivot S2 becomes the reference within one 14-day average true range of 459.38 points.
Alternate setup: the session review states none.
Sources and methodology
This outlook is built from our session review of the December E-mini Nasdaq-100 contract, NQZ26, the December ’26 contract, prepared after Tuesday's close on September 29, 2026 for the Wednesday, September 30 session. The contract was verified before any level was used: the reopened daily chart title read 30,682.50 with a stated change of plus 0.23 percent, which returns 30,613.25, equal to the provider's published previous close, and the chart's completed Tuesday daily bar equals the provider's settlement row. Because Globex reopened at 6:00 PM ET, the day high, day low and open on the provider's overview belong to the Wednesday session and are never presented as Tuesday's range. Tuesday's extremes are the completed-session inputs behind the published pivot ladder, back-solved from the outer pivot pairs, verified against all seven rungs and reproduced by the chart's daily bar. The published level sheet carried a Tuesday date in its header while being built on the Tuesday session; the arithmetic shows the ladder applies to Wednesday. Statements about the order of prices within Tuesday's session rest on the preserved 30-minute provider series, which also orders the prints used to grade the prior card.
The settlement averages were computed from the provider's 259-row daily settlement series and are shown to two decimals; that series also supplies the seven closes charted above. Volume and open interest come from the provider's daily record: the 2026-09-29 row reads preliminary volume of 572,387 contracts with open interest not yet published, and the 2026-09-28 row now reads volume of 678,480 and open interest of 271,485, where Tuesday's outlook carried a preliminary 662,634. The oscillator readings are cited as published, with the reopen caveat. The desk note's reference column was verified as the prior session's close. Cash-denominated levels are translated with the measured 273.92 point basis, settlement against cash close, both at 4:00 PM ET. The inverted cash-index call-side and put-side fields and the console's volatility-point fields are excluded from the level structure. The dollar index change is computed against its 101.20 prior close on the provider's record. The 52-week high cited is 31,336 on the December contract. Every catalyst whose release time had passed when data collection began, at 6:20 PM ET, is recorded as completed. Scenario ranges, session bands and the path weighting are analyst judgment and carry no calibration. Items marked unconfirmed come from the news-feed calendar or press reports and were not matched on the calendar used for confirmed times.
Tuesday’s outlook for this contract is here and the broad-index outlook for the same date is here. Outlooks for ES, NQ, GC and CL are collected on the market outlook page, and our forward trading record is on the performance statement.



