
At 5.27 percent, the ten-year yield index printed what provider commentary described as a 19-year high on Monday. It closed at 5.24 percent, up 6 basis points. Provider commentary cited market pricing of a 70 percent chance of a quarter-point increase at the October 27 to 28 policy meeting. The December S&P 500 contract set its 7,803.00 high in the first 30-minute bar after the Sunday 6:00 PM ET reopen and its 7,726.00 low in the 10:30 AM ET bar, the third bar of the cash session. The review reads rates as the day's driver.
December E-mini futures settled at 7,746.75, down 57.00 points or 0.73 percent from Friday's 7,803.75. It was the largest one-day decline since the 59.25 point drop of 09/23 and the lowest settle since 7,712.50 on 09/18. The 77.00 point range was 0.96 times the 14-day average daily range of 80.04 and the widest since the 84.50 point session of 09/23. The settle landed at 26.9 percent of it. Bottom-third close. The cash index closed at 7,683.69, down 59.72 points or 0.77 percent, after a 7,666.60 to 7,724.15 range.
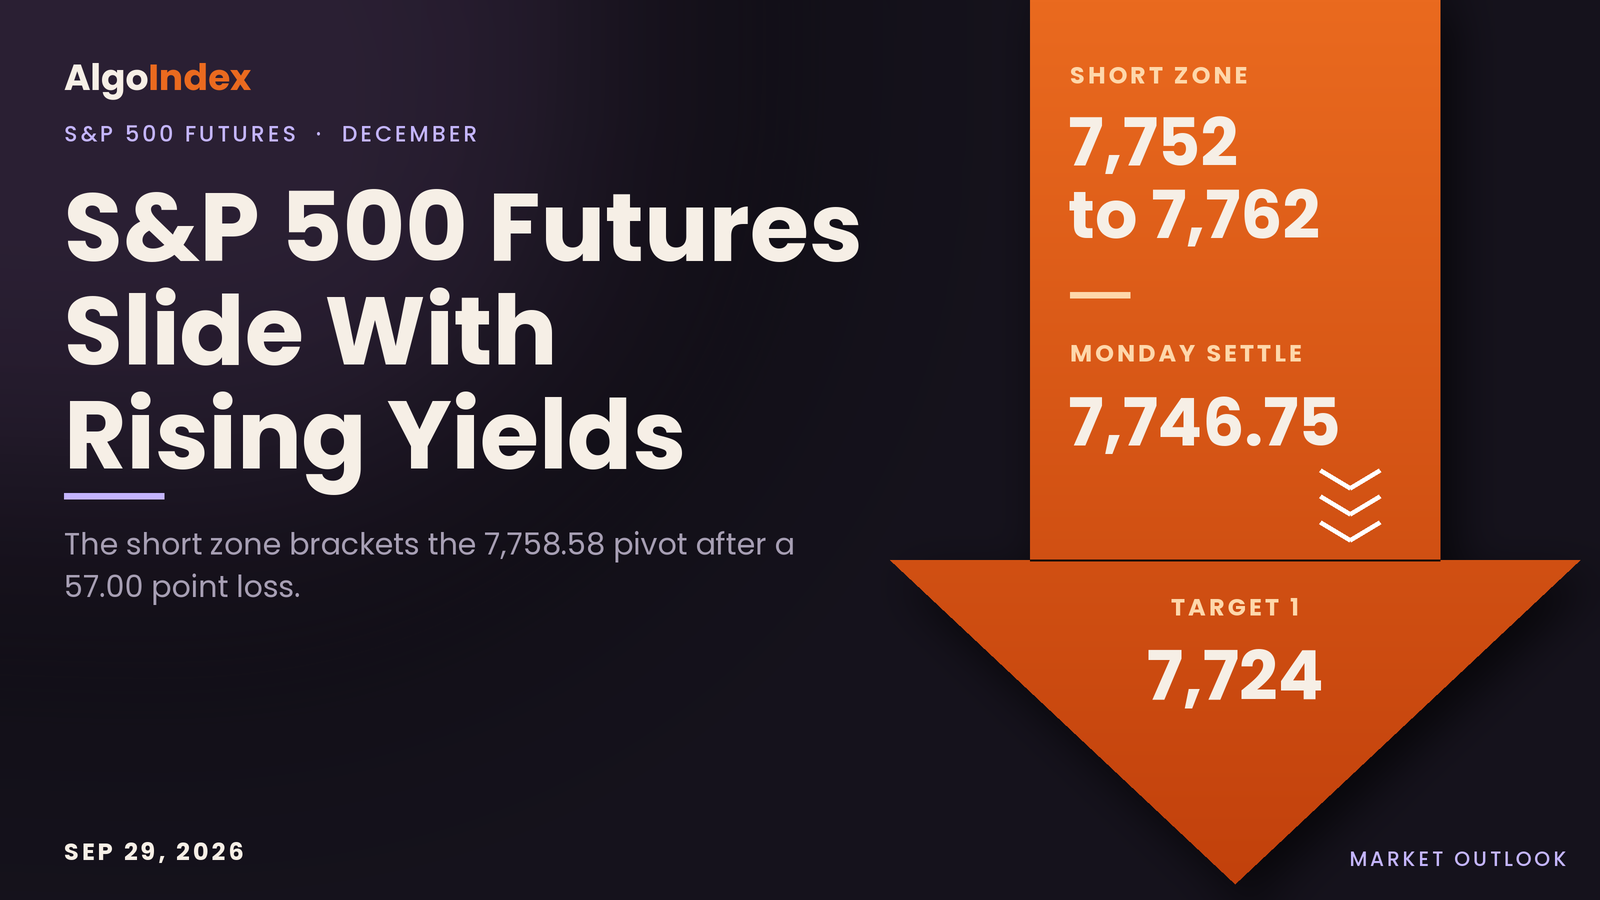
December S&P 500 futures settled at 7,746.75, 11.83 points beneath the 7,758.58 Pivot Point and 37.60 points beneath the 5-day settlement average at 7,784.25. The first overhead pair is the 7,753.06 futures equivalent of the positioning note's 7,690 cash reference level and the Pivot Point. The primary setup is a short from 7,752 to 7,762, stop 7,790, targets 7,724, 7,691 and an extended 7,658. The cash index closed 6.31 points beneath the 7,690 reference level, 31.31 points beneath the 7,715 modeled volatility threshold and 43.69 points above the 7,640 modeled gamma flip. Tuesday's first-order event is the job openings report at 10:00 AM ET, per the verified forward calendar.
Friday's short card against a 7,814.75 high
Friday's outlook set a short from 7,780 to 7,794, stop 7,819, targets 7,755, 7,723 and 7,691. Friday's completed bar, from tonight's review and the provider's dated 2026-09-25 row, opened at 7,759.00, reached 7,814.75, fell to 7,748.50 and settled at 7,803.75. The whole band traded. The open sat 21.00 points beneath the bottom of the zone, and the high went 20.75 points through its 7,794 top. The 7,819 stop was not touched; the high finished 4.25 points beneath it.
The first target traded as well. Friday's low of 7,748.50 sat 6.50 points beneath the 7,755 first target. The 7,723 second target stayed 25.50 points under the low and the 7,691 third target 57.50 points under it. Tonight's review carries no intraday series for Friday, so whether the low came before or after the band traded is not established here, and no fill or result is asserted.
The settle decided the card. At 7,803.75 it finished 9.75 points above the top of the zone and 5.83 points above Pivot R1 at 7,797.92. The cash index closed Friday at 7,743.41, 28.41 points above 7,715. So the card's own invalidation line, a settle above 7,797.92 with the cash index back above 7,715, was met at the close, and the thesis was negated on its own terms. Its intraday leg, two consecutive 30-minute closes above 7,794, cannot be graded without Friday's 30-minute series.
The map fared better. In Friday's outlook we called the 7,752.58 Pivot Point the most important line in the instrument; Friday's low went 4.08 points through it, to 7,748.50, and the settle finished 51.17 points above it. The one-range envelope we published, 7,689.54 to 7,844.46, held the whole session. So did the one standard deviation band of 7,716.35 to 7,817.65, with the high 2.90 points inside its top edge. Of the three scenario bands, only the high-range case of 7,690 to 7,830 contained the session. The high cleared the 7,800 top of the most likely band by 14.75 points and the 7,790 top of the low-range band by 24.75, and the settle finished 3.75 points above 7,800.
The card's macro override named a soft durable goods print or a dovish Federal Reserve speaker pulling the ten-year yield back toward 5.10 percent, or a weekend Strait agreement. Tonight's review carries neither the durable goods print nor Friday's yield close, so that leg is not graded here.
No outlook was published for Monday. Monday's session is the next one on this map, and it reversed Friday's work. The 57.00 point loss erased Friday's 36.75 point gain and left the settle 20.25 points beneath Thursday's 7,767.00.
The day opened at 7,796.00 at the Sunday 6:00 PM ET reopen, 7.75 points beneath Friday's settle, and printed its 7,803.00 high in that first 30-minute bar. Overnight bars through the 6:30 AM ET bar held between 7,757.00 and 7,803.00. European hours recovered to 7,781.75 in the 8:30 AM ET bar. The 9:30 AM ET bar, which holds the cash open, traded from 7,758.75 to 7,775.25, and the 10:00 AM ET bar from 7,759.25 to 7,773.75.
Then the break. The 10:30 AM ET bar fell to the 7,726.00 low and closed at 7,730.75. The 12:00 PM ET bar rebounded to 7,786.25. That bar coincided with crude's midday reversal lower and with a news item at 12:16 PM ET quoting a United States official on the Iran talks. The 1:00 PM ET bar reached 7,783.50. From 2:00 PM ET to 3:30 PM ET the bars traded between 7,739.25 and 7,766.50, and the contract drifted into the 4:00 PM ET settle. Post-settlement trade in the 4:30 PM ET bar held between 7,740.50 and 7,748.00.
Both extremes sat beneath Friday's. The high was 11.75 points under Friday's 7,814.75 and the low 22.50 points under Friday's 7,748.50, and the settle finished 1.75 points beneath Friday's low. Monday's low held 18.75 points above Thursday's 7,707.25. Across five sessions the contract lost 86.75 points, or 1.11 percent, from the 7,833.50 settle of 09/21. The prior week, September 21 through September 25, spanned 7,707.25 to 7,848.50, and Monday stayed inside it.
The 7,758.58 pivot and a 7,753.06 reference line
The basis does the translating. Monday's 7,746.75 settle less the 7,683.69 cash close, both at 4:00 PM ET, measures 63.06 points. At that basis the positioning note's 7,690 cash reference level lands at 7,753.06, 5.52 points beneath the Pivot Point at 7,758.58. Those two lines form the first test overhead, and the 7,752 to 7,762 entry band wraps both. Just above sit the 7,763.06 equivalent of the note's 7,700 cash level, which the note lists as support and which now sits above the cash close, and the 7,766.45 threshold for a 70 percent stochastic reading.
Then the crossings. The 9-day average would be crossed at 7,771.88 on Tuesday and the 40-day at 7,772.69. The modeled volatility threshold, 7,715 in cash, translates to 7,778.06 at the measured basis; the source's own futures pair reads 7,775.8 at its fixed 60.8 offset. One standard deviation resistance at 7,780.21 sits beside it. The setup stop at 7,790 sits above that group and 1.17 points beneath Pivot R1 at 7,791.17.
Monday's high caps the next group. Pivot R1 and two standard deviations resistance at 7,794.07 sit together beneath the 7,803.00 high, and three standard deviations resistance at 7,804.70 sits 1.70 points above it. Higher references are extended. The note's 7,760 cash resistance translates to 7,823.06, Pivot R2 sits at 7,835.58 and the one-month high of 7,848.50, set on 09/22/26, is 101.75 points above the settle. The 7,800 call-side ceiling translates to 7,863.06, with the source's pair at 7,860.8, and Pivot R3 sits at 7,868.17. The primary gamma concentration at 8,000 in cash carries a source pair of 8,060.8.
Support starts almost on the settle. The 38.2 percent retracement from the four-week high at 7,744.02 sits 2.73 points beneath it. The 18-day crossing at 7,741.56, the 20-day average at 7,741.25, the 7,738.06 equivalent of the note's 7,675 cash support and the published target price at 7,735.78 follow, all within 10.97 points of the settle. Monday's 7,726.00 low comes next. Beneath it sit the 50-day average at 7,724.25, Pivot S1 at 7,714.17, one standard deviation support at 7,713.29 and the 7,711.75 midpoint of the four-week range.
The model boundary is lower. The modeled gamma-flip level, 7,640 in cash, translates to 7,703.06 at the measured basis, with the source's own pair at 7,700.8. Two standard deviations support at 7,699.43 and three at 7,688.80 sit beneath it, then Pivot S2 at 7,681.58 and the 38.2 percent retracement from the four-week low at 7,679.48. The tail runs lower. The note's 7,600 cash support translates to 7,663.06, the 100-day average sits at 7,660.75 and Pivot S3 at 7,637.17 is the extended reference. The note's broader 7,400 cash level, 7,463.06 in futures terms, is its stated downside tail.
Two averages now sit overhead. The 5-day at 7,784.25 is 37.60 points above the settle and the 9-day at 7,755.25 is 8.58 above. Beneath it, the 20-day at 7,741.25 sits 5.44 points away, the 50-day at 7,724.25 by 22.46 and the 100-day at 7,660.75 by 85.91, with the 200-day at 7,345.75. The stack runs in order from the 5-day down to the 200-day, and the settle now sits inside it. Distances are measured from the exact averages, and displayed values are rounded once to the quarter-point tick. The earliest rows of the 259-session series are thin deferred-contract prints, so the 100-day and 200-day carry a caveat.
The 9-day rose 10.08 points on a losing day. Its window dropped the 7,656.00 settle of 09/15, 90.75 points below Monday's close. The 20-day fell 2.16 points as the 7,790.00 settle of 08/28, 43.25 points higher, left its window. The 5-day fell 17.35 points.
Momentum sits at the midline. Relative strength reads 49.10 on the 9-day, 50.09 on the 14-day and 50.90 on the 20-day. The 14-day raw stochastic reads 62.80 percent, with %K at 72.21 percent beneath %D at 75.44 percent. The directional system points down: on the 9-day, negative direction at 25.81 leads positive at 19.61 with the index at 18.10, and on the 14-day 24.80 leads 19.52 with the index at 13.57. Both windows agree. The composite multi-indicator read fell to 48 percent buy from 56 percent, with strength weak and direction weakest; it read 72 percent buy a week ago. These readings are as published for the Tuesday session after the 6:00 PM ET reopen, so the latest value in each may include Globex trade.
Zoom out. The published 50 percent retracement of the four-week range sits at 7,711.75, the same price as the 50 percent stochastic threshold and the midpoint of the 7,575.00 to 7,848.50 one-month range. The one-month low, set on 09/16/26, sits 171.75 points beneath the settle. No prior-quarter high or low and no four-hour series were captured for this session; the 30-minute series is the only intraday evidence used.
A 5.27 percent yield print and minus 16 billion dollars of hedging delta
Rates did the pushing, in the review's reading. The ten-year yield index traded from 5.20 to 5.27 percent and closed at 5.24 percent, and the thirty-year closed at 5.56 percent. The positioning note described the ten-year's 5.23 percent level as a fresh high weighing on stocks and carried the same 70 percent pricing for an October increase. The dollar index rose 0.23 percent to 101.20. Provider commentary reported that a Federal Reserve governor said Monday the labour market seems well positioned to handle higher rates, and put the Dallas regional manufacturing survey at 9.8.
The hedging flow was heavy and short-dated. The positioning note recorded minus 16 billion dollars of delta in real-time hedging flow for the index, with minus 12 billion from same-day put buying, and read it as tactical rather than a longer-term bearish shift. That is the note's characterisation. It described a same-day put spread of about 10,000 contracts at 7,660 as the day's peak gamma concentration. It also noted that 7,660 matched its implied one-day move low of 7,660.18, which held as the day's low area. The cash low was 7,666.60.
The model has the index beneath its threshold. The cash close sits 31.31 points beneath the modeled volatility threshold at 7,715 and 43.69 points above the modeled gamma-flip level at 7,640. The stack is wide. It shows a primary gamma concentration at 8,000, a call-side ceiling at 7,800 and a put-side base at 7,500. The gamma index reads 3.47, gamma tilt 1.297 and gamma notional 980.802 million dollars, and the 25-delta risk reversal sits at minus 0.032.
Puts led. Put volume of 849,324 contracts ran 1.33 times the 640,834 calls, and put open interest of 12.835 million ran 1.39 times the 9.215 million in calls. Then the note's own map. Its summary lists resistance at 7,760 and 7,800, a reference level at 7,690 and support at 7,700, 7,675, 7,600 and 7,400, with mapped key cash levels at 8,000, 7,000, 7,700 and 7,800. Its stated stance is to hold longer-dated upside exposure while adding short-dated put spreads for a move lower if this week's data lifts rates. Those are the note's characterisations.
Volatility rose. The volatility index closed at 16.07, up 1.20 points, and the volatility-of-volatility index at 91.02, while implied volatility for this week's expiration rose 2 to 3 points, per the note. The note's implied one-day move of 0.67 percent carries a published band of 7,660.18 to 7,763.52. Its 7,711.85 midpoint matches neither the 7,743 reference nor the close. Applied to Monday's 7,683.69 close, the 0.67 percent gives 51.48 points and a cash band of 7,632.21 to 7,735.17.
The note's reference column is Friday's close. Its cash reference of 7,743 matches Friday's 7,743.41 close, its technology index reference of 30,608 matches 30,608.13, and its futures reference of 7,803.8 matches Friday's 7,803.75 settle. All three line up. Monday's 7,683.69 close is a 0.77 percent decline from that reference, which reproduces the note's stated close of 7,684 and its 0.8 percent decline. Every figure in its futures column is the cash figure plus exactly 60.8, a fixed translation, so conversions here use the 63.06 basis measured Monday.
Iran headlines ran both ways. A United States official said at 12:16 PM ET that talks continue through intermediaries and that there would be no agreement without addressing the nuclear issue. A press report at 1:11 PM ET said Iran had agreed to halt enrichment for eased sanctions. Before the 4:00 PM ET settle, an Iranian official denied nuclear flexibility at 3:29 PM ET and an explosion was reported at Qeshm Island at 3:56 PM ET. At 4:26 PM ET, after the settle, Iranian state television described warning shots at vessels in the Strait of Hormuz; the 4:30 PM ET bar held between 7,740.50 and 7,748.00.
Commodities split. Crude's November contract settled up 0.21 percent at 92.60 after reversing an early advance. Gold's December contract fell 3.54 percent and silver 4.76 percent. The broad-market fund closed at 765.61, down 0.74 percent on the provider's record.
Technology lagged. The Nasdaq-100 cash index fell 1.08 percent against 0.77 percent for the S&P 500. The note reported the semiconductor fund down 2 percent and memory shares down 4 percent, and recorded separate longer-dated hedging demand in the Nasdaq that it read as aimed at the technology sector. No sector breadth or advance-decline series was captured, so breadth beyond those figures is not asserted. The news feed carried a leading graphics-chip maker's commitments rising to 279 billion dollars from 119 billion dollars at 7:42 AM ET, and a large social-media company's announcement of an enterprise platform business at 8:37 AM ET. A press report at 3:25 PM ET said the graphics-chip maker's chief executive is expected at a White House meeting on Tuesday, time not captured. The news-feed sentiment gauge read 36 out of 100, labelled fear, at 10:18 AM ET.
Positioning stays lopsided. In the report as of September 22, 2026, leveraged funds held 120,133 long against 495,707 short, a net short of 375,574, with shorts up 41,388 on the week. Asset managers held 1,118,655 long against 184,200 short, a net long of 934,455, and dealers held 168,132 long against 802,335 short. The report predates the rest of that week and Monday's session. Open interest on the December contract stood at 1,895,204 on Monday's row, 1,973 contracts above Friday's 1,893,231. Volume on the dated rows was 1,693,564 contracts on Monday against 1,642,370 on Friday.
The trade map for Tuesday
The primary setup is a short from 7,752 to 7,762. Monday settled at 26.9 percent of a 77.00 point range. The cash index closed beneath both the note's reference level and the modeled volatility threshold, the directional readings point down and the composite read weakened to 48 percent buy. The band sits just above. A rebound into the band would meet the Pivot Point at 7,758.58 and the 7,753.06 futures equivalent of the reference level. The stop sits at 7,790, above one standard deviation resistance at 7,780.21 and the 7,778.06 threshold equivalent, beneath Pivot R1 at 7,791.17. The targets step down: 7,724, then 7,691, then an extended 7,658. The settle holds above the 20-day and 50-day averages and the note reads the put buying as tactical, so the review labels the setup an analyst judgment.
From the 7,757 midpoint the risk to the stop is 33 points, 43.0 percent of the 14-day average true range of 76.74. The targets sit 33, 66 and 99 points beneath that midpoint. The settle sits 5.25 points beneath the bottom of the band, and the review frames the entry as a rebound into it. A one-range projection from the settle spans 7,670.00 to 7,823.50 at the quarter-point tick, or 7,670.01 to 7,823.49 before rounding. It holds the band and the stop. So do the first two targets. The extended 7,658 target sits beyond its lower edge. The published one-deviation band is tighter, 7,713.29 to 7,780.21, and the stop sits 9.79 points above its top.
The scenario ranges are analyst judgment. None carries a calibration. The low-range case runs 7,720 to 7,770, the most likely 7,700 to 7,791 and the high-range case 7,670 to 7,824. Session by session the review expects roughly 7,715 to 7,775 through Globex, with a mildly lower bias beneath the 7,753.06 to 7,758.58 pair. London's band is 7,710 to 7,780, with a neutral bias. The morning band is 7,700 to 7,790 and the afternoon 7,705 to 7,785.
The reopen was flat. Tuesday's session opened at 7,746.50 at 6:00 PM ET, a quarter point beneath the settle. At the time of reading the provider's overview showed a high of 7,752.75 and a low of 7,741.00. Those prints belong to Tuesday and form no part of Monday's range. The Reserve Bank of Australia decision is listed at 12:30 AM ET, forecast 4.6 percent against 4.35 percent, per the news-feed calendar and unconfirmed.
Europe brings two items. Swiss business survey data land at 3:00 AM ET and Bank of England consumer credit at 4:30 AM ET, both per the news-feed calendar and unconfirmed. Monday's European hours recovered from the overnight drift, and the review expects the London window to set the tone for the cash open again.
Then the first-order event. The cash open at 9:30 AM ET sets the session's first directional test. The job openings report lands at 10:00 AM ET, per the verified forward calendar, and the review reads it through its effect on the ten-year yield. The Conference Board consumer confidence index is listed at the same time, forecast 89.1 against 89.4, per the news-feed calendar and unconfirmed. A Federal Reserve vice chair's pre-recorded remarks follow at 11:00 AM ET, per the verified forward calendar. Monday's low came in the 10:30 AM ET bar. In the review's framing, a labour reading that lifts the ten-year yield toward 5.27 percent would pressure the 7,713.29 to 7,726.00 group, and a soft reading opens the 7,778.06 to 7,791.17 band.
The afternoon is crowded with speakers. Federal Reserve governors speak at 12:40 PM ET and 3:00 PM ET, per the verified forward calendar, and regional presidents are listed at 1:00 PM ET, 1:30 PM ET and 2:00 PM ET, per the news-feed calendar and unconfirmed. One meeting is untimed. A White House meeting with technology executives is reported for Tuesday in press reports, time not captured, so its timing is unconfirmed. The settlement falls at 4:00 PM ET, and Chinese manufacturing survey data follow at 9:30 PM ET, per the news-feed calendar and unconfirmed.
The week gets heavier. September 30, 2026 brings the quarter end and the personal income and outlays report at 8:30 AM ET. The memory-chip maker reports after the close that day, with its call at 4:30 PM ET, and the employment report follows at 8:30 AM ET on October 2, 2026, all per the verified forward calendar. The note flagged the memory-chip results as the event that could set the tone for the data-center trade into October. Wednesday carries both.
In this review's analyst judgment the most probable path holds beneath the 7,758.58 Pivot Point overnight, meets the 10:00 AM ET labour data with rates as the transmission, and settles between 7,699.43 and 7,780.21. The review weights that band above a settle outside it for three reasons. The cash index closed beneath both the reference level and the modeled volatility threshold, the 14-day %K sits beneath %D, and the composite read weakened. Against it, the 20-day and 50-day averages beneath the settle and the note's view of the put buying as tactical argue against a deeper second leg without a new catalyst. No measured frequency backs it. The alternative that would invalidate it is a sharp fall in yields that returns the cash index above 7,715, which would reopen the 7,791.17 to 7,803.00 band.
The cash index finished 6.31 points under the line the positioning note uses to separate its bearish and bullish stances, and in futures that line sits at 7,753.06, the same 6.31 points above Monday's settle.
The complete data picture
Every number behind Tuesday’s plan, charted first, then the full level lists, then the complete numeric reference underneath.
Full numeric reference, every remaining figure from the session review
1. Executive Summary
The December S&P 500 contract settled at 7,746.75 on Monday, down 57.00 points or 0.73 percent from Friday's 7,803.75 settle, after a 77.00 point session between 7,803.00 and 7,726.00. The settle finished at 26.9 percent of the range. The loss was the largest one-day decline since the 59.25 point drop of 09/23, the settle is the lowest since the 7,712.50 settle of 09/18, and the 77.00 point range was 0.96 times the published 14-day average daily range of 80.04 points and the widest daily range since the 84.50 point session of 09/23.
The S&P 500 cash index closed at 7,683.69, down 59.72 points or 0.77 percent, after a 7,666.60 to 7,724.15 range, and finished 6.31 points beneath the 7,690 reference level that the positioning note uses to separate its bearish and bullish stances. Rates were the driver: the ten-year yield index closed at 5.24 percent, up 6 basis points, after a 5.27 percent high that provider commentary described as a 19-year high, and provider commentary cited market pricing of a 70 percent chance of a quarter-point increase at the October 27 to 28 policy meeting. The positioning note recorded minus 16 billion dollars of delta in real-time hedging flow data for the index on the day, with minus 12 billion dollars from same-day put buying, which it read as tactical rather than a longer-term bearish shift. The volatility index closed at 16.07, up 1.20 points, and implied volatility for this week's expiration rose 2 to 3 points, per the positioning note.
The preserved 30-minute series places the session high of 7,803.00 in the first bar after the Sunday 6:00 PM ET reopen and the low of 7,726.00 in the 10:30 AM ET bar, the third bar of the cash session. The 12:00 PM ET bar rebounded to 7,786.25; it coincided with crude's midday reversal lower and with a news item at 12:16 PM ET quoting a United States official on the Iran talks. The contract then drifted into the 4:00 PM ET settle. The composite multi-indicator read fell to 48 percent buy with strength described as weak and direction as weakest, and the settle sits beneath the 5-day and 9-day settlement averages while holding above the 20-day.
The primary setup is a short from the 7,752 to 7,762 band around the Pivot Point and the futures equivalent of the note's reference level, stopped above one standard deviation resistance, with objectives at 7,724, 7,691 and an extended 7,658.
2.1 Intraday and Session Review
The Monday session opened at 7,796.00 at the Sunday 6:00 PM ET reopen, 7.75 points beneath Friday's settle, marked a high of 7,803.00 and a low of 7,726.00, and settled at 7,746.75 at 4:00 PM ET. The preserved 30-minute provider series, 46 bars from the reopen through the 4:30 PM ET bar, places the high in the opening 6:00 PM ET bar and the low in the 10:30 AM ET bar.
The overnight session drifted lower in a narrow band: the bars from the reopen through the 6:30 AM ET bar held between 7,757.00 and 7,803.00. The European morning recovered to 7,781.75 in the 8:30 AM ET bar. The 9:30 AM ET bar, which contains the cash open, traded between 7,758.75 and 7,775.25, the 10:00 AM ET bar between 7,759.25 and 7,773.75, and the 10:30 AM ET bar fell to the 7,726.00 low and closed at 7,730.75. The 12:00 PM ET bar rebounded to 7,786.25 and the 1:00 PM ET bar reached 7,783.50, after which the bars from 2:00 PM ET to 3:30 PM ET traded between 7,739.25 and 7,766.50. Post-settlement trade in the 4:30 PM ET bar held between 7,740.50 and 7,748.00.
The session extremes used here are also the completed-session inputs behind the published pivot ladder rather than an independently read bar, back-solved from the outer pivot pairs and verified against every rung. The third resistance point at 7,868.17 minus the third support point at 7,637.17, divided by three, returns 77.00, and the second resistance point at 7,835.58 minus the second support point at 7,681.58, divided by two, returns the same 77.00. Three times the Pivot Point of 7,758.58 less the 7,746.75 settle gives a high plus low sum of 15,528.99, and the resulting pair of 7,803.00 and 7,726.00 reproduces all seven published rungs. The chart's completed Monday daily bar reads 7,796.00, 7,803.00, 7,726.00 and 7,746.75.
Because Globex reopened at 6:00 PM ET, the provider's overview now shows the Tuesday session, with an open of 7,746.50, a high of 7,752.75 and a low of 7,741.00; those values are not used as Monday's range anywhere in this review.
2.2 Daily Structure
Monday's bar sits below Friday's on both extremes: the 7,803.00 high is 11.75 points beneath Friday's 7,814.75 high and the 7,726.00 low is 22.50 points beneath Friday's 7,748.50 low. The settle finished 1.75 points beneath Friday's low.
The prior week, September 21 through September 25, spanned 7,848.50 to 7,707.25, and Monday's range sits inside it. The one-month high of 7,848.50, set on 09/22/26, sits 101.75 points above the settle, and the one-month low of 7,575.00, set on 09/16/26, sits 171.75 points beneath it. Across five sessions the contract lost 86.75 points or 1.11 percent from the 7,833.50 settle of 09/21.
No prior-quarter high or low was captured for this session, so the one-month and 13-week extremes serve as the available references.
2.3 4-Hour and Swing Structure
The daily settlement sequence reads 7,712.50 on 09/18, then 7,833.50, 7,831.75, 7,772.50, 7,767.00, 7,803.75 and 7,746.75. The swing high remains the 7,848.50 intraday print of 09/22, and Monday's low held 18.75 points above Thursday's 7,707.25 low. Daily ranges for the last six sessions ran 133.50, 38.00, 84.50, 76.25, 66.25 and 77.00.
The retracement grid published for Tuesday places the 38.2 percent retracement from the four-week high at 7,744.02, 2.73 points beneath the settle, the 50 percent retracement of the four-week range at 7,711.75 and the 38.2 percent retracement from the four-week low at 7,679.48. No four-hour series was captured for this session; the 30-minute series in section 2.1 is the only intraday evidence used.
2.4 Moving Averages
The averages cited in this subsection were computed for this session from the provider's daily settlement series for the December contract, which holds 259 completed sessions through Monday; the earliest rows of that series are thin deferred-contract prints, which carries a caveat for the 100-day and 200-day figures. Rounded to the contract's quarter-point tick, the 5-day average stands at 7,784.25, the 9-day at 7,755.25, the 20-day at 7,741.25, the 50-day at 7,724.25, the 100-day at 7,660.75 and the 200-day at 7,345.75.
The 7,746.75 settle sits 37.60 points beneath the 5-day average and 8.58 points beneath the 9-day, and 5.44 points above the 20-day, 22.46 points above the 50-day and 85.91 points above the 100-day. The stack is fully ordered from the 5-day at the top to the 200-day at the bottom, and the settle now sits inside it, beneath the two shortest averages.
The 9-day average rose 10.08 points on Monday despite the loss, because the settle that left its window, 7,656.00 on 09/15, was 90.75 points lower than Monday's 7,746.75. The 20-day average fell 2.16 points, because the settle that left its window, 7,790.00 on 08/28, was 43.25 points higher than Monday's. The 5-day average fell 17.35 points.
The projection grid gives the prices at which each average would be crossed on Tuesday: 7,771.88 for the 9-day, 7,741.56 for the 18-day and 7,772.69 for the 40-day.
2.5 Oscillator and Trend Readings
The oscillator figures below are as published on the provider's technical page dated for the Tuesday session, which was read after the 6:00 PM ET reopen, so the most recent value in each may include live Globex trade rather than the settle. Relative strength reads 49.10 on the 9-day, 50.09 on the 14-day and 50.90 on the 20-day, each at the midline.
Stochastics are turning from the upper half. The 14-day raw stochastic reads 62.80 percent, with %K at 72.21 percent and %D at 75.44 percent, so %K sits beneath %D. The published grid places 7,711.75 and 7,766.45 on either side of the settle as the 50 and 70 percent thresholds of the 14-3 day raw stochastic.
The directional system points down. On the 9-day the directional index reads 18.10 with positive direction at 19.61 and negative direction at 25.81; on the 14-day it reads 13.57 with positive direction at 19.52 against negative at 24.80. Historic volatility reads 11.80 percent on the 9-day and 11.10 percent on the 14-day.
The composite multi-indicator read published for Tuesday is 48 percent buy, down from 56 percent buy in the prior session's snapshot, with signal strength described as weak and direction as weakest, and the headline trend indicator on hold. The snapshot history reads 72 percent buy a week ago and 56 percent buy a month ago. The short-horizon group averages 20 percent buy, the medium-horizon group 75 percent buy and the long-horizon group 67 percent buy.
2.6 Volatility and Expected Range
The published 14-day average true range stands at 76.74 points, 0.99 percent of the settle, and the 14-day average daily range at 80.04 points; the 9-day figures are 77.32 and 85.39, and the 20-day figures 77.32 and 77.14.
A one-range projection using the 14-day average true range of 76.74 points frames Tuesday between 7,670.01 and 7,823.49 from the 7,746.75 settle, or 7,670.00 and 7,823.50 at the quarter-point tick. The positioning note's implied one-day move of 0.67 percent, applied here to Monday's 7,683.69 cash close, gives a cash band of 7,632.21 to 7,735.17. The published standard-deviation bands are built from five settlements: one deviation spans 7,713.29 to 7,780.21, two spans 7,699.43 to 7,794.07 and three spans 7,688.80 to 7,804.70.
3. Key Levels
The cash-to-futures basis measured this session is 63.06 points, Monday's 7,746.75 settlement less the 7,683.69 cash close, both at 4:00 PM ET. Cash levels below are translated into futures with that measured basis unless the source's own futures pair is quoted.
3.1 Resistance
The first overhead references are the 7,753.06 futures equivalent of the positioning note's 7,690 reference level and the Pivot Point at 7,758.58, with the 7,763.06 equivalent of the positioning note's 7,700 cash level, which the positioning note lists as support and which now sits above the cash close, and the 7,766.45 threshold for a 70 percent stochastic reading just above. The 9-day average crossing at 7,771.88 and the 40-day crossing at 7,772.69 follow. The modeled volatility threshold, 7,715 in cash, translates to 7,778.06 at the measured basis; the source's own futures pair reads 7,775.8 with its 60.8 point offset. One standard deviation resistance at 7,780.21 sits beside it.
Above that, Pivot R1 at 7,791.17 and two standard deviations resistance at 7,794.07 sit together beneath Monday's 7,803.00 high, and three standard deviations resistance at 7,804.70 sits just above it. The positioning note's 7,760 cash resistance translates to 7,823.06, Pivot R2 sits at 7,835.58 and the one-month high at 7,848.50. The call-side ceiling at 7,800 in cash translates to 7,863.06, with the source's own futures pair at 7,860.8.
3.2 Support
The 18-day average crossing at 7,741.56, the 7,738.06 equivalent of the positioning note's 7,675 cash support and the published target price at 7,735.78 sit directly beneath the settle. Monday's 7,726.00 low follows, with Pivot S1 at 7,714.17 and one standard deviation support at 7,713.29 beneath it.
The modeled gamma-flip level, 7,640 in cash, translates to 7,703.06 at the measured basis, with the source's own futures pair at 7,700.8; two standard deviations support at 7,699.43 and three standard deviations support at 7,688.80 sit beneath it. Pivot S2 at 7,681.58 and the 38.2 percent retracement at 7,679.48 form the next pair. The positioning note's 7,600 cash support translates to 7,663.06, and Pivot S3 at 7,637.17 is the extended reference, with the positioning note's broader 7,400 cash level, 7,463.06 in futures terms, as its stated downside tail.
4.1 Dollar, Rates, and Fed Policy
The ten-year yield index closed at 5.24 percent, up 6 basis points from Friday, after a 5.20 to 5.27 range, and the thirty-year closed at 5.56 percent. The positioning note described the ten-year's 5.23 percent level as a fresh high weighing on stocks, and provider commentary described the 5.27 percent print as a 19-year high. The dollar index rose 0.23 percent to 101.20. Provider commentary cited market pricing of a 70 percent chance of a quarter-point increase at the October 27 to 28 policy meeting and reported that a Federal Reserve governor said Monday the labour market seems well positioned to handle higher rates; the positioning note carried the same 70 percent figure. Provider commentary reported the Dallas regional manufacturing survey at 9.8.
Tuesday carries the job openings report at 10:00 AM ET, per the verified forward calendar, and a dense Federal Reserve speaker schedule, with a vice chair at 11:00 AM ET and governors at 12:40 PM ET and 3:00 PM ET per the verified forward calendar.
4.2 Large-Cap Leadership and Earnings
The news feed carried a leading graphics-chip maker's commitments rising to 279 billion dollars from 119 billion dollars at 7:42 AM ET, a large social-media company's announcement of an enterprise platform business at 8:37 AM ET, and a press report at 3:25 PM ET that the graphics-chip maker's chief executive is expected at a White House meeting on Tuesday, time not captured. The positioning note flagged the memory-chip maker's results after the close on Wednesday as the event that could set the tone for the data-center trade into October; that release falls on September 30, 2026, with the call at 4:30 PM ET, per the verified forward calendar. The news-feed sentiment gauge read 36 out of 100, labelled fear, at 10:18 AM ET.
4.3 Geopolitical Backdrop
The Iran negotiations produced reports in both directions. A United States official said at 12:16 PM ET that talks continue through intermediaries and that there would be no agreement without addressing the nuclear issue, and a press report at 1:11 PM ET said Iran had agreed to halt enrichment for eased sanctions; the 12:00 PM ET bar, which contains the first item, is the bar in which the contract rebounded to 7,786.25 while crude fell. Before the 4:00 PM ET settle an Iranian official denied nuclear flexibility at 3:29 PM ET and an explosion was reported at Qeshm Island at 3:56 PM ET. After the settle Iranian state television described warning shots at vessels in the Strait of Hormuz at 4:26 PM ET; the 4:30 PM ET bar held between 7,740.50 and 7,748.00.
4.4 Sector Breadth and Rotation
The Nasdaq-100 cash index fell 1.08 percent against 0.77 percent for the S&P 500, and the positioning note reported that the semiconductor fund fell 2 percent and memory shares 4 percent, while it recorded separate longer-dated hedging demand in the Nasdaq that it read as aimed at the technology sector. No sector breadth or advance-decline series was captured for this session, so breadth beyond those figures is not asserted.
4.5 Cross-Asset and Volatility
The volatility index closed at 16.07, up 1.20 points, and the volatility-of-volatility index at 91.02. Crude's November contract settled up 0.21 percent at 92.60 after reversing an early advance, gold's December contract fell 3.54 percent and silver 4.76 percent. The broad-market fund closed at 765.61, down 0.74 percent on the provider's record.
4.6 Institutional Positioning
The positioning report as of September 22, 2026 shows leveraged funds long 120,133 contracts against short 495,707, with shorts up 41,388 on the week, a net short of 375,574. Asset managers held 1,118,655 long against 184,200 short, and dealers held 168,132 long against 802,335 short. The report predates the rest of that week and Monday's session. Open interest on the December contract stood at 1,895,204 on Monday's row, 1,973 contracts above Friday's 1,893,231.
5. Index Options Flow Context
This is the primary flow surface for this instrument rather than a proxy, and every level quoted from it is a cash index value unless a futures pair is stated explicitly. The positioning note used is the edition published at 5:04 PM ET on Monday, September 28.
The reference price column requires care and was checked explicitly. That column is the prior session's close, not Monday's: the cash index reference of 7,743 matches Friday's 7,743.41 close, the technology index reference of 30,608 matches Friday's 30,608.13, and the futures column's reference of 7,803.8 matches Friday's 7,803.75 settlement. Monday's cash close of 7,683.69 is a 0.77 percent decline from that reference, which reproduces the positioning note's stated close of 7,684 and its 0.8 percent decline.
The dealer-positioning stack reads a modeled volatility threshold at 7,715, a primary gamma concentration at 8,000, a call-side ceiling at 7,800 and a put-side base at 7,500, with a modeled gamma-flip level at 7,640. The gamma index reads 3.47, gamma tilt 1.297 and gamma notional 980.802 million dollars, and the 25-delta risk reversal sits at minus 0.032. Call volume was 640,834 contracts against put volume of 849,324, and call open interest 9.215 million against put open interest 12.835 million. The mapped key cash levels are 8,000, 7,000, 7,700 and 7,800, and the positioning note's own summary lists resistance at 7,760 and 7,800, a reference level at 7,690 and support at 7,700, 7,675, 7,600 and 7,400. The cash close sits 31.31 points beneath the modeled volatility threshold and 43.69 points above the modeled gamma-flip level.
The futures column requires the same care as on prior sessions. The table's December futures column reads a reference of 7,803.8, a modeled volatility threshold of 7,775.8, a primary gamma concentration of 8,060.8, a call-side ceiling of 7,860.8, a put-side base of 7,560.8 and a modeled gamma-flip level of 7,700.8. Every one of those is the corresponding cash value plus exactly 60.8, so the column is a fixed-offset translation rather than an independent futures quote. The basis measured this session is 63.06, and section 3 states which offset each translated level carries.
The positioning note described a same-day put spread of about 10,000 contracts at 7,660 as the day's peak gamma concentration and noted that 7,660 matched its implied one-day move low of 7,660.18, which held as the day's low area; the cash low was 7,666.60. The implied one-day move of 0.67 percent carries a published band of 7,660.18 to 7,763.52, whose midpoint matches neither the reference nor the close, so the percentage is applied to Monday's close instead, as stated in section 2.6. The positioning note's stance is to hold longer-dated upside exposure while adding short-dated put spreads for a move lower if this week's data lifts rates, with short-term support at 7,600 and a broader downside tail open to 7,400. These are the positioning note's characterisations.
The positioning console for the cash index, dated as updated on 2026-09-26, showed a current price of 7,685.05 against a previous close of 7,743.41, call gamma of 5.4 billion dollars, put gamma of minus 1.1 billion dollars and next-expiry gamma at 7.13 percent of the total. Its 52-week low field reads 0.00 and its high-volatility-point and low-volatility-point fields read inverted, so those three fields are excluded.
6.1 Night Session (6:00 PM ET Monday to 3:00 AM ET Tuesday, Globex and Asia)
The Tuesday session reopened at 7,746.50 at 6:00 PM ET, a quarter point beneath the settle. The Reserve Bank of Australia decision is listed at 12:30 AM ET, forecast 4.6 percent against 4.35 percent, per the news-feed calendar and unconfirmed. The overnight test is the 7,753.06 to 7,758.58 pair formed by the futures equivalent of the note's reference level and the Pivot Point. Bias mildly lower beneath that pair, expected Globex band roughly 7,715 to 7,775.
6.2 London Session (3:00 AM ET to 8:00 AM ET Tuesday)
The European morning carries Swiss business survey data at 3:00 AM ET and Bank of England credit data at 4:30 AM ET, both per the news-feed calendar and unconfirmed. Monday's European hours recovered from the overnight drift, so the London window again sets the tone for the cash open. Bias neutral, expected band roughly 7,710 to 7,780.
6.3 Morning Session (9:30 AM ET to 12:00 PM ET Tuesday, regular trading hours open)
The cash open at 9:30 AM ET sets the session's first directional test. The job openings report is scheduled for 10:00 AM ET, per the verified forward calendar, and the Conference Board consumer confidence index is listed at 10:00 AM ET with a forecast of 89.1 against 89.4, per the news-feed calendar and unconfirmed. A Federal Reserve vice chair's pre-recorded remarks follow at 11:00 AM ET, per the verified forward calendar. Monday's low came in the 10:30 AM ET bar. A labour reading that lifts the ten-year yield toward 5.27 percent would pressure the 7,713.29 to 7,726.00 group; a soft reading opens the 7,778.06 to 7,791.17 band. Expected band roughly 7,700 to 7,790.
6.4 Afternoon Session (12:00 PM ET to 4:00 PM ET Tuesday)
A Federal Reserve governor speaks at 12:40 PM ET and another at 3:00 PM ET, per the verified forward calendar, and regional presidents are listed at 1:00 PM ET, 1:30 PM ET and 2:00 PM ET, per the news-feed calendar and unconfirmed. A White House meeting with technology executives is reported for Tuesday in press reports, time not captured, so its timing is unconfirmed. The settlement falls at 4:00 PM ET. Expected band roughly 7,705 to 7,785.
6.5 Night Session Forward (6:00 PM ET Tuesday)
Chinese manufacturing survey data follow at 9:30 PM ET, per the news-feed calendar and unconfirmed. The week's anchors are the personal income and outlays report at 8:30 AM ET on September 30, 2026, the memory-chip results after the close that day with the call at 4:30 PM ET, and the employment report at 8:30 AM ET on October 2, 2026, all per the verified forward calendar.
6.6 Expected Range (Tuesday Full Session)
Low-range scenario: 7,720 to 7,770
Mid-range scenario (most likely): 7,700 to 7,791
High-range scenario: 7,670 to 7,824
6.7 Most Likely Path
In this review's analyst judgment the most probable path holds beneath the 7,758.58 Pivot Point overnight, meets the 10:00 AM ET labour data with rates as the transmission, and settles between 7,699.43 and 7,780.21. That band is weighted above a settle outside it because the cash index closed beneath both the note's reference level and the modeled volatility threshold, the 14-day %K sits beneath %D and the composite read weakened, while the 20-day and 50-day averages beneath the settle and the positioning note's view of the put buying as tactical argue against a deeper second leg without a new catalyst. The alternative that would invalidate this reading is a sharp fall in yields that returns the cash index above 7,715, which would reopen the 7,791.17 to 7,803.00 band.
7. Tuesday Economic Calendar
The Tuesday session reopened at 6:00 PM ET Monday. The Reserve Bank of Australia decision is listed at 12:30 AM ET, forecast 4.6 percent against 4.35 percent, per the news-feed calendar and unconfirmed. The European morning lists Swiss business survey data at 3:00 AM ET and Bank of England consumer credit at 4:30 AM ET, per the news-feed calendar and unconfirmed.
The United States morning carries the job openings report at 10:00 AM ET, per the verified forward calendar, and the Conference Board consumer confidence index at 10:00 AM ET, forecast 89.1 against 89.4, per the news-feed calendar and unconfirmed. A Federal Reserve vice chair speaks at 11:00 AM ET, a governor at 12:40 PM ET and another governor at 3:00 PM ET, per the verified forward calendar, and regional presidents are listed at 1:00 PM ET, 1:30 PM ET and 2:00 PM ET, per the news-feed calendar and unconfirmed. Chinese manufacturing survey data follow at 9:30 PM ET, per the news-feed calendar and unconfirmed.
The single first-order event for the contract on Tuesday is the job openings report at 10:00 AM ET, per the verified forward calendar, read through its effect on the ten-year yield. The week's larger tests are the quarter-end and personal income and outlays report on September 30, 2026, the memory-chip results after the close that day and the employment report on October 2, 2026, per the verified forward calendar and the positioning note.
8. Primary Trade Setup
Direction: Short
Rationale: Monday's loss settled at 26.9 percent of a 77.00 point range with the cash index closing beneath the note's reference level and the modeled volatility threshold, the directional readings pointing down and the composite read weakening to 48 percent buy; a rebound into the Pivot Point at 7,758.58 and the 7,753.06 futures equivalent of the note's reference level offers a short with defined risk above one standard deviation resistance. The settle holds above the 20-day and 50-day averages and the positioning note reads the put buying as tactical, so the setup is an analyst judgment.
Entry Zone: 7,752 to 7,762
Stop Loss: 7,790 (above one standard deviation resistance at 7,780.21 and the 7,778.06 futures equivalent of the modeled volatility threshold, beneath Pivot R1 at 7,791.17)
Target 1 (T1): 7,724 (beneath Monday's 7,726.00 low and above Pivot S1 at 7,714.17)
Target 2 (T2): 7,691 (above three standard deviations support at 7,688.80 and Pivot S2 at 7,681.58)
Target 3 (T3, extended): 7,658 (above Pivot S3 at 7,637.17 and beneath the 7,663.06 equivalent of the 7,600 cash support)
Risk-to-Reward: Approximately 1:1 to T1, 1:2 to T2, 1:3 to T3
Invalidation: A settle above Pivot R1 at 7,791.17 negates the thesis outright. Short of that, the edge is removed by acceptance above one standard deviation resistance at 7,780.21 rather than by a touch, defined as two consecutive 30-minute closes above 7,780.21.
Macro override: A soft labour reading that pulls the ten-year yield well below 5.20 percent, or a de-escalation in the Strait of Hormuz that drops crude sharply, would lift equities and invalidate the short in real time; in that scenario the 7,791.17 to 7,803.00 band becomes the reference within one 14-day average true range of 76.74 points.
Sources and methodology
This outlook is built from our session review of the December E-mini S&P 500 contract, the December ’26 contract, prepared after Monday's close on September 28, 2026 for the Tuesday, September 29, 2026 session. Monday's completed extremes are recovered from the published pivot ladder: Pivot R3 at 7,868.17 less Pivot S3 at 7,637.17, divided by three, and Pivot R2 at 7,835.58 less Pivot S2 at 7,681.58, divided by two, both return 77.00, and three times the 7,758.58 Pivot Point less the settle gives a high-plus-low sum of 15,528.99, which yields 7,803.00 and 7,726.00 and reproduces all seven published rungs. The provider's dated row agrees at 7,796.00, 7,803.00, 7,726.00 and 7,746.75, on volume of 1,693,564 contracts and open interest of 1,895,204; it is a second surface of the same vendor, so it confirms internal consistency and not the underlying quote. Friday's row reads 7,759.00, 7,814.75, 7,748.50 and 7,803.75, on volume of 1,642,370 and open interest of 1,893,231, and it is the only Friday evidence used to grade Friday's card.
The contract domain was checked before any level was used: the reopened daily chart read 7,750.00 with a stated change of plus 3.25 against a prior close of 7,746.75, equal to the provider's published previous close, and the chart's completed Monday bar equals the provider's settlement row. Monday's intraday ordering rests on the preserved 30-minute series; the Tuesday prints on the provider's overview are never presented as Monday's range. The moving averages were computed from the 259-row daily settlement series and rounded once to the quarter-point tick; the oscillators are cited as published after the reopen. The positioning note used is the edition published at 5:04 PM ET on Monday, September 28, and its cash levels are quoted as published. Its reference column is the prior session's close and its futures column a fixed 60.8 translation, so any conversion made here uses the 63.06 basis measured this session, settlement against cash close, both at 4:00 PM ET. A positioning console for the cash index, dated as updated on 2026-09-26, showed a current price of 7,685.05 against a previous close of 7,743.41, call gamma of 5.4 billion dollars, put gamma of minus 1.1 billion dollars and next-expiry gamma at 7.13 percent of the total; its 52-week low field reads 0.00 and its high-volatility-point and low-volatility-point fields read inverted, so those three fields are excluded. Scenario ranges are analyst judgment. Items marked unconfirmed come from the news-feed calendar or press reports. Every catalyst whose release time had passed at the time of writing is recorded as completed.
Friday’s outlook for this contract is here, and the Nasdaq-100 contract's Friday outlook covers the index that fell 1.08 percent in cash on Monday. Outlooks for ES, NQ, GC and CL are collected on the market outlook page, and our forward trading record is on the performance statement.



