
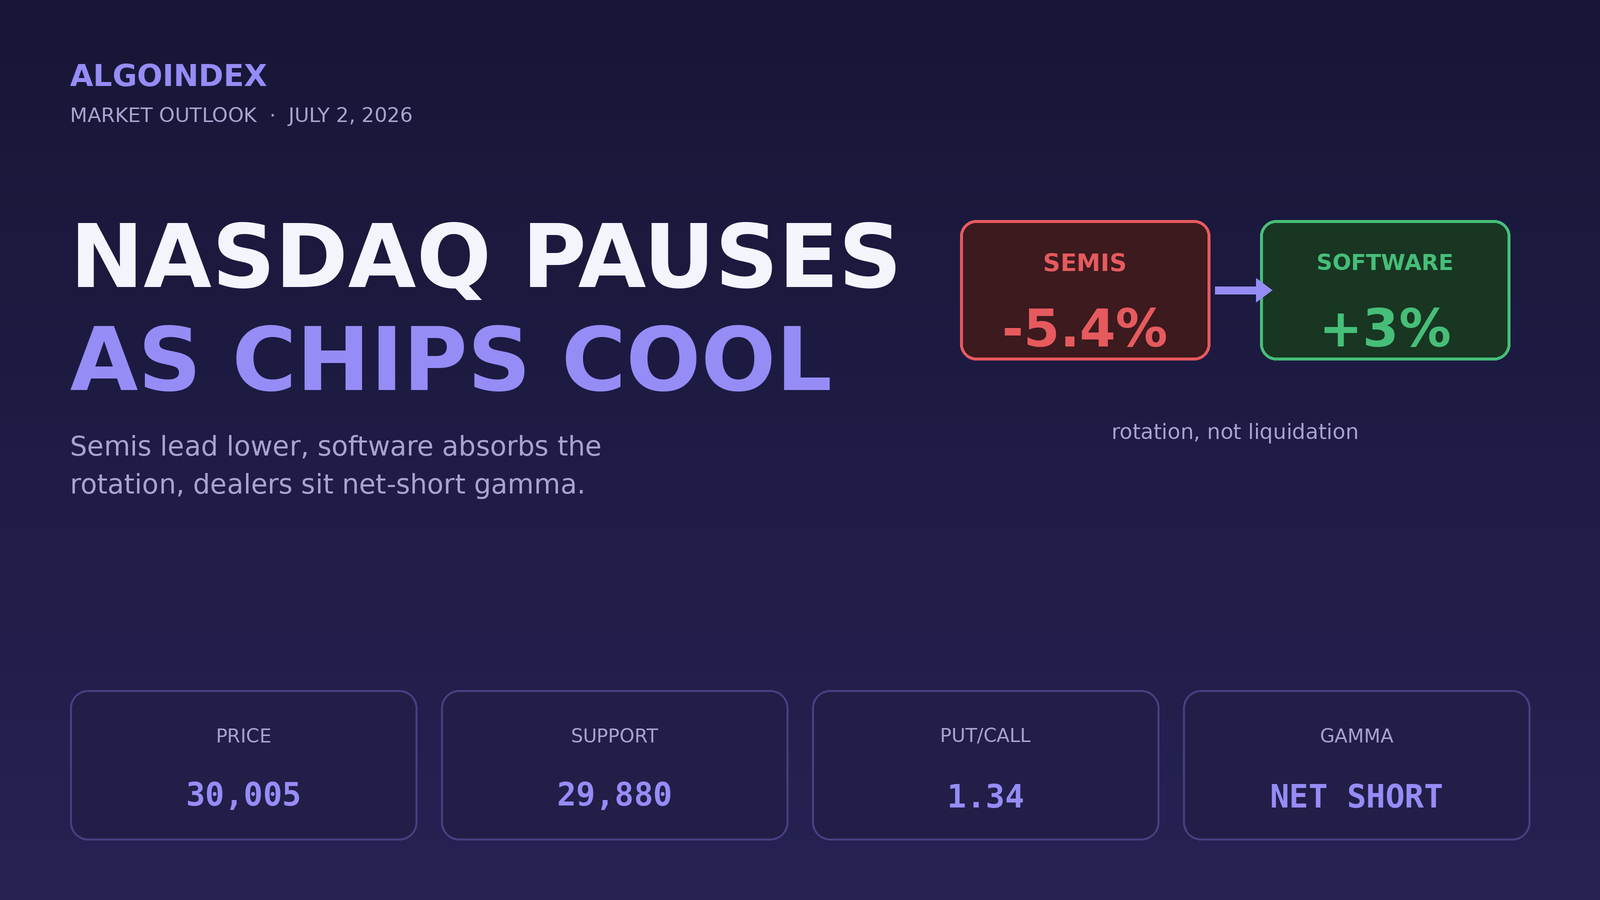
The Nasdaq 100 enters Thursday on softer footing, trading near 30,005 against a prior settle of 30,094.25, a decline of roughly 90 points. The overnight session was defensive: contracts drifted from an early high near 30,240 down to 29,930 before reclaiming the round-number 30,000 shelf into the cash-open window. The driver was a fresh wave of weakness in semiconductor and AI-infrastructure names that began in Wednesday's US session, where the tech complex fell about 1.5 percent, and spread across Asia overnight, where the Korean index dropped nearly 7 percent intraday and marquee memory and logic names fell 6 percent or more. That selling underscores a growing unease about how far the AI-driven rally has extended, even as enthusiasm for the theme persists.
The contradiction into today is an intact longer-term uptrend against a stalling short-term momentum picture. Price still holds above every major moving average from the 5-day through the 200-day, but the daily chart has printed a lower high beneath the late-June peak and the shorter oscillators are rolling over. Layered on top is the day's single most important variable: the full US employment report at 8:30 a.m. ET, pulled forward to Thursday because the market is closed Friday for the Independence Day holiday. That concentrates an unusual amount of macro risk into one print ahead of a long weekend, and with dealers positioned net-negative on gamma, the hedging response amplifies rather than dampens the move once a level breaks.
A leadership problem, for now
The tell is how contained the damage stayed. The dollar is soft near 101.08, crude is soft, and the broad S&P complex is down only fractionally, a divergence that shows how concentrated the weakness is in the chip and AI-hardware cohort rather than a broad risk-off. The narrative driving the selling is valuation: after a powerful multi-quarter advance, investors are increasingly questioning whether AI-hardware multiples have run ahead of fundamentals, and the overnight spread of that selling to Asia points to a broad de-risking of AI-linked exposure rather than an isolated US move. Until that cohort stabilizes, index rallies are likely to be sold into.
Positioning reinforces the caution. The Nasdaq-ETF proxy shows a put-to-call open-interest ratio near 1.34, an elevated implied-volatility rank in the low-60s, and a high skew rank, all consistent with demand for downside protection. Dealer gamma exposure is net negative, which mechanically means dealers amplify intraday moves, and the proxy traded near 725 after a prior close of 735.76, below the volatility-inflection strike near 742 that maps to roughly the 30,700 futures area. Below that inflection the market sits in a negative-gamma condition, which argues for smaller size and wider stops than a calm, positive-gamma environment would, and for trading the reaction rather than the anticipation.
The structure, level by level
The first meaningful ceiling is the overnight and session high band at 30,240, aligned with the standard pivot resistance and the recent supply shelf. Above it, the first pivot resistance sits at 30,429, then the one-standard-deviation resistance near 30,508, then the 30,700 to 30,764 grouping that coincides with the second pivot and the proxy volatility-inflection area translated into futures terms. The upper extreme is the third pivot resistance at 30,974, just beneath the 52-week and one-month high at 31,100. A reclaim and hold above 30,240 shifts the intraday tone constructive; sustained trade above 30,430 would argue the pullback is complete.
Beneath spot, immediate support is the 30,000 round number and the tightly grouped moving-average shelf at 29,940 to 29,980, the first line the bulls must defend. Below it, the first pivot support at 29,884 is reinforced by the session low at 29,826 and the 50 percent retracement at 29,804; that 29,880 to 29,800 pocket is the pivotal support base for the session. Losing it on volume opens the one-standard-deviation support near 29,681 and the second pivot at 29,674, then the third pivot at 29,339 and the one-month low near 28,508 as the downside extremes. With the 14-day average directional index at only 16.5 and the directional lines nearly on top of one another, this is a choppy, non-trending environment where breakouts are prone to fail and mean-reversion dominates until the data forces an expansion.
The complete data picture
Level map (NQ futures)
| Zone | Level (NQ) | What it is |
|---|---|---|
| Resistance | 31,100 / 30,974 | 52-week + 1-month high / 3rd pivot |
| Resistance | 30,700 to 30,764 | 2nd pivot + proxy vol-inflection (about 30,700) |
| Resistance | 30,429 / 30,508 | 1st pivot resistance / 1 s.d. |
| Decision band | 30,240 | O.N. + session high, standard pivot R |
| Pivot | 30,000 | Round-number magnet |
| Support | 29,940 to 29,980 | 9/18/40-day MA shelf (defend line) |
| Support | 29,880 to 29,800 | Pivot S1 29,884, low 29,826, 50% retr 29,804 |
| Support | 29,681 / 29,674 | 1 s.d. / 2nd pivot support |
| Support | 29,339 / 28,508 | 3rd pivot / 1-month low (extremes) |
By the numbers
Moving averages: 5-day 30,004, 20-day 29,962, 50-day 29,497, 100-day 27,366, 200-day 26,665. Oscillators: RSI 14-day 51.2, 9-day 49.7, 20-day 53.0; stochastic 14-day %K 63 / %D 64; 14-day directional index 16.5 (non-trending). Volatility: 14-day ATR about 722 pts (2.4%), ADR about 720, 14-day historic vol 27.6%. Proxy: last near 725 vs prior 735.76 (-1.46%), vol-inflection near 742 strike (about 30,700 futures), call gamma about -288M, put gamma about -1.57B, IV rank low-60s. Cross-asset: Dollar Index 101.08 (-0.3%), vol index mid-16s; Asia chip selloff (Korea index near -7% intraday).
The three paths (desk probabilities)
Path A, constructive reaction (about 40%): in-line-to-soft payrolls with contained earnings let the market hold the moving-average shelf, reclaim 30,240, and rotate toward 30,429 to 30,508.
Path B, defensive reaction (about 40%): a data miss or a resumption of the chip selloff breaks 29,880, trades 29,681, and probes toward the 29,339 pivot on the last full session before the holiday.
Path C, chop-and-pin (about 20%): a muddled print leaves the market rangebound between 29,880 and 30,240 into a thin, drifting holiday-eve close.
Expected range today: core band 29,700 to 30,350; a soft print could stretch upside to 30,430 to 30,508, while a hot print or renewed chip weakness could extend downside to 29,500 and the 29,339 pivot.
Today's calendar (ET)
- 7:45 a.m. · Federal Reserve policymaker speaks
- 8:30 a.m. · Employment report: nonfarm payrolls 113k f'cast (prior 172k), unemployment 4.3%, average hourly earnings +0.3% m/m and +3.5% y/y, private payrolls 107k, initial claims 218k (first-order catalyst)
- 10:00 a.m. · Factory orders -2% f'cast; Fed Chair committee testimony
- Late morning to early afternoon · Additional central-bank speakers
- Friday July 3 · Market closed for the Independence Day holiday
The setup is deliberately neutral into the data, then trade the reaction. On a hold of the 29,940 to 29,980 shelf and a reclaim of 30,240 after the opening range, continuation longs target 30,429 then 30,508 with a stop below 29,880. On a decisive break and hold below 29,880 to 29,825, continuation shorts target 29,681 then 29,339 with a stop back above 29,980. Either thesis is void if price churns inside 29,880 to 30,240 with no opening-range resolution, and the 8:30 report supersedes every pre-set technical level; do not act on a trigger that fires before the data is fully absorbed.
A record sits about 3.6 percent overhead, and the index is pausing to see whether the engine that carried it there, the chips, can steady itself. Hold the moving-average shelf and the holiday-week bid can rotate the index back toward its highs; lose 29,880 with the semiconductors still leading lower, and the same dealers now hedging get to find out how far a net-negative-gamma market can travel on thin holiday-eve liquidity. Today the Nasdaq trades the survey, not the story.
Trade the levels, not the noise.
AlgoIndex marks the dealer levels before each session and scores whether they hold. See the running numbers in the gamma level accuracy tracker, then view pricing.
Foundational guides: QQQ gamma exposure, call walls and put walls, cumulative volume delta, and what are NQ futures.



