
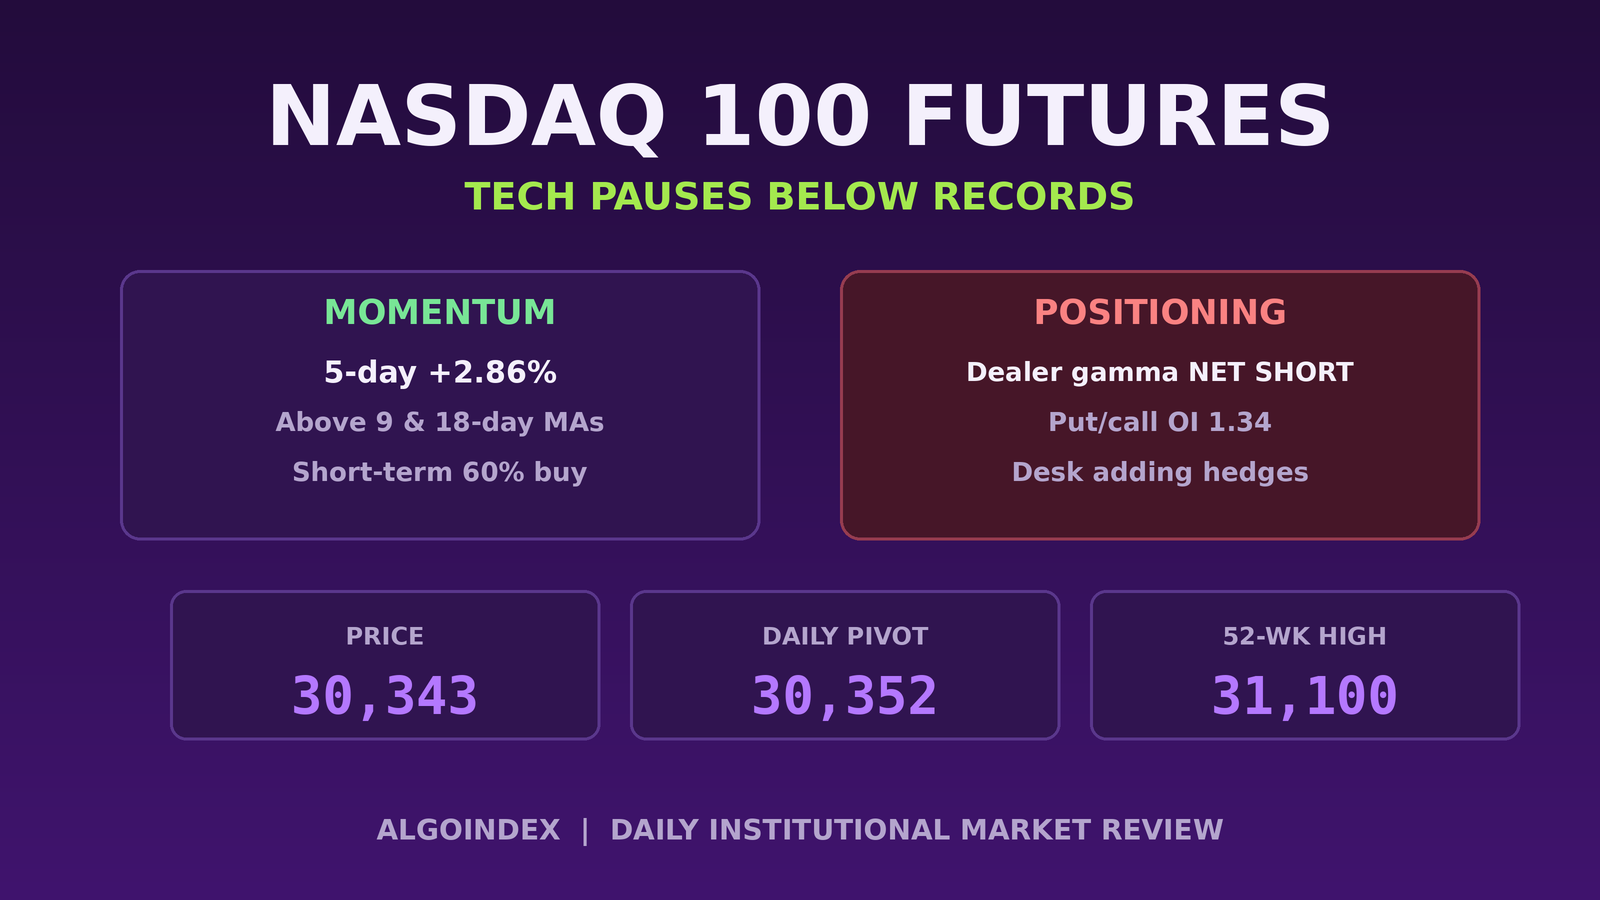
Five straight sessions of gains had carried the Nasdaq 100 to within a hair of a record, and on the first morning of the third quarter the market did what stretched markets do before a big data print: it exhaled. The E-mini opened the electronic session at 30,505.75, poked up to 30,553.75, then bled steadily to 30,299 as European surveys and pre-ISM positioning drained risk appetite. The contract now trades near 30,343, roughly 180 points under the prior settle, a controlled give-back rather than a reversal. It sits only about 2.4 percent below the 52-week high at 31,100 and is still up close to 845 points, almost 2.9 percent, over the trailing week.
The story into today is a standoff between momentum and positioning. Momentum still leans up: price holds above the 9-day and 18-day averages, the five-day trend is rising, and the short-term indicator bundle reads 60 percent buy. Positioning is the counterweight. Dealers in the Nasdaq-ETF proxy are carrying net short gamma, roughly minus 288 million on the call side and minus 1.6 billion on the put side, with a put-to-call open-interest ratio of 1.34. Net short dealer gamma means hedging flow amplifies moves rather than dampening them, so once a level breaks, the move tends to run. Layer a rate scare and a data gauntlet on top, and today is a market that can resolve hard in either direction.
Why growth is lagging this morning
The tell is relative weakness. Nasdaq cash sits near 30,105, down about 0.47 percent, underperforming a flatter S&P read, and the reason is written in the macro backdrop of the morning: the Dollar Index is firm at 101.37 and the ten-year yield has ticked up toward 4.45 to 4.47 percent. A stronger dollar and firmer yields press hardest on the long-duration megacaps that dominate this index, so the growth complex pauses while the broader market holds. The larger policy story runs through a crowded central-bank calendar, a mid-morning panel of Federal Reserve, European, Canadian, and U.K. governors plus remarks from the European central-bank president, any of which can move the rate-cut timeline and the rate-sensitive leaders directly.
The desk read frames the same tension. It still leans supportive into a holiday-shortened week, citing the Nasdaq complex specifically as a candidate for volatility selling that props up stocks, yet it has begun adding small downside hedges today and heavier tomorrow, watching for a broader correction as bullish positioning reaches extremes. For the Nasdaq 100 the translation is a supportive-but-fading tailwind: constructive into today's data, increasingly hedged beyond it.
The structure, level by level
The first overhead shelf is the overnight high at 30,553.75, reinforced by the prior-session high near 30,600. Above sits a dense band from 30,720 to 30,784, where the computed target at 30,720.58, first pivot resistance at 30,770.58, and the 18-day average stall at 30,784 all stack. Beyond that, second pivot resistance at 31,017.67 and the one-standard-deviation resistance at 30,993 guard the marquee 52-week and 13-week high at 31,100, with 31,435.58 the extended objective. Underneath, the overnight low at 30,299 and the daily pivot at 30,352.67 frame the open, and the real base is 30,110 to 30,054, where first pivot support, the 38.2 percent retracement, and the one-standard-deviation support converge. Lose it and the 9-day cross at 30,028 and 40-day cross near 29,896 come into play, then second pivot support at 29,687.67.
Volatility is the variable the desk cannot fully price. The Nasdaq-ETF proxy implies a one-day move near eleven dollars, about 1.5 percent, with one-month implied volatility around 24 percent sitting below one-month realized near 34 percent. Realized running above implied means recent swings have been larger than the options market is charging for, a setup that can produce sharp intraday moves if today's data surprises. The one-standard-deviation envelope spans 30,054 to 30,993, and the overnight range of 254 points sits well inside it, leaving expansion room in both directions.
The complete data picture
Level map (NQ futures)
| Zone | Level (NQ) | What it is |
|---|---|---|
| Resistance | 31,435.58 | 3rd pivot resistance, extended objective |
| Resistance | 31,100 | 52-week and 13-week high (marquee ceiling) |
| Resistance | 31,017.67 / 30,993 | 2nd pivot resistance / 1 s.d. |
| Resistance | 30,720 to 30,784 | Target 30,720.58, pivot R1 30,770.58, 18-day 30,784 |
| Resistance | 30,600 / 30,553.75 | Prior high / overnight high (T1) |
| Pivot | 30,352.67 | Daily pivot, battled at the open |
| Support | 30,299 | Overnight low |
| Support | 30,110 to 30,054 | Pivot S1 30,105.58, 38.2% retr, 1 s.d. |
| Support | 30,028 / 29,896 | 9-day cross / 40-day cross |
| Support | 29,804 / 29,687.67 / 29,440.58 | 50% retr / 2nd pivot / 3rd pivot support |
By the numbers
4-hour candle: 30,384.75 / 30,435.25 / 30,351.75 / 30,429 (o/h/l/c). Moving averages: 9-day 30,028, 18-day stall 30,784, 40-day 29,896. RSI daily 54.7; multi-indicator 48% buy (short-term bundle 60% buy). Cross-asset: Dollar Index 101.37 (+0.19%), 10-year 4.45 to 4.47%, vol gauge 16.69 (+1.4%). Proxy 735.48 vs prior 735.76, IV rank about 63%, 52-week proxy high 748.64. Private-payrolls preview about 98,000.
The three paths (desk probabilities)
Path A, continuation (about 45%): hold above 30,352, a benign ISM, reclaim 30,553, tag the 30,720 to 30,784 band.
Path B, rotational balance (about 35%): two-sided chop between 30,105 and 30,553 with no clean resolution into the payrolls overhang.
Path C, breakdown (about 20%): a soft ISM breaks 30,105 and accelerates to 30,028 then 29,896, with 29,687 the deeper target.
Expected range today: low near 29,900, most-likely mid near 30,350, high near 30,800; the 1 s.d. envelope widens to 30,054 to 30,993 on a data surprise.
Today's calendar (ET)
- about 08:15 · Private-payrolls preview, printed near 98,000
- 09:45 · Final manufacturing purchasing-managers survey
- 10:00 · ISM Manufacturing PMI, prices paid, employment (pivotal catalyst) plus construction spending
- 10:30 · Weekly crude-oil inventories
- Mid-morning · Panel of Federal Reserve, European, Canadian and U.K. governors, plus the European central-bank president
- Afternoon · Administration remarks
- Thursday July 2 · Nonfarm payrolls (pulled forward)
- Friday July 3 · Market closed for the July 4 holiday
The setup reflects the standoff. The higher-probability edge is a continuation long on acceptance above the 30,352 pivot after the opening range, ideally confirmed by a benign ISM, targeting 30,553, then 30,720 to 30,770, with a stop below 30,090 and invalidation on a four-hour close under 30,054. The mirror is the desk's own hedge: a rejection of 30,553 to 30,720, or a soft ISM that loses 30,105, opens a rotation to 30,028 then 29,896. With dealers net short gamma, whichever level breaks first is likely to run rather than fade.
A record is two and a half percent away, and the market is pausing to check the data before it decides whether to reach for it. Hold 30,105 and the holiday-week bid can carry the index back toward its highs; lose it, and the same dealers now hedging get to find out how far a net-short-gamma market can fall. Today the Nasdaq trades the survey, not the story.
Trade the levels, not the noise.
AlgoIndex marks the dealer levels before each session and scores whether they hold. See the running numbers in the gamma level accuracy tracker, then view pricing.
Foundational guides: QQQ gamma exposure, call walls and put walls, what are NQ futures, and NQ contract specs.



