
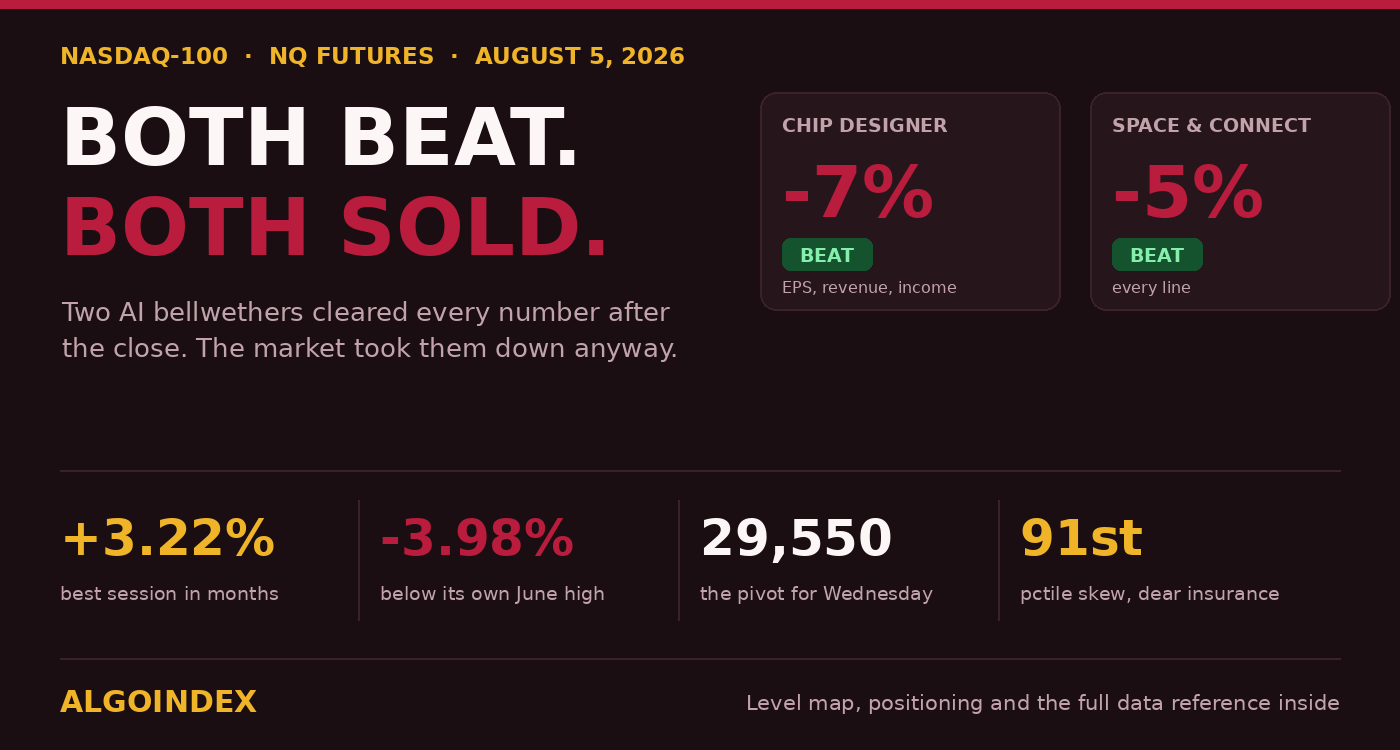
Two artificial-intelligence bellwethers reported after Tuesday's close. Both beat. Both got sold. That happened at the end of the best four-session run semiconductors have managed in six years, and it is the reason Wednesday is not a simple continuation trade.
The Nasdaq had just put on 3.22 per cent, its most forceful day in months, settling the September contract at 29,863.50. Then the session ended, the numbers came out, and nobody wanted them.
What lifted it
Shipping headlines. All morning the reports built: Tehran and Washington closing on terms that would restore commercial traffic through Hormuz, and at 07:43 Eastern the Treasury Secretary told an interviewer a deal might land "tomorrow." Crude sold off hard, Treasuries firmed, and the inflation premium buried in equity prices came out in a rush.
Chips did the carrying, up 7 per cent as a sector. Earnings supplied the rest: an analytics name added better than 29 per cent, beating on revenue and lifting its outlook, a scanning-hardware business gained over 28, a heavy-equipment maker better than 5. Breadth was real, not a handful of tickers, with the broad index up 1.79 per cent and the industrial average up 1.71, both at records.
Then the close, and the problem
The chip designer earned 1.66 dollars where 1.62 was expected. Revenue of 11.54 billion against 11.31 billion. Operating income ahead. Third-quarter sales guidance bracketing a midpoint above consensus. Shares fell about 7 per cent.
What the market disliked was not the top line but what it cost to get there. Capital spending came in at 808 million dollars where 298.6 million was penciled in. Research ran 2.53 billion against 2.45. Operating margin improved by a tenth of a point. Desks read the guidance as light on sales and noted that investors now want demonstrated returns from data-centre spending, not just more of it.
The space and connectivity business told a similar story with better numbers. Loss of 0.09 dollars where 0.24 was forecast. Revenue 7.8 billion against 6.81. Adjusted earnings before interest and tax of 3.5 billion where 2.0 was expected. Its AI segment lost 1.26 billion against a feared 2.39. Shares fell roughly 5 per cent, comfortably inside the 14 per cent options had priced.
Two companies cleared every printed hurdle and both traded down. Read that as positioning rather than as fundamentals. Four days of buying had already discounted good news, and good news arrived on schedule with nothing left to pay for it.
The index that led is the index still behind
Here is a fact worth sitting with. The Nasdaq gained more than either the broad index or the industrials on Tuesday, and it is the only one of the three that did not set a record. It closed 3.98 per cent under 31,100.00, the 52-week high it set for itself back on 3 June. That is 1,236 points of unrecovered ground.
Which produces two valid readings of the same chart. Measured against the past month, the contract sits high in its quartile and looks stretched. Measured against the past quarter, it sits mid-range and looks unfinished. Neither one's wrong. Wednesday is where the argument gets settled.
Above every average, and the stack still upside down
Price trades above all five major averages, which is the strongest single point in favour of continuation. The one that counts is a 50-day of 29,643.80, sitting just 220 points beneath spot. It was above price for most of last week and got reclaimed during Tuesday's run. Losing it again would say plainly that Tuesday was one day rather than a turn.
The stack itself hasn't finished repairing. At 28,547.85 the 5-day still sits under a 20-day of 28,971.31, left over from the July decline, and that takes several more sessions to unwind even if price simply holds.
Momentum tells a split story too. Nine-day directional strength reads 37.66 with positive movement clearly on top, a genuine short-term uptrend. Stretch to fourteen days and the two lines almost touch, 22.02 against 21.39. Go to twenty and fifty days and negative movement is still the bigger number. Four sessions have repaired the damage without reversing the intermediate picture, and the multi-system composite agrees, reading 56 per cent buy with the trend signal itself on hold.
The volatility complex would not confirm
On a day the broad index rose 1.79 per cent to a record, the volatility gauge rose 4 per cent to 16.49 and its second-order measure rose 2 per cent to 92.57. Fixed-strike readings picked up between two and ten points across the surface. Second session running of that pattern.
Durable advances usually drain option prices, because participants get comfortable selling upside and trimming protection. Rising volatility beside rising price says the opposite: this is being bought through options rather than accumulated through shares, which forces intermediaries to chase in both directions. Fast up, fast down.
Skew agrees. On the proxy it ranks in the 91st percentile, so downside insurance is dear while overall volatility is not. People are participating in the rally and paying up to be protected from it at the same time.
One more measurement worth carrying into Wednesday: this contract moves more than its options charge for. Historic volatility over nine days on the futures reads 31.05 per cent; September options imply 22.05. One-month realised on the proxy is 24.07 against 21.83 implied. So treat that implied band as a middle expectation rather than an edge.
No structure left overhead
On the proxy, dealer gamma is negative both sides of the book, put gamma reading negative 1.22 billion and call gamma negative 468.46 million. Short-gamma intermediaries must buy strength and sell weakness to stay hedged, which is the mechanical reason Tuesday accelerated the way it did.
More importantly, price has run clean through every piece of gamma structure above it. The heaviest call-side concentration equates to roughly 28,550 on the index. The primary concentration strike is near 29,000. The volatility inflection sits at 28,530 and the flip level at 28,274. Every one of them is now underneath the market.
Two things follow. Nothing pins price between here and the 30,269 area, with the one-month high at 30,094 on the way, which is exactly why the advance ran on without meeting resistance. And the flip level is roughly 1,400 points below, so the mechanical bid dealers supply while price rises would take a long time to become mechanical selling while it falls. All of these were calculated off a stale reference price. Treat them as shape, never as precise numbers.
Who was positioned for this
The positioning snapshot dates to 28 July, the day before the low, which limits what it can tell you about now but says a great deal about what the rally started with.
In one week dealers dumped 16,787 longs and put on 5,094 shorts, the largest swing in the dataset, arriving at the low net short 27,581. Fast-money accounts added 14,889 longs while still carrying a net short of 58,298, which is covering into weakness rather than conviction. Asset managers stayed structurally long at 76,759 net and trimmed shorts, treating July as an accumulation window.
So the market entered this move with intermediaries short and fast money short. That is mechanically supportive and explains the speed of the retracement. Whether any of that fuel is left is precisely what the next update will show.
What Wednesday turns on
Ten in the morning. The services survey, and inside it the prices-paid component, carrying a 65 forecast after a prior month at 67.7.
Services inflation is the piece policymakers have had the least success moving, and only a week ago three officials broke ranks to vote for a hike, splitting the committee 9 to 3. A print above 67 puts September back on the table, lifts the long end, and pressures a long-duration index directly through valuation. At or below 65 and the disinflation story that cheaper energy started gets a second leg.
The rest is supporting cast. Private payrolls at 08:15 carry a 65,000 forecast after 98,000. The refunding announcement at 08:30 is a rates event that reaches technology through duration. Inventories at 10:30 matter mostly through the Hormuz narrative. No large technology name reports after the bell, so one habitual overnight hazard is absent.
How to trade it
Don't chase the gap. Let the opening range work off that earnings weight first, then buy a pullback that gets defended, 29,560 to 29,630 where the 13-week retracement at 29,610.77, the session pivot at 29,550.58 and the reclaimed 50-day all sit inside 80 points.
Defended is the operative word. Take a rejection candle on the 15-minute frame, or stabilisation in the chip complex, or a break that fails and takes 29,630 back inside two bars. First touch alone isn't evidence. Stop beneath 29,395, under the stochastic shelf at 29,405.50 and under a 40-day crossing of 29,429.41. From 29,600 that is roughly 205 points of risk, paying about 1.3 to 29,860, 1.7 to 29,956, and 2.4 to the one-month high at 30,094.
The first fifteen minutes carry one question above all others: how do semiconductors behave. Open lower on the chip reaction and stabilise inside ten minutes, and the four-session advance holds, with pullbacks worth buying. Let them accelerate lower and pull the index under 29,741, and the move is unwinding, in which case stand the setup down until 29,550 to 29,630 is reached and actually held.
The conditional short only exists on a failed push into the overhead band. Price trades into 29,956 to 30,094 and closes a 15-minute bar back under 29,940, ideally alongside a hot prices-paid figure. Sell 29,900 to 29,950, stop above 30,105, targets 29,741, then 29,610, then 29,550. Note that the first objective falls short of a one-to-one hurdle. This structure only justifies itself held for the second.
Stand aside if the open lands mid-range, somewhere around 29,700 to 29,850, and price is still sitting there at 10:30 having shrugged off the services numbers entirely. When a session ignores its own main event, participants are simply waiting on Friday payrolls, and days like that do not pay directional structures.
The unsigned part
Every bit of this four-session, 2,755-point recovery rests on an agreement nobody has signed.
Two weeks ago the administration was threatening infrastructure targets. Strikes were announced on 29 July, and 27,201.50 was where this contract bottomed that same day. By 31 July there were reports of preparations to hit energy targets. Then it turned: Qatar confirmed drafted language, the Treasury Secretary said "tomorrow" on television, and European governments were reported willing to fund part of a reopening.
Tomorrow is Wednesday. A confirmed deal is already largely in the price. A collapse in the talks is not priced at all. Late Tuesday already brought friction, with a Saudi official denying at 16:58 that mediated talks with Houthi representatives were happening.
That asymmetry is the whole argument for patience at these levels. Buy the dip that gets defended. Don't pay up for the high.
The broad index closed at a record on the same headlines, and it has the same problem: ES / S&P 500: a record on loan.The complete data picture
Every number behind Friday’s plan, charted first; the full numeric reference follows underneath.
Full numeric reference , every remaining figure from the review
Full data reference
Every figure behind the analysis above. NQ September 2026 contract, session of Tuesday 4 August 2026, prepared for Wednesday 5 August. Index points unless marked otherwise.
| Reference | Value |
|---|---|
| Contract | September 2026 Nasdaq-100 E-mini, NQ1! |
| Settlement | 29,863.50 |
| Gain | 3.22 per cent |
| Cash index close | near 29,719, up 3.32 per cent |
| Session and weekly high | 29,956.50 |
| Close below the high | 93 points |
| Monday's open | 28,565.00 |
| Monday's low | 28,313.50 |
| Monday's settle | near 28,932 |
| Recovery off the 29 July low | 2,755 points, roughly 10.1 per cent |
| Consecutive advances | four |
| Open interest | 293,953 contracts |
| Overnight band | 29,776.50 to 29,838.50 |
| Overnight volume | roughly 2,100 contracts |
| Overnight quote | near 29,800, marginally below settle |
| Reference | Value |
|---|---|
| 52-week and 13-week high | 31,100.00, set 3 June |
| Below the 52-week high | 3.98 per cent, 1,236 points |
| One-month high | 30,094.00, set 6 July |
| Below the one-month high | 230 points |
| One-month and 13-week low | 27,201.50, set 29 July |
| Monthly midpoint | 28,647.75 |
| 38.2 per cent of the 13-week range | 29,610.77 |
| 50 per cent of the 13-week range | 29,150.75 |
| Character change level | 28,971 area, 31 July |
| Most recent swing high | 29,956.50 |
| Defended swing low | 28,313.50 |
| Intervening higher low | near 29,065 |
| Reference | Value |
|---|---|
| Session and weekly high | 29,956.50 |
| Stall against the 18-day | 30,032.25 |
| One-month high | 30,094.00 |
| 1st computed resistance | 30,269.42 |
| Projected target price | 30,396.56 |
| Crossover stalls | 30,541.18 |
| 2nd computed resistance | 30,675.33 |
| 1 deviation of movement | 30,788.17 |
| 52-week high | 31,100.00 |
| 2 deviations | 31,171.18 |
| 3rd computed resistance | 31,394.17 |
| Reference | Value |
|---|---|
| Overnight high | 29,838.50 |
| Overnight low | 29,776.50 |
| Stall against the 40-day | 29,741.25 |
| 38.2 per cent retracement | 29,610.77 |
| Session pivot | 29,550.58 |
| 40-day average crossing | 29,429.41 |
| Where raw stochastic falls to 80 | 29,405.50 |
| 50 per cent retracement | 29,150.75 |
| 1st computed support | 29,144.67 |
| Where relative strength returns to 50 | 29,034.84 |
| 38.2 per cent of the 4-week range | 28,989.06 |
| 1 deviation of downside | 28,938.83 |
| Four-week midpoint | 28,647.75 |
| 2 deviations | 28,555.82 |
| 2nd computed support | 28,425.83 |
| Active extension level | 29,862.66 |
| Lower extension anchors | 29,065.04, 28,971.21, 28,173.59 |
| Reinforced support area | the 20-day at 28,971.31 reinforces 28,939 to 29,035 |
| Retracement to pivot spacing | the 29,610.77 and 29,550.58 pair sit 60 points apart |
| Early-test area on a soft open | 29,700 to 29,750 |
| Cash range traded on the broad index | 164 basis points |
| Reference | Value |
|---|---|
| 5-day | 28,547.85, spot above by 1,315.65 |
| 20-day | 28,971.31, spot above by 892.19 |
| 50-day | 29,643.80, spot above by 219.70 |
| 100-day | 28,160.49, spot above by 1,703.01 |
| 200-day | 27,045.08, spot above by 2,818.42 |
| Stack order | not yet bullish; the 5-day remains below the 20-day |
| Reference | Value |
|---|---|
| 9-day raw stochastic | 96.62 per cent, %K 77.06, %D 58.18, strength 63.59 |
| 14-day raw stochastic | 96.62 per cent, %K 65.91, %D 46.47, strength 57.39 |
| 20-day raw stochastic | 92.55 per cent, %K 64.30, %D 45.05, strength 54.88 |
| 50-day raw stochastic | 68.28 per cent, %K 47.50, %D 33.81, strength 54.15 |
| Where 14-day strength reaches 70 | roughly 32,222 |
| Hourly oscillator matrix | low sixties |
| Reference | Value |
|---|---|
| 9-day | index 37.66, positive 26.42, negative 19.27 |
| 14-day | index 27.51, positive 22.02, negative 21.39 |
| 20-day | index 20.60, positive 20.40, negative 22.06 |
| 50-day | index 9.76, positive 20.40, negative 22.45 |
| Multi-indicator composite | 56 per cent buy, average strength |
| Short-term components | 40 per cent buy |
| Medium-term components | 75 per cent buy |
| Long-term components | 67 per cent buy |
| 20 to 50 day crossover | still registering a sell |
| Composite trend signal | hold |
| Reference | Value |
|---|---|
| 9-day average true range | 777.88, 2.60 per cent |
| 14-day average true range | 751.59, 2.52 per cent |
| 20-day average true range | 730.11, 2.44 per cent |
| 50-day average true range | 635.44, 2.13 per cent |
| 9-day average daily range | 825.89, 2.77 per cent |
| 14-day average daily range | 750.00, 2.51 per cent |
| 20-day average daily range | 704.42, 2.36 per cent |
| 50-day average daily range | 722.93, 2.42 per cent |
| Historic volatility 9-day | 31.05 per cent |
| Historic volatility 14-day | 28.06 per cent |
| Historic volatility 20-day | 25.35 per cent |
| Historic volatility 50-day | 27.29 per cent |
| September options implied | 22.05 per cent |
| One-month realised, proxy | 24.07 per cent |
| One-month implied, proxy | 21.83 per cent |
| Nine-day range above the fifty-day | 22 per cent |
| One-ATR envelope | 29,112 to 30,615 |
| Options-implied move | 9.65 dollars against a 722.42 close, 1.34 per cent |
| Implied band on the contract | roughly 29,464 to 30,264, about 400 points |
| Reference | Value |
|---|---|
| Call gamma | negative 468.46 million |
| Put gamma | negative 1.22 billion |
| Nasdaq delta notional | approximately 8.5 billion dollars, a 30-session high |
| Broad index delta notional | 16 billion dollars, also a 30-session high |
| Dominant call-side concentration | 710 dollars on the proxy, near 28,550 on the index |
| Primary gamma concentration strike | 700 dollars, 29,000 on the index |
| Volatility inflection | 698 dollars, 28,530 |
| Dealer gamma flip | 698 dollars, 28,274 |
| Distance from spot to the flip | roughly 1,400 index points |
| Gamma tilt | 1.419 index, 1.002 fund |
| Gamma notional, fund | 59.369 million dollars |
| Put to call open interest | 1.23 |
| Call volume | 1.08 million |
| Put volume | 1.13 million |
| Implied volatility rank | 47.51 per cent |
| Variance-model rank | 68.15 per cent |
| Skew ranking | 91st percentile |
| Largest gamma expiry | 20 August |
| Largest delta expiry | 6 August |
| Broad index note | negative dealer gamma near 7,700 accelerated the advance; a 15,000-lot customer long call at that strike was closed |
| Broad index risk pivot | 7,480 |
| Volatility index | 16.49, up 4 per cent |
| Volatility-of-volatility index | 92.57, up 2 per cent |
| Fixed-strike volatility | up two to ten points across the surface |
| Reference | Value |
|---|---|
| Commercials | long 160,602 (-3,697), short 175,548 (-762), net short 14,946 |
| Non-commercials | long 81,531 (+7,468), short 76,617 (+7,100), net long 4,914 |
| Dealers and intermediaries | long 54,481 (-16,787), short 82,062 (+5,094), net short 27,581 |
| Asset managers | long 106,927 (+2,263), short 30,168 (-1,871), net long 76,759 |
| Fast-money funds | long 61,233 (+14,889), short 119,531 (-1,503), net short 58,298 |
| Other reportables | long 10,354 (+1,789), short 11,266 (+3,001), net short 912 |
| Reference | Value |
|---|---|
| Chip designer, adjusted earnings | 1.66 dollars against 1.62 |
| Chip designer, revenue | 11.54 billion against 11.31 billion |
| Chip designer, adjusted operating income | 3.09 billion against 3.01 billion |
| Chip designer, Q3 revenue guidance | 12.70 to 13.30 billion against 12.51 billion consensus |
| Chip designer, capital expenditure | 808 million against 298.6 million expected |
| Chip designer, research spending | 2.53 billion against 2.45 billion |
| Chip designer, adjusted operating margin | 27.0 per cent against 26.9 expected |
| Chip designer, reaction | down roughly 7 per cent, shares near 480, hedging concentration at 460 |
| Space and connectivity, loss per share | 0.09 dollars against an expected 0.24 loss |
| Space and connectivity, revenue | 7.8 billion against 6.81 billion |
| Space and connectivity, adjusted EBITDA | 3.5 billion against 2.0 billion |
| Space and connectivity, AI segment revenue | 2.56 billion against 2.08 billion |
| Space and connectivity, AI segment loss | 1.26 billion against an expected 2.39 billion |
| Space and connectivity, connectivity revenue | 4.29 billion against 3.88 billion |
| Space and connectivity, reaction | down roughly 5 per cent against a 14 per cent implied move |
| Space and connectivity, positioning | shares near 116, downside concentration at 100, about 27,000 customer short puts at 95, lockup expiry 6 August |
| Reference | Value |
|---|---|
| Analytics name | up more than 29 per cent |
| Scanning hardware name | up more than 28 per cent |
| Heavy equipment name | up more than 5 per cent |
| Semiconductor sector | up 7 per cent, largest four-session advance since 2020 |
| Broad index | 7,737, up 1.79 per cent, a record |
| Industrial average | up 1.71 per cent, a record |
| Memory name | roughly 50,000 August upside calls bought to open, underlying up 7 per cent, options up 40 per cent intraday |
| Reported computing agreement | 10 billion dollars with a recently founded infrastructure provider |
| Reference | Value |
|---|---|
| High extension | 30,270, first computed resistance and upper implied boundary |
| High | 30,094, one-month high |
| Upper mid | 29,956, Tuesday's high |
| Most likely core | 29,630 to 29,960 |
| Lower mid | 29,550, session pivot |
| Low | 29,405, structural invalidation shelf |
| Low extension | 29,150, 50 per cent retracement and first computed support |
| Overnight expectation | 29,700 to 29,950 absent a headline |
| Overnight gap risk | toward 30,000 on a confirmed deal, 29,600 on a breakdown |
| Path | Probability and description |
|---|---|
| Path A, continuation after an early dip | 45 per cent. Holds above 29,550, grinds back to 29,900 to 30,000, reclaims and holds the 50-day |
| Path B, earnings drag dominates | 30 per cent. Loses the 29,550 pivot, works toward the 29,405 to 29,429 shelf, a close beneath 29,405 opens 29,150 |
| Path C, geopolitical confirmation and squeeze | 25 per cent. Clears the 29,956 to 30,094 band, extends toward 30,269 with 30,396 in play |
| Reference | Value |
|---|---|
| Entry zone | 29,560 to 29,630, on evidence of defence |
| Stop | below 29,395, structural |
| Risk from a 29,600 entry | approximately 205 points |
| Target 1 | 29,860, reclaim of the settlement and the 29,862.66 extension |
| Target 2 | 29,956, Tuesday's high |
| Target 3 | 30,094, the one-month high |
| Reward | 1:1.3, 1:1.7, 1:2.4 |
| Invalidation | a sustained 15-minute close beneath 29,395; do not re-enter long that session |
| Reference | Value |
|---|---|
| Trigger | a 15-minute close back beneath 29,940 after trading above it |
| Entry zone | 29,900 to 29,950 on the failed retest |
| Stop | above 30,105 |
| Risk from 29,925 | roughly 180 points |
| Target 1 | 29,741, the 40-day stall |
| Target 2 | 29,610, the 13-week retracement |
| Target 3 | 29,550, the session pivot |
| Reward | 1:0.9, 1:1.6, 1:2.0 |
| Invalidation | acceptance above 30,105 |
| Time | Event |
|---|---|
| 02:45 | French industrial production, 0.3 per cent monthly against negative 0.1 |
| 03:50 | French services survey, 49.8, unchanged |
| 04:00 | Eurozone composite final, 51.9 |
| 04:30 | UK composite final 52.1, services final 51.8 |
| 05:00 | Eurozone producer prices, 4.6 per cent annual against 5.9, negative 0.3 monthly against 0.2 |
| 08:15 | Private payroll change, 65,000 against 98,000 |
| 08:30 | Treasury quarterly refunding announcement |
| 09:45 | Services survey final 53.6, composite final |
| 10:00 | Services index 54.5 against 54.0; prices paid 65 against 67.7; employment 51 against 51.2 |
| 10:30 | Energy inventories, draw of 1.5 million against a prior draw of 7.167 million |
| 16:05 | Federal Reserve governor speaks |
| Time (ET) | Event |
|---|---|
| 18:45 | New Zealand labour data |
| 19:00 | Australian services and composite surveys |
| 19:50 | Bank of Japan meeting minutes |
| 20:30 | Japanese services and composite surveys |
| 21:45 | Chinese services data, 53.7 against 54.1 |
| Reference | Value |
|---|---|
| Thursday 6 August | Jobless claims, unit labour costs, productivity; share lockup expiry; regional president speaks 17:30 |
| Friday 7 August | Payrolls 80,000 against 57,000, unemployment 4.2 per cent, average earnings 3.5 per cent annual |
| 12 August | Consumer price data |
| 20 and 21 August | August monthly expiry |
| 16 September | Next policy decision with updated projections |
| Reference | Value |
|---|---|
| July policy vote | 9 to 3, three regional presidents dissenting for a 25 basis-point increase |
| Industry crude data, 16:48 ET | build of 2.7 million barrels against an expected 2.0 million draw |
| Cushing | build of 2.4 million barrels |
| Yen intervention | 30 and 31 July, cumulative likely above the 15 trillion yen of 2024 |
| Vessels assisted through the Strait | more than 1,000 over three months |
| Saudi denial timestamp | 16:58 ET |
| Qatar drafting report | 06:44 ET |
| Treasury Secretary comment | 07:43 ET |
| Desk note published | 16:51 ET, 4 August |
| Strike announcement | 29 July, in response to attacks on United States targets in Jordan |
| Earlier threat | 22 July, infrastructure targets |
| Later reporting | 31 July, preparations against energy-related targets |



