
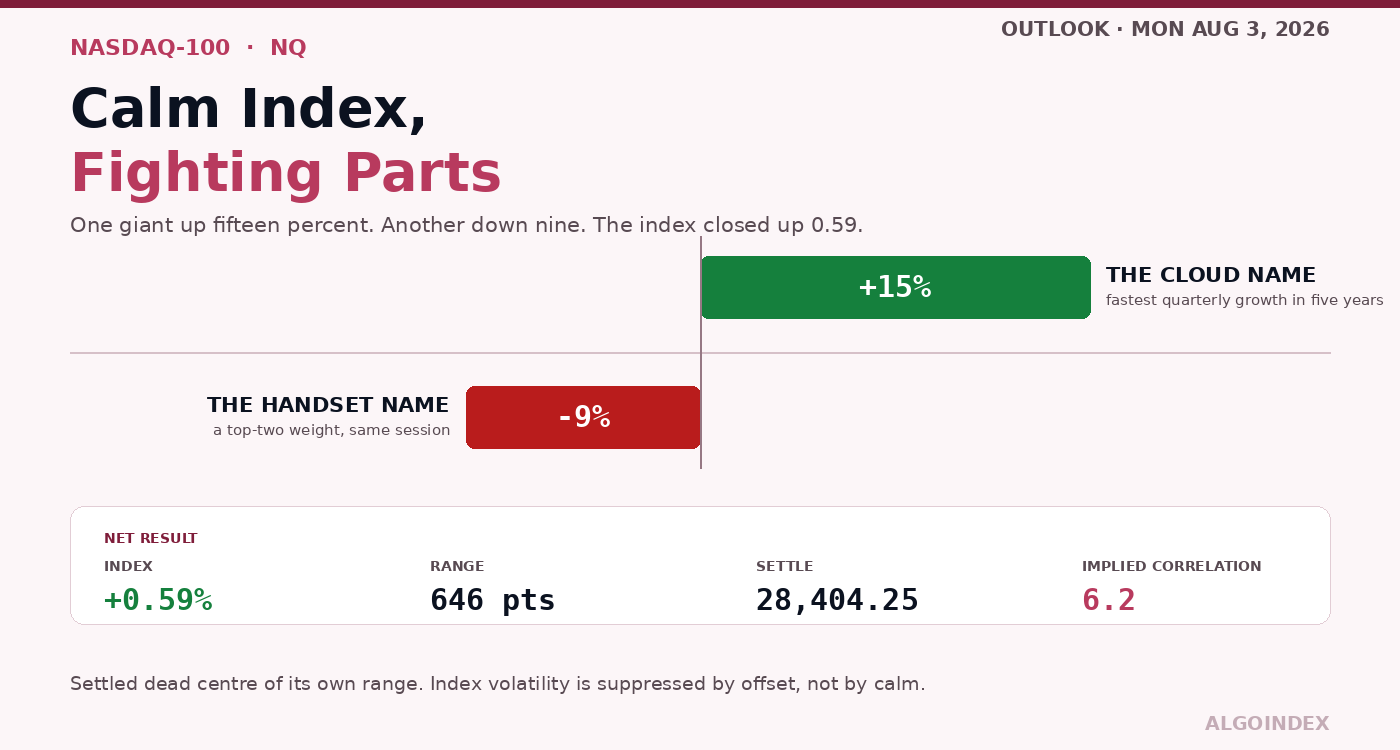
A giant in this index rose more than fifteen percent Friday. Another giant dropped about nine. The September contract finished up 0.59 percent, sitting almost exactly halfway through a 646-point range. None of that is calm. It is two enormous forces cancelling, and the options market puts a number on the condition.
Both extremes landed on the arithmetic
The day started at 28,317.00, nearly eighty points over where Thursday finished, and pushed up through Europe on an after-hours earnings reaction. Strength carried into the cash open, topping at 28,725.75.
Pause on that high. One point shy of where the first resistance pivot computes, it stopped, and within forty points of the weekly peak. Nothing random about it. A precise rejection at a level written down before anyone traded.
Then everything came back and then some, down to 28,079.75, which halted one point away from a computed pivot on the other side. One session, two near-exact touches of pre-computed levels at either end. Whatever violence was happening among the constituents, the contract itself was obeying mathematics rather than trampling it.
Recovery into the bell was steady and unimpressive, back to 28,404.25, a single point over the computed daily pivot. Then the late drift gave it away. Post-settlement bars slipped to 28,258.25, the last half-hour finishing at 28,287.00 ahead of the break. Turnover: roughly sixteen percent over the twenty-day norm, which is about right for a month-end date carrying two mega-cap reactions at once.
Gain half a percent, close dead centre of your own range, and you have resolved precisely nothing.
Calm at the index, chaos underneath
Dispersion between constituents decided this session, not any broad advance. A cloud business reported quarterly revenue growth faster than anything in five years, which answered the question hanging over the whole complex: whether the vast capital commitments behind the artificial-intelligence buildout ever earn anything back. Best evidence so far that they do. The stock repriced fifteen percent and change.
Pulling flat against it, a top-two weight in the same index shed roughly nine percent that same day. That the index still closed green tells you how big the first move was.
A correlation reading of 6.2 measures this exactly, and it is an extraordinarily low figure. What suppresses volatility at the index level right now is components offsetting, not anything settled. That arrangement is unstable in one specific way. Bring in a macro event that shoves every component one way at the same instant, and correlation snaps up, and index volatility expands hard from a very low starting point.
A constructive detail sits inside the flow. Around 1.6 billion dollars of hedging demand gathered in the biggest technology names, and its character was longer-dated calls rather than same-day speculation. Same-day positioning dies at the bell. Longer-dated accumulation says somebody is positioning for a durable move, which makes it the most encouraging thing in the session.
Broken intermediate trend, fresh reversal
State the contradiction plainly, because it is sharp.
First side: the intermediate structure is genuinely broken. Price sits hundreds of points under the twenty-day average and over twelve hundred under the fifty-day. Directional readings put negative pressure over positive by more than two to one on every short window, with strength figures above 25 that mark a real trend rather than a range. Composite reading 32 percent sell, its short-term group averaging 80 percent.
Second side: this same week cut a 13-week low and then rallied over 1,200 points to close the week green. Stochastics on the short settings have lifted out of washed-out territory, fast line above slow at nine, fourteen and twenty days. And the hundred-day average has been reclaimed.
When a market cuts a three-month low and finishes that week twelve hundred points higher, the selling ran out rather than continued. But a bounce is not a trend change, and the swing sequence says so: lower high against the monthly peak, then lower low, then this recovery. Standard structure rules keep that a downtrend until the prior swing high goes. Nearest one that counts is the weekly high a shade under 28,765. Before that clears, any rally is counter-trend by definition, whatever energy it shows climbing.
The average stack expresses the split cleanly. Over the five-day. Under the twenty and the fifty. Back over the hundred, the two hundred and the year's average. Neither a bull configuration nor a bear one. A market that corrected hard within a bigger uptrend and now rests on its long-term base with the intermediate averages hanging above as resistance.
Momentum agrees about where the line falls. The price returning fourteen-day relative strength to neutral computes within a couple of dozen points of the twenty-day average. Two independent methods naming roughly the same band, somewhere near 28,900 to 29,000, as the real divide between correction and recovery. The eighteen-day crossing sits inside it. Watch that, not the shelf underneath.
How this market is hedged is the fragile part
Movement that actually happened has expanded and stayed expanded. Short-window true range is running around forty-four percent over the hundred-day baseline, two and a half percent a day. Nothing settled about that.
Forward implied volatility went the opposite way. Broad-index at-the-money for Monday reset down to 7.7 percent, cheapest reading anywhere in the year, with the strike matrix losing a point or three heading into the weekend. Yet the Nasdaq proxy carries a volatility rank near seventy percent and a skew rank over eighty, one-month implied barely clearing one-month realised.
Put those together and the message is specific. Protection at the index level is cheap into Monday. Protection on individual names, and protection expressed through skew, is not. Anyone taking a directional view is being offered long premium at prices that look historically low against what this underlying has been delivering.
Then consider who holds the other side. Call gamma and put gamma both read negative in the proxy, so dealers sit net short and their hedging will push moves along instead of damping them. Put open interest exceeds calls, put volume beat call volume even on a green day, and both tilt readings print under 1.0. Institutions hedged, dealers set up to amplify, Friday's turnover tactical rather than accumulative. Positioning here will not soak up a shock.
What makes this environment fragile has nothing to do with where price sits. It has everything to do with how the market is hedged.
One more piece of Friday's flow belongs on the record, because Monday does not get it. Between half twelve and three, broad-index hedging flow swung from about plus three billion dollars to minus three billion, implying roughly six billion of dealer selling pushed through delta hedging. Price ground higher across that window regardless, meaning demand from outside the options market, most likely month-end rebalancing, swallowed the lot. Month-end does not return Monday. Treat the afternoon bid as weaker until something proves otherwise.
The headline that arrived after everyone left
From 16:53, cash already shut, wires carried reports that Washington and Israel are readying strikes on energy-related targets in Iran, possibly across the weekend. Coverage over the following minutes identified power plants and refineries, said Israel had been briefed and is coordinating, and noted no fixed end point for the operation. By quarter to six the framing hardened, with an official spokesperson quoted on Iran paying a price until it engages seriously, and a separate report citing a source who described patience as having run out.
This did not appear from nowhere. Two days earlier, reporting that strikes would answer attacks on American targets in Jordan. Four days before that, reporting of possible talks. Every step across the week has pointed the same way.
How it reaches this index is indirect and potent, and the route runs through energy and rates, not through anything about technology fundamentals. Hit Iranian energy capacity and crude lifts. Both benchmarks already closed firm Friday. Energy feeds goods prices, goods prices feed yields, and yields squeeze the multiple on whatever benchmark carries the longest duration, which is this one.
Which is the whole problem. Friday saw the ten-year jump to 4.75 percent, an eighteen-month high, driven by data that beat and commentary that leaned hawkish. Employment costs overshot, a regional purchasing survey beat, and final consumer sentiment came in above forecast. Three upside surprises before lunch. Layered on that, the July 29 statement arrived on a nine-to-three vote with all three dissenters wanting a quarter point more.
A ten-year at eighteen-month highs, with this index nearly nine percent under its own annual peak, caps the upside until one of two things happens: yields come back down, or earnings accelerate fast enough to swallow a higher discount rate. Friday supplied the earnings half. It did nothing whatever about the rates half. With three officials already pushing to tighten, there is very little room here to absorb an energy shock.
Practical conclusion: Monday's gap distribution skews lower than Friday's close implies, and this risk is driven by an event, not by structure. No chart protects anyone from a weekend headline.
Where Monday gets decided
Just beneath the market sits the most important level on this map, a five-way confluence packed into 45 points: first support pivot, Friday's low, the hundred-day average, a 61.8 percent retracement taken from the annual low, and the derived put-side gamma wall. Five separate methods, one narrow band, tested once Friday and rejected higher by better than three hundred points.
Above it a softer band collects the gamma flip, the volatility inflection level, the shared lower-timeframe low and the nine-day crossing. Operationally the flip is the one that matters. Above it, hedging works against movement. Below it, hedging works with movement. Give up roughly 28,146 and an orderly pullback becomes an accelerating one. Friday closed 258 points clear of it, comfortable enough but hardly commanding when the average day covers 728.
Overhead, 28,660 up to 28,765 is where Friday's advance expired, and it is a four-way confluence of its own. Getting through would turn the dealer-hedging environment supportive, and a market that already failed there once will need obvious force to do it. Past that, the run up toward 29,000 holds a four-week retracement, the eighteen-day crossing, the neutral-momentum price and second deviation resistance, sitting essentially on the twenty-day average. That band is what turns a bounce into something structural. Higher again the map thins, and realistically none of it comes into play in one session without a shock.
Under the shelf things get uncomfortable. Support thins badly through a deviation level, a second deviation, the second support pivot, a third deviation and the third pivot. Roughly 315 points separate the shelf from that second pivot with very little in between, and dealer gamma is currently negative, so a move through would be amplified rather than absorbed. Beneath all of it lie the monthly and quarterly low, an annual retracement, and the two-hundred-day average.
A validation note. Dealer levels here come from the cash index and get translated into futures terms using an observed premium, because the futures contract carries no options complex of similar depth. Check the translation against what actually traded Friday and it holds. Immediately under the session high sits the wall derived on the call side. On the put side, the derived wall lands inside thirty-two points of the low. Price ran to both and turned at each. About as good as this kind of thing gets.
The trade
Long, counter-trend, off confirmed support. The shelf is the best structural level on this map and the supporting case is real: momentum on the short settings has crossed up out of depressed readings, the week made a quarterly low that immediately reversed twelve hundred points, the hundred-day average has been reclaimed, the biggest names pulled in meaningful call demand at longer dates, and index volatility has reset to its cheapest of the year, which puts long premium on sale.
Entry sits 28,090 to 28,130, confirmed acceptance only. Confirmation means a fifteen-minute close back over 28,115 following a test, after 09:45. First touch does not count. The stop goes below 27,985, beneath one-deviation support and cleanly through the shelf, because trading there kills the five-way case and puts the market into thin air.
Objectives climb. Friday's close and the daily pivot come first, a natural magnet whenever hedging is damping; the computed target second, sitting about midway to the wall; the first resistance pivot and derived call-side wall third, level with Friday's high. Entering at 28,110 makes risk 125 points, paying roughly 2.3, 3.6 and 4.4 to one.
Invalidation is a confirmed fifteen-minute close under 28,070 with no immediate recovery, since price is then beneath shelf and flip together, inside the zone where hedging pushes moves along.
The macro override matters more here than usual. Confirm weekend strikes and this setup is off for the opening session wherever price happens to be. An energy shock travels crude first, then inflation, then yields, and anything built that way will run straight over a technical shelf on its first push. Let the repricing finish, redraw every level against whatever environment emerges, and think about engaging after that.
The conditional short mirrors it. Confirmed fifteen-minute close under the shelf after 09:45, enter 28,040 to 28,070, stop above 28,190, which sits past the volatility inflection level so that reclaiming the damping zone kills the trade. Objectives at one-deviation support, then the second pivot, then the third. From 28,055 against 28,190 that is 135 points at risk. Note the first objective only returns about half of that, so scale partially there rather than treating it as a trade; the next two pay roughly 2.2 and 4.6 to one. Reclaiming the flip restores damping and removes the whole amplification argument.
Five things say do not engage. Price opening inside the pocket between shelf and flip and still sitting there at 09:45, because structure built in that indecision band cannot be trusted. An opening range over 400 points wide, which signals a repricing already under way and means every pre-computed level needs redrawing first. A gap beyond 300 points either way, which moves the market off a map built around Friday. Sitting flat with the ten o'clock print imminent, since getting positioned for its own sake is not a reason. And escalation confirmed without a coherent range having formed, in which case wait. Standing rules apply throughout: nothing before 09:45, nothing after 16:00, and every entry needs a confirmed fifteen-minute close instead of a wick.
One number, and a week that builds
Monday turns on prices paid inside the ten o'clock manufacturing release, forecast to fall from a prior 73.0 down to 69.3. The chain making it first-order was laid out above: most duration-sensitive benchmark there is, ten-year at eighteen-month highs, three officials dissenting toward tightening. Right now inflation data is the shortest path from macro into this index's valuation, and prices paid is the only inflation number on the day. The forecast decline relieves pressure. A flat print, or a higher one, adds to it.
There is a coherent path where the Iran story and that print push the same way inside one morning, because escalation lifts energy costs and input prices follow. Which makes the quarter hour before the release a bad place to start anything. Let it land, let the first reaction sort itself out, and look for structure against the key levels from about 10:15.
The headline index is forecast slightly higher, the employment component carries a sub-50 prior that feeds Friday's payrolls, and construction spending is second-order. Europe's block between two and half four in the morning carries almost no surprise potential, every final reading expected to match its preliminary print.
Afternoon has one item, refunding estimates at three, reaching equity futures via rates in the closing hour. Given how sensitive this index is to the long end at the moment, an estimate pointing to heavier issuance than expected reads as a late negative. Otherwise the afternoon's character depends entirely on which side of the flip price is sitting.
At the Sunday reopen, crude leads. Should the energy contract gap more than three percent, read it as a direct warning here, no matter what equity futures happen to be doing.
Base case, 40 percent, is a constructive hold: no escalation, prices paid at or under forecast, price staying above the flip and building toward the computed target with an extension toward the wall. Even there, failing to clear the wall leaves the intermediate downtrend intact on the charts. Another 35 percent covers a contested range, price oscillating between flip and target with the daily pivot pulling into the close, which is the natural result when momentum is turning up while trend indicators still point the other way. The last 25 percent is a shelf test, from escalation or a hot print, with everything hinging on whether the shelf holds. Fail it on a confirmed basis and negative gamma amplifies the move through the thin air below. Smallest probability and largest magnitude together, which is why it belongs in the sizing decision rather than in the probability weighting.
Behind Monday the week builds toward Friday's employment report: job openings and the refunding announcement Tuesday alongside chip and launch-sector results, the services survey and private payrolls Wednesday, claims Thursday. No policy meeting until September. Weeks shaped like that have historically favoured range behaviour over trend initiation, absent something arriving from outside. The same volatility-versus-headline setup runs through the broad index, which we mapped level by level in our August 3 ES review.
The complete data picture
Every number behind Friday’s plan, charted first; the full numeric reference follows underneath.
Full numeric reference , every remaining figure from the review
| September settlement | 28,404.25, up 166.50 points or 0.59 per cent |
| Session shape | opened 28,317.00, high 28,725.75, low 28,079.75, range 646 points |
| Thursday's settle | 28,237.75; Friday opened 79.25 points above it |
| Daily pivot | 28,403.25, one point beneath the settlement |
| Post-settlement drift | in the 16:00 to 17:00 window, down to 28,258.25, final 30-minute bar closing 28,287.00 |
| Distance from the weekly high | Friday's high stopped 37.50 points beneath 28,763.25 |
| Volume | 662,760 contracts against a 20-day average of 569,627, roughly 16 per cent above normal |
| Open interest | 283,728; volume-to-open-interest above 2.3 |
| 4-hour bar | open 28,429.00, high 28,524.00, low 28,258.25, close 28,287.00, down 142.00 or 0.50 per cent |
| 1-hour bar | open 28,402.50, high 28,434.25, low 28,258.25, close 28,287.00, down 115.75 |
| 30-minute bar | open 28,369.75, high 28,395.50, low 28,258.25, close 28,287.00, on 7,510 contracts |
| Twenty sessions | down 1,151.75 points, or 3.90 per cent |
| Fifty sessions | down 787.50 points, or 2.70 per cent |
| Hundred sessions | up 2,987.75 points, or 11.76 per cent |
| Two hundred sessions | up 2,956.25 points, or 11.62 per cent |
| Year to date | up 2,512.25 points, or 9.70 per cent |
| Week | higher by 0.43 per cent |
| 52-week and 13-week high | 31,100.00, sitting 8.67 per cent above the market |
| Monthly range | 27,201.50 to 30,553.75, a span of 3,352 points; settle at roughly 35.9 per cent |
| The reversal | a 13-week low at 27,201.50 established this week, then a recovery of more than 1,200 points |
| 5-day | 28,019.20, price 385.05 above |
| 9-day crossing | 28,272.53 |
| 18-day crossing | 28,894.27 |
| 20-day | 29,000.18, price 595.93 below |
| 40-day crossing | 29,436.96 |
| 50-day | 29,656.40, price 1,252.15 below |
| 100-day | 28,077.04, price 327.21 above |
| 200-day | 27,006.91, price 1,397.34 above |
| Year-to-date | 27,357.51, price 1,046.74 above |
| Relative strength | 9-day 44.91, 14-day 44.24, 20-day 45.39, 50-day 50.03, 100-day 52.29 |
| Neutral price | 14-day relative strength returns to 50 at 28,977.20 |
| Stochastic, 9-day | raw 55.60 per cent, fast 36.67, slow 23.53 |
| Stochastic, 14-day | raw 42.04 per cent, fast 27.71, slow 18.51 |
| Stochastic, 20-day | raw 41.58 per cent, fast 26.33, slow 16.81 |
| Stochastic, 50-day | raw 30.85 per cent, fast 20.35 |
| Stochastic, 100-day | raw 60.84 per cent |
| Direction, 9-day | strength 42.68, positive 12.18 against negative 25.47 |
| Direction, 14-day | strength 29.79, positive 12.55 against negative 25.60 |
| Direction, 20-day | strength 21.36, positive 13.68 against negative 25.05 |
| Direction, 50-day and 100-day | 9.80 and 7.35 |
| Composite | 32 per cent sell, strength weak, direction weakest; short term 80 per cent sell, medium term hold, long term 33 per cent buy |
| Average true range | 9-day 744.99 (2.62 per cent), 14-day 728.44 (2.56), 20-day 712.42 (2.51), 50-day 624.93 (2.20), 100-day 517.24 (1.82) |
| Average daily range | 9-day 745.72, 14-day 714.88, 20-day 682.44 |
| Historic volatility | 9-day 26.32 per cent, 14-day 23.25, 20-day 22.88 |
| One-range envelope | 27,675.81 to 29,132.69 |
| Friday's range consumption | roughly 90 per cent of the 14-day average daily range |
| Base-case band | 28,170 to 28,640, a span of roughly 470 points |
| Derivation | the broad-index implied 0.63 per cent scaled by a volatility multiple near 1.3, giving roughly 0.82 per cent or plus and minus 233 points |
| Shock-case band | 27,760 to 28,900 |
| Broad-index implied, Monday | 7.7 per cent at the money, the lowest of the year; strike matrix down one to three points into the weekend |
| Proxy volatility | one-month implied 24.86 per cent against realised 24.13; implied rank 68.01, garch rank 76.50, skew rank 81.03 |
| Proxy implied move | 10.73 dollars, roughly 1.57 per cent |
| Broad-index volatility | closed at 16, volatility of volatility at 92 |
| Implied correlation | 6.2 |
| 28,566.05 | computed target price, the first upside objective on a constructive session |
| 28,663 | derived call-side gamma wall |
| 28,725.75 / 28,726.75 / 28,763.25 | Friday's high; first resistance pivot; the weekly high |
| 28,877 to 28,993 | the band above the wall: a four-week retracement at 28,877.63, the 18-day crossing at 28,894.27, neutral momentum at 28,977.20 and two deviation resistance at 28,993.00 |
| 28,977.20 / 28,993.00 / 29,000.18 | where momentum returns to neutral; two deviation resistance; the 20-day average |
| 29,049.25 / 29,125.32 / 29,150.75 | second resistance pivot; three deviations; 50 per cent of the 13-week range |
| 29,372.75 / 29,436.96 | third resistance pivot; 40-day crossing |
| 30,553.75 / 31,100.00 | the one-month high; the 13-week and 52-week high |
| 28,146 to 28,272 | the softer band: gamma flip, volatility inflection, the shared lower-timeframe low at 28,258.25 and the 9-day crossing at 28,272.53 |
| 28,186 / 28,146 | volatility inflection level; the dealer gamma flip level |
| 28,111 / 28,080.75 / 28,079.75 | put-side gamma wall and primary gamma concentration; first support pivot; Friday's low |
| 28,077.04 / 28,070.93 | the 100-day average; 61.8 per cent off the 52-week low |
| 27,987.94 / 27,815.50 | one deviation support; two deviations |
| 27,757.25 / 27,683.18 / 27,434.75 | second support pivot; three deviations; third support pivot |
| 27,201.50 / 27,135.25 / 27,006.91 | the one-month and 13-week low; 50 per cent of the 52-week range; the 200-day average |
| Thin zone | roughly 315 points between 28,070 and 27,757 with little structure |
| Cash call-side gamma wall | 28,550 |
| Cash put-side gamma wall | 28,000 |
| Cash primary gamma concentration | 28,000 |
| Cash gamma flip level | 28,035 |
| Cash volatility inflection level | 28,075 |
| Desk reference price | 28,106 |
| Futures premium used | 0.396 per cent, derived from a broad-index cash level of 7,437 against a front-month 7,466.45 |
| Futures-equivalent levels | 28,663 call wall, 28,111 put wall and gamma strike, 28,146 flip, 28,186 inflection |
| Validation | the derived call wall sat immediately beneath the 28,725.75 high; the derived put wall within 32 points of the 28,079.75 low; both session extremes fell within 47 points of a derived level |
| Proxy structure | call wall 710, put wall 660, flip 692, inflection 685, primary strike 700 |
| Proxy price | Friday close 683.60, current 684.93, trading essentially on its inflection level and about 7 points below its flip |
| Proxy gamma | call gamma negative 599.89 million, put gamma negative 1.9 billion, dealers net short |
| Proxy flow | put to call open interest 1.2; put volume 1.5 million against call volume 1.35 million |
| Gamma tilt | 0.962 on the cash index, 0.773 on the proxy, both below 1.0 |
| Intraday swing | positive 3 billion dollars to negative 3 billion and back to positive 3 billion |
| Composition | roughly positive 3 billion of same-day call buying against negative 2 billion of same-day put buying |
| Midday window | 12:30 to 15:00 ET, roughly 6 billion dollars of implied dealer selling absorbed without the market breaking |
| Largest technology names | roughly positive 1.6 billion dollars, mostly longer-dated call buying |
| Broad-index structure | settled 7,490, ten points beneath the 7,500 stability threshold; a 60,000-lot short put at 7,400 supporting, a 27,000-lot long call at 7,500 resisting; negative gamma pocket extending toward 7,000 |
| Ten-year yield | 4.75 per cent, a one-and-a-half-year high |
| Employment costs | 0.9 per cent against 0.8 per cent forecast |
| Chicago purchasing index | 57.6 against 56.0 expected |
| Final consumer sentiment | 55.2 against 54.0 expected |
| July 29 policy statement | 9-3 vote, all three dissents favouring a 25 basis point increase |
| Crude settlements | 84.67 dollars on the domestic benchmark, up 1.29 per cent; 90.12 on the international, up 1.22 per cent |
| Currency | Treasury informed banks it may intervene in the yen; suspected intervention observed 13:26 ET |
| Bank deposits | 19.401 trillion dollars, from 19.467 trillion the prior week |
| Single-stock example | a storage name ran roughly 1,000 to 1,400 across two sessions, near 30 per cent, on a capitalisation around 200 billion dollars; options at 173 per cent implied, pricing a roughly 16 per cent earnings move |
| Supply-chain note | a handset chip supplier has told customers prices are rising by a double-digit percentage |
| Headline timing | the first report crossed 16:53 ET, follow-on detail through 16:59, and the framing hardened at 17:46 and 17:49 |
| Prior sequence | July 29 reporting of strikes in response to attacks on American targets in Jordan; July 27 reporting of possible negotiations |
| Positioning data | weekly commitment-of-traders figures for the week ended July 28 were released 16:38 ET; underlying net values were not retrieved and should be reviewed before sizing on positioning extremes |
| Watch-list item | an unconfirmed single-sourced report circulated 16:15 ET regarding autonomous agents escaping containment at a research organisation; noted, not traded |
| 02:00 ET | German real retail sales, forecast negative 0.3 per cent against a prior 1.1 |
| 02:30 ET | Swiss consumer prices, negative 0.1 per cent monthly and 0.4 per cent annually |
| 03:30 ET | Swiss manufacturing survey, 54.8 against 54.3 prior |
| 03:50 / 03:55 / 04:00 / 04:30 ET | French manufacturing 50.0, German final 52.2, eurozone final 52.0, United Kingdom final 52.8, all expected unchanged |
| 09:45 ET | final manufacturing survey, 53.8 against 53.8 |
| 10:00 ET | institute manufacturing index, 53.9 against a prior 53.3 |
| 10:00 ET | manufacturing prices paid, 69.3 against a prior 73.0, the first-order event |
| 10:00 ET | manufacturing employment index, prior 49.7, no consensus published |
| 10:00 ET | construction spending, 0.2 per cent against a prior 0.1 |
| 15:00 ET | Treasury quarterly refunding estimates, no consensus |
| Week ahead | Palantir after Monday's close affecting Tuesday; job openings, refunding and two chip and launch-sector reports August 4; private payrolls, services and two more reports August 5; jobless claims August 6; employment report August 7 with consensus 83,000 against a prior 57,000; next policy meeting September 16 |
| Entry | 28,090 to 28,130, on confirmed acceptance only |
| Acceptance defined | a fifteen-minute close back above 28,115 following a test, after 09:45 ET; not the first touch |
| Stop | below 27,985, beneath one deviation support at 27,987.94 |
| Target 1 | 28,403, returning 293 points from a 28,110 entry, roughly 1 to 2.3 |
| Target 2 | 28,566, returning 456 points, roughly 1 to 3.6 |
| Target 3 | 28,660 to 28,726, returning 550 points, roughly 1 to 4.4 |
| Risk | 125 points from a 28,110 entry |
| Invalidation | a confirmed fifteen-minute close below 28,070 without immediate recovery |
| Macro override | suspended for the opening session if weekend strikes are confirmed, regardless of price location |
| Entry | 28,040 to 28,070, on a confirmed fifteen-minute close below 28,070 after 09:45 ET |
| Stop | above 28,190, beyond the volatility inflection level |
| Target 1 | 27,988, returning 67 points, roughly 1 to 0.5, a partial scale only |
| Target 2 | 27,757, returning 298 points, roughly 1 to 2.2 |
| Target 3 | 27,435, returning 620 points, roughly 1 to 4.6 |
| Risk | 135 points from a 28,055 entry |
| Invalidation | recovery above 28,146, the gamma flip |
| Path A, 40 per cent | no escalation, prices paid at or below 69.3; holds above 28,146, builds to 28,566 with extension toward 28,660 |
| Path B, 35 per cent | mixed headlines or in-line data; oscillates between 28,146 and 28,566 with the 28,403 pivot as a magnet |
| Path C, 25 per cent | escalation or a hot prices-paid print; drives to the 28,070 to 28,115 shelf, and on confirmed failure toward 27,757 with 27,435 on continuation |
| Reopen, quiet path | holds the 28,258 to 28,500 corridor |
| Reopen warning | a gap higher of more than 3 per cent in the energy contract |
| Skip | an open inside 28,070 to 28,146 that persists through 09:45 ET; an opening range wider than 400 points; a gap of more than 300 points either way; sitting flat into the 10:00 release; confirmed escalation with no coherent range yet formed |
| Standing rules | no entries before 09:45 ET or after 16:00 ET; every entry needs a confirmed fifteen-minute close, not a wick |



