
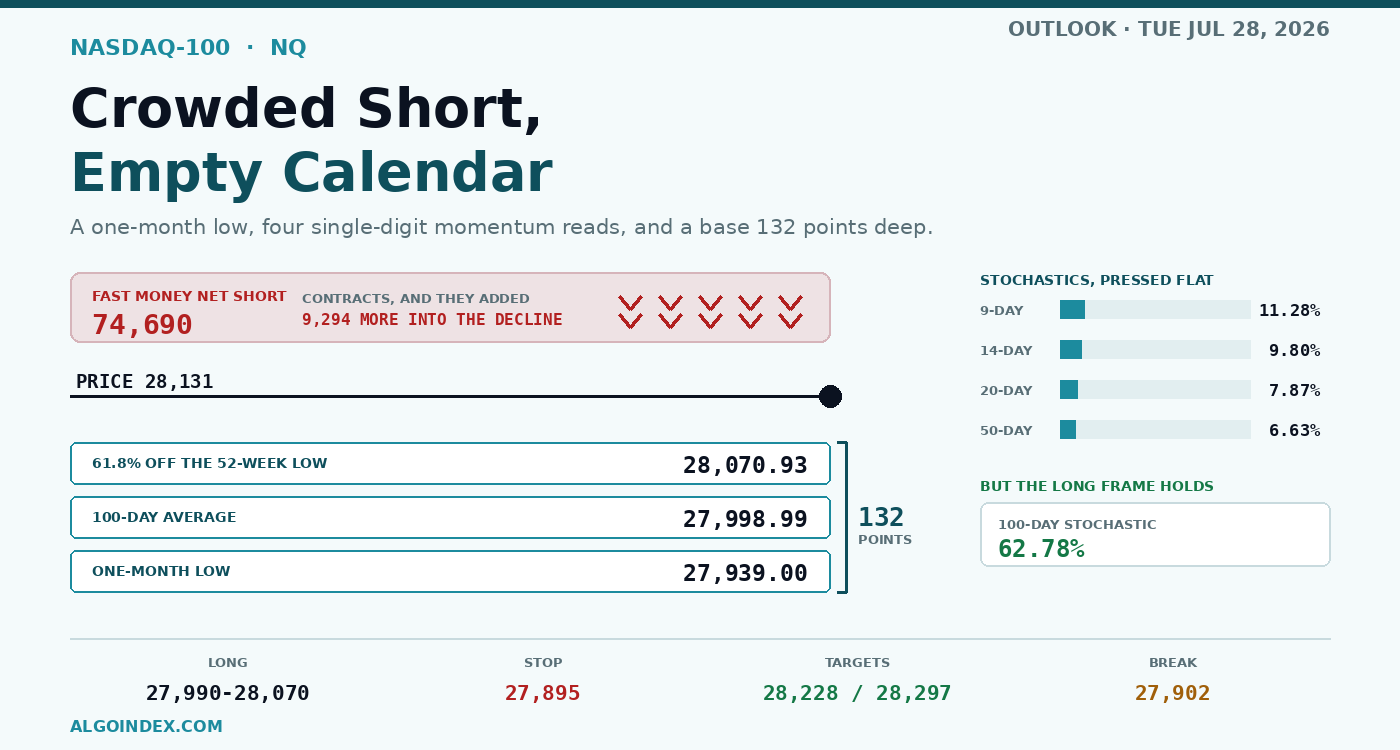
Monday sorted the equity market into winners and one loser. The blue-chip average finished 0.51 percent higher at its best level in a week. The broad index closed unchanged. And September Nasdaq futures settled 0.33 percent lower at 28,190.00, printing 27,939.00 at its worst during cash hours. That is the weakest print this contract has managed in a month, and its lowest since early May.
The gap between those three numbers is the whole session. Chips lost roughly 2 percent. Software picked up roughly 3, and staples another 2. Underneath the averages the damage was concentrated and severe: one large storage name dropped 11.02 percent to close at 1,278.23. A chip designer gave up 5.17. Two more storage issues shed 4.21 and 4.07 apiece. Nobody panicked out of equities on Monday. They walked out of the infrastructure layer and into the application layer, and this index carries far more of the former than the broad market does. Friday's note flagged the same chip unwind and an oversold consolidation off the shelf. Monday deepened both.
Two headlines gave the rotation something solid to stand on
This has been a sentiment trade for weeks, driven by unease about how much capital the biggest artificial-intelligence buyers are committing and when any of it pays. Monday handed that unease two concrete items.
The first came out of China, where reports say domestic deep-ultraviolet lithography tools have entered mass production, with five machines targeted before year-end and twenty by 2027. Those numbers are small. The direction isn't. It is a structural challenge to the pricing power Western equipment suppliers have enjoyed, and structural stories do not reverse on a good earnings print.
The second was a 5 billion dollar commitment from the leading accelerator designer into a prominent research startup. Read it one way and it is conviction. Read it the way the market read it Monday and it is more money going into an ecosystem whose returns are the exact thing under question. Until that question gets an answer, rallies here get sold.
Where the selling stopped is the interesting part
Price did not fall into open air. It halted on top of three references packed inside 132 points: June's monthly low of 27,939.00, then a 100-day average up at 27,998.99, then 28,070.93, which is 61.8 percent of the way back from the annual low. Monday closed above all three. The overnight session is holding above them too.
That base is doing a lot of work, because everything else on the short horizon is ugly. Price trades 353 points beneath the 5-day average, 1,189 beneath the 20-day and 1,611 beneath the 50-day. Trend strength on the 9-day window reads 38.10, its downside direction line at 30.15 versus 7.71 on the upside, close to four to one. The past five sessions have taken 1,167.50 points off this contract, a decline of 3.98 percent. Stretch it to twenty and the figure becomes 1,904.25, or 6.34.
Against that, momentum has been pressed flat. Raw stochastic readings print 11.28 on the 9-day window, 9.80 on the 14-day, 7.87 on the 20-day and 6.63 on the 50-day. Four windows, all at or near single digits. The 100-day reading sits at 62.78 percent and the 100-day average still registers a buy against price, and those two are the reason to call this a correction rather than something worse.
Everyone is already short
The positioning file as of July 21 is the most useful thing in this review. Fast-money accounts carried 46,344 contracts long against 121,034 short, leaving them net short somewhere near 74,690. They didn't inherit that position. They built it as price fell, tacking on 9,294 shorts across the week while cutting 1,233 longs. Asset managers stayed long at roughly 72,625 net, trimming only 2,080. Commercials added 3,154 shorts. Open interest reads 288,907.
So the fast money's heavily and freshly short, and the real money has barely moved. That configuration is fuel. If the base holds and anything at all lights a match, the covering is violent because the position is new and it is losing money the moment price turns. It also means the professionals are lined up for continuation, and they have been right for four weeks straight. What positioning tells you here is the size of the move, not its direction.
And the hedging community will exaggerate whichever way it goes
Reading the main fund proxy for the index, call gamma prints negative 370.79 million while the put side prints negative 1.34 billion. Both negative, puts running about four times the calls. Dealers holding that configuration trade alongside the move instead of leaning against it, selling weakness and buying strength.
The practical translation matters more than the numbers. A break beneath 27,939 does not get absorbed, it gets extended. A reclaim of 28,297 runs further than whatever headline caused it deserves. Expect overshoot in both directions and set stops accordingly. One caveat worth flagging: those model levels carry a July 25 stamp, so the geometry reflects Friday while the prices are current. Treat it as approximate.
The volatility surface agrees that something is coming. One-month implied on the proxy sits at 26.07 percent against realised of 23.67, the implied rank is up at 76.22 percent of its own trailing year, 1.35 million puts traded against 970,790 calls, and open interest carries a 1.32 put-to-call reading. Protection is being bought, not sold.
Tuesday is empty. Wednesday is not.
There is no first-order macro release Tuesday and no index heavyweight reports. The three names before the open are a logistics group, a beverage company and an aerospace manufacturer. After the close it is a car maker and a payments network. None of them carry weight here.
The one item that genuinely matters is a 7-year note auction landing at 13:00, and it matters more than the confidence release at 10:00. Monday told you why. That 2-year went off 12.6 basis points over its previous outing, and the 5-year cleared 20.8 higher with its cover ratio easing from 2.350 down to 2.280. Nothing in equities is more rate-sensitive than long-duration technology, and a third soft auction one day ahead of a policy decision carrying real hike risk feeds straight into these valuations.
Then Wednesday arrives with everything at once. The rate decision lands at 14:00 with consensus for a hold at 3.75 percent, though pricing implies something near a 40 percent chance of a hike, and after the close two of this index's biggest constituents report, and a major mobile-chip designer with them. Roughly 34 percent of broad-index capitalisation reports across the week and options are charging about 2.6 percent for it. With that much sitting 24 to 48 hours out, very few people will build real directional exposure on Tuesday.
The trade
The primary setup here is a long, and it runs explicitly counter to trend. Take 27,990 through 28,070, but only once the band has proven it holds, meaning a probe in and then a 5-minute reclaim of the upper edge. Parking a resting bid in there isn't the trade. Stop at 27,895, under the monthly low and under 27,902.97, where the computed target price sits. Targets are 28,228, then 28,297, then 28,485.
Risk from a 28,030 fill is 135 points and the objectives return 198, 267 and 455, so roughly 1.5, 2.0 and 3.4 to one. That is a decent profile for a bounce inside a downtrend, which is exactly what this is. Manage it as a bounce. Getting rejected at 28,228 and pushed back down into the entry zone is a warning rather than an exit; sustained acceptance beneath 27,895 is the exit.
The conditional short is the mirror image and it triggers on the primary setup's failure. Two consecutive 5-minute closes beneath 27,902.97 confirm the base is gone. Sell the 27,880 through 27,900 pocket when it is retested from underneath, stop 28,010, which sits over the 100-day, targeting 27,831, then 27,759, then 27,580. The first objective is too near to carry the trade by itself, so treat the second as the real one.
Weighting it out: oversold stabilisation and a grind higher through the pivot toward 28,485 carries 45 percent. A rangebound session between about 28,000 and 28,300 resolving nothing takes 35. A support failure, with dealer hedging accelerating the move into 27,831 and after that 27,759, gets the remaining 20 percent.
There is one more read available here, offered as a counterpoint rather than a recommendation. A published desk view is expressing short-dated upside on the fund proxy through call butterflies aimed at the 705 handle for Tuesday, on the strength of the Iran thaw and that 7 percent slide in crude. With the proxy at 682.39, that target sits about 3.3 percent above spot, which is roughly double the one-day implied move. Structurally that is a lottery ticket, cheap and improbable, and it deserves to be read as one rather than as a forecast.
The honest summary of Tuesday is that this market is stretched, crowded on one side, sitting on a base it has not broken, and looking at an empty calendar in front of a very full one. Trade the base or trade its failure. Standing in the middle of a 300-point corridor is the only genuinely bad option available.
The complete data picture
Every number behind Tuesday’s plan, charted first; the full numeric reference follows underneath.
Full numeric reference , every remaining figure from the review
| September settlement | 28,190.00, down 0.33 percent |
| Cash index | down 0.32 percent |
| Regular-hours low | 27,939.00, the one-month low and lowest since early May |
| Globex reopen | open 28,210.50, high 28,228.00, low 28,123.50, near 28,131, down about 0.20 percent |
| Reopen volume | 5,451 contracts |
| 30-minute bar | open 28,131.75, high 28,151.75, low 28,105.25, close 28,137.25 |
| 5-minute bar | open 28,130.75, high 28,137.25, low 28,123.25, close 28,129.00 |
| Five sessions | down 1,167.50 points, or 3.98 percent |
| Twenty sessions | down 1,904.25 points, or 6.34 percent |
| Since June 26 | negative 4.15 percent |
| One-month high / low | 30,599.75 on June 30 / 27,939.00 today, a 2,660-point span |
| Position in that span | roughly 7 percent, at the very bottom |
| Three-month high / low | 31,100.00 on June 3 / 27,346.50 on April 29, up 2.67 percent |
| 52-week low | 23,170.50 on March 31, price 21.48 percent above |
| Year over year | up 15.17 percent |
| 52-week high | 31,100.00, price 9.49 percent below |
| Weighted alpha | positive 16.01 |
| Relative strength measure | 37.29 |
| 5-day | 28,484.55, price 353 points below |
| 20-day | 29,320.99, price 1,189 points below |
| 50-day | 29,742.37, price 1,611 points below |
| 100-day | 27,998.99, price 133 points above |
| 200-day | 26,968.72, price 1,163 points above |
| Year-to-date | 27,345.72, price 786 points above |
| Relative strength, 9 / 14 / 20-day | 31.50 / 37.29 / 41.45 |
| Relative strength, 50 / 100-day | 49.12 / 51.96 |
| Stochastic raw, 9 / 14 / 20-day | 11.28 / 9.80 / 7.87 percent |
| Stochastic raw, 50 / 100-day | 6.63 / 62.78 percent |
| Stochastic 14-day %K / %D | 8.42 / 12.24 percent |
| 9-day | index 38.10, positive 7.71, negative 30.15 |
| 14-day | index 25.74, positive 10.48, negative 27.91 |
| 20-day | index 18.67, positive 12.73, negative 26.28 |
| Historic volatility, 9 / 14 / 20-day | 16.63 / 18.72 / 19.98 percent |
| Overall | 56 percent sell, trend signal sell |
| Short-term group | 100 percent sell, unanimous |
| Medium-term group | 50 percent sell |
| Long-term group | split, the 100-day average against price registers a buy |
| Average true range, 9-day | 605.63 points, 2.15 percent |
| Average true range, 14-day | 637.82 points, 2.27 percent |
| Average true range, 20-day | 647.54 points, 2.30 percent |
| Average true range, 50-day | 594.21 points, 2.11 percent |
| Average daily range, 9 / 14 / 20-day | 594.06 / 591.86 / 623.63 |
| One-deviation daily band | roughly 27,812 to 28,450 |
| Sizing guidance | a 637-point average true range argues for a 600-point day, not a 300-point one |
| Overnight high | 28,228.00 |
| Daily pivot | 28,297.42 |
| Short-term stochastic reference | 28,366.75 |
| 5-day average | 28,484.55 |
| Supply grouping | 28,580.63, 28,621.44, 28,655.83 |
| Dense band | 28,780.34, 28,796.00, 28,800.15 |
| Guarding the 29,000 handle | 28,937.27 and 28,955.41 |
| Above that | 29,121.67, 29,223.25, 29,269.38, 29,273.73, 29,314.84, 29,320.99 |
| Higher still | 29,480.08, 29,736.19, 29,742.37 |
| Where the correction would need to reach | the 29,120 to 29,320 area, before the broader downtrend could be called finished |
| Far overhead | 30,599.75 one-month high, 31,100.00 52-week high |
| Overnight low | 28,123.50 |
| The three-way base | 28,070.93, 27,998.99, 27,939.00, within 132 points |
| Computed target price | 27,902.97 |
| First pivot support | 27,831.58 |
| Next band | 27,758.56 and 27,746.11 |
| Below that | 27,579.85, 27,473.17, 27,442.73 |
| 13-week low | 27,346.50, a further 2.8 percent lower |
| Deeper | 27,135.25, 27,032.37, 27,007.33 |
| 200-day average | 26,968.72, the last line of the twelve-month uptrend |
| Proxy close | 682.39 against a previous 684.22, down 0.27 percent |
| Call gamma | negative 370.79 million |
| Put gamma | negative 1.34 billion |
| Volatility references, low confidence | upper 702, lower 480 |
| Implied volatility rank | 76.22 percent |
| Skew rank | 37.94 percent |
| Options-implied move | 11.26 dollars, roughly 1.65 percent, a band near 671 to 694 |
| One-month realised / implied volatility | 23.67 / 26.07 percent |
| Put-to-call open interest | 1.32 |
| Volume | 1.35 million puts against 970,790 calls |
| Top gamma expiry | August 20, 2026 |
| Top delta expiry | June 16, 2027 |
| Model level vintage | stamped July 25, geometry approximate |
| Broad index close | 7,413, beneath its stated 7,450 decision pivot |
| Named resistance | 7,500, 7,525, 7,550, 7,600 |
| Named support | 7,400 and 7,300 |
| Flagged condition | negative dealer positioning built beneath 7,450, risk-off on a break below |
| Index hedging flow | positive 5 billion dollars of cumulative delta |
| Driver | roughly positive 3 billion of same-day-expiry put selling |
| Single-stock hedging flow | roughly negative 1 billion, mostly longer-dated call selling |
| Observable support | a roughly 9,000-lot 7,385 by 7,380 put spread |
| Tactical desk view | short-dated upside on the fund proxy toward 705 via call butterflies, not valid beyond July 30 |
| Distance to that target | roughly 3.3 percent above a 682.39 spot, about twice the implied move |
| Note timing | published Monday July 27 at 5:13 PM ET |
| Volatility index / volatility-of-volatility | 18.68 / 100.91 |
| Fixed-strike implied volatility | this week's expirations up roughly 2.5 to 4 points |
| Fast-money accounts | long 46,344, short 121,034, net short roughly 74,690 |
| Weekly change | added 9,294 shorts, cut 1,233 longs |
| Asset managers | long 104,664, short 32,039, net long roughly 72,625, reduced 2,080 |
| Commercials | long 164,299, short 176,310, added 3,154 shorts |
| Dealers and intermediaries | cut 3,050 longs and 8,377 shorts |
| Open interest | 288,907 contracts |
| Semiconductor group | down roughly 2 percent |
| Software group | up roughly 3 percent |
| Consumer staples | up roughly 2 percent |
| Largest single decline | a storage and memory issue down 11.02 percent to 1,278.23 |
| Chip designer | down 5.17 percent |
| Two further storage names | down 4.21 and 4.07 percent |
| Domestic lithography programme | five machines targeted this year, twenty by 2027 |
| Accelerator designer commitment | 5 billion dollars into a research startup |
| Single-name revision | enterprise-software price target cut to 480 dollars from 510 |
| Policy rate | 3.75 percent consensus, implied hike odds roughly 40 percent |
| Two-year auction | 4.315 percent against 4.189 percent prior, cover 2.660 |
| Five-year auction | 4.408 percent against 4.200 percent prior, cover 2.280 against 2.350 |
| Clearing spreads | the two-year 12.6 basis points above prior, the five-year 20.8 above |
| Seven-year, prior auction | 4.260 percent, cover 2.500 |
| Producer prices | 5.5 percent year over year against 6.2 percent forecast, prior 6.5 percent revised to 6 percent |
| US durable goods | 0.3 percent against 1.8 percent forecast, following a 4.5 percent decline |
| US core durable goods | 0.6 percent against 0.8 percent forecast, down from 1.4 percent |
| Crude | down roughly 7 percent, with the international grade back above 93 dollars |
| Share of broad-index capitalisation reporting | roughly 34 percent, implied weekly move 2.6 percent |
| Entry zone | 27,990 to 28,070, only on a tested hold and a reclaim of 28,070 |
| Stop | 27,895 |
| Target 1 | 28,228, the overnight high |
| Target 2 | 28,297, the daily pivot |
| Target 3 | 28,485, the 5-day average |
| Risk from a 28,030 entry | 135 points |
| Reward | 198, 267 and 455 points, roughly 1:1.5, 1:2.0 and 1:3.4 |
| Invalidation | sustained 5-minute acceptance below 27,895, or a failure to reclaim 28,123.50 within the following hour |
| Macro override | stand aside into the 10:00 release and the 13:00 auction if not yet in profit |
| Trigger | two consecutive 5-minute closes beneath 27,902.97 |
| Entry | 27,880 to 27,900 on the retest from beneath |
| Stop | 28,010 |
| Targets | 27,831, then 27,759, then 27,580 |
| Risk from 27,890 | 120 points |
| Reward | roughly 1:0.5, 1:1.1 and 1:2.6, with the second target as the real objective |
| Oversold stabilisation and grind higher | 45 percent |
| Rangebound consolidation | 35 percent, roughly 28,000 to 28,300 |
| Support failure and continuation | 20 percent, toward 27,831, 27,759 and 27,580 |
| Low band | 27,850 to 27,950 |
| Mid band, most likely | 28,050 to 28,350, roughly 300 points |
| High band | 28,480 to 28,600 |
| Overnight expectation | a 28,050 to 28,250 band absent a headline |
| Fade tell on the open | opening above 28,200 and failing between 28,228 and 28,297 |
| Opening range expectation | 60 to 120 points with at least one false direction |
| No defined risk | the session opens between 28,150 and 28,280 and neither support nor the pivot is tested by 11:00 |
| No favourable entry | price gaps above 28,485 on the cash open |
| Headline shock | a move beyond 250 points in under fifteen minutes, wait for a 30-minute close |
| Auction reaction | the 13:00 result tails materially, let the reaction finish |
| Session rules | no entries before 09:45 or after 16:00 |
| 02:45 | French consumer confidence, forecast 85, previous 84 |
| 06:00 / 06:55 / 07:30 | Logistics, beverage and aerospace results, before the open |
| 09:00 | US 20-city house prices year over year, forecast 1.3 percent, previous 1.1 percent |
| 10:00 | US consumer confidence, forecast 92.4, previous 91.2 |
| 11:00 | Meeting on Iran, tentative |
| 13:00 | US seven-year note auction, the first-order event for this index |
| 16:05 | Automaker and payments network results, after the close |
| 21:30 | Australian quarterly inflation, trimmed mean forecast 3.7 percent year over year |
| Wednesday 14:00 | Rate decision and statement, 3.75 percent consensus, press conference 14:30 |
| Wednesday after the close | Enterprise-software, social-media and mobile-chip results |
| Thursday 07:00 | Bank of England decision |
| Thursday 08:30 | Quarterly growth and personal-consumption inflation |
| Thursday after the close | Consumer-hardware and e-commerce results |
| Timing | the review was generated between 19:00 and 19:15 ET rather than the scheduled 18:00 slot |
| Coverage | all ten required sources confirmed with evidence before writing |
| Data status | regular-hours figures complete; overnight figures are early-session and will move |



