
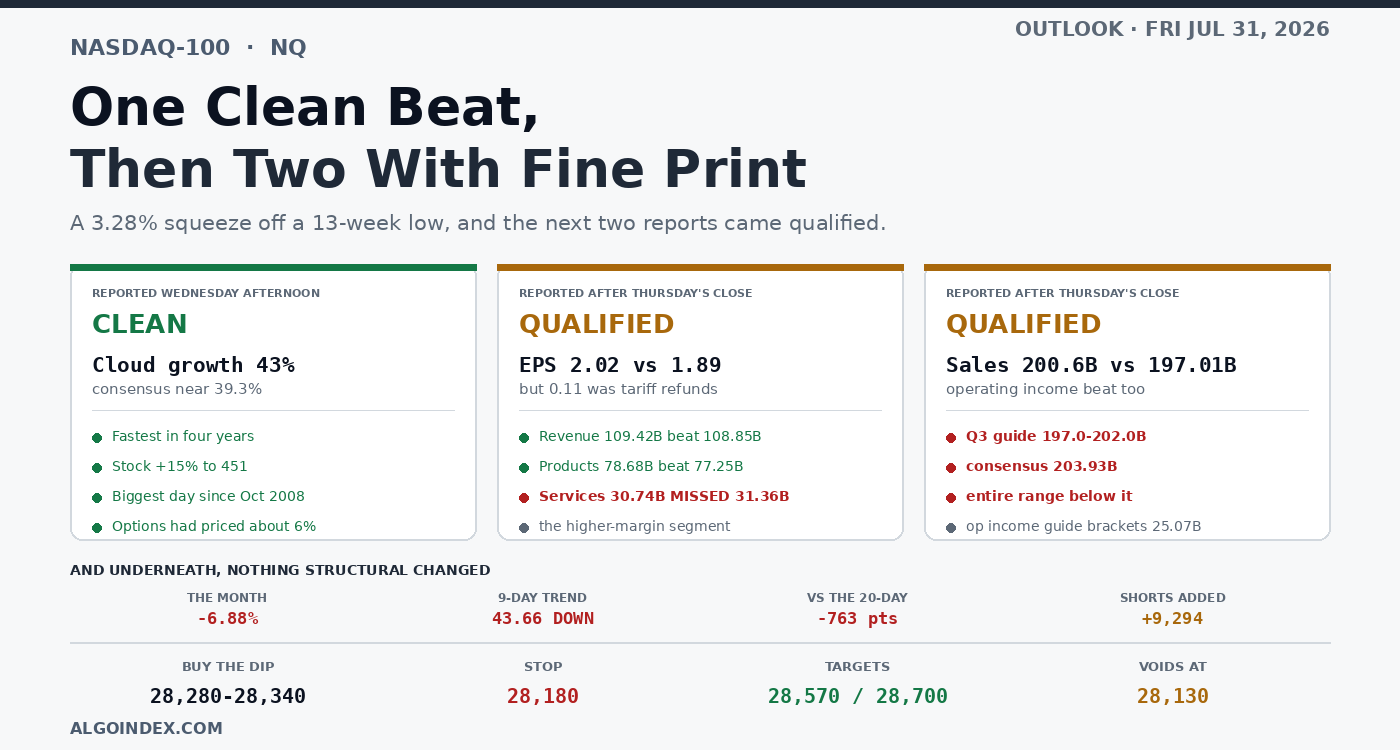
For six weeks the bear case on this index reduced to one sentence: all that artificial-intelligence spending is not turning into revenue. On Thursday afternoon one company answered it. Consensus had cloud revenue growing near 39.3 percent. It grew 43, excluding currency, the quickest quarterly expansion this company has managed in four years. The stock added better than 15 percent to finish at 451, its biggest day since October 2008, and roughly 500 billion dollars of value appeared.
Everything followed. The semiconductor group added around 9 percent, memory and storage names leading it with gains of 26 and 18, then 15.37, 13.00 and 11.41. The Nasdaq contract settled 3.28 percent higher while the broad index managed 1.66 and blue chips 1.19. When the wider market follows this one rather than leading it, you know the move started in a single place.
Then, after the bell, two more of the largest constituents reported. Neither was clean. Wednesday night the problem was that every barrier sat above spot while the index was oversold. Thursday cleared several of them in one go.
One clean beat, then two with fine print
The hardware name. Estimates called for 1.89 dollars. The print was 2.02, though 0.11 of it came from tariff refunds, which makes the real beat considerably thinner than it reads. Revenue cleared its bar, 109.42 billion against 108.85 expected, and products did too at 78.68 versus 77.25. Services is where it breaks down. Expected 31.36 billion, delivered 30.74. That segment carries the higher margins and the higher multiple, and it came up short. Tidy headline, softer interior.
The commerce and cloud name. Against an estimate of 1.99 dollars it printed 5.75, a gap so wide it almost certainly carries non-operating items. Sales landed at 200.6 billion where 197.01 was expected, and at 27.46 billion operating income beat comfortably. The guide is the problem. For the third quarter the company sees sales landing between 197.0 and 202.0 billion. Consensus sits at 203.93. Every point of that guided range falls short of it. On operating income the guide spans 26.5 billion down to 22.5, which does at least straddle a 25.07 expectation. Strong quarter, soft outlook.
Neither result is bad. Neither is the unambiguous thing the market received on Thursday afternoon either. Friday's open is the first chance anyone has to price that difference, and the difference is the whole question.
The squeeze had fuel and someone lit it
Timing explains the violence better than the earnings do. Wednesday printed 27,201.50. That is both a one-month and a 13-week low simultaneously, and it landed the same afternoon the policy decision did. Roughly a day later the catalyst arrived on top of it.
Look at who was positioned. The July 21 report has fast money carrying 46,344 contracts long against 121,034 short, leaving them net short somewhere near 74,690, and across that week they piled on 9,294 more shorts while cutting 1,233 longs. Asset managers held the other side at roughly 72,625 net long. So a heavily short cohort walked into a 13-week low eight days later, and then good news turned up.
Covering a book like that produces precisely what Thursday looked like. It also runs out, because it ends the instant those positions reach flat. What decides Friday is whether real money picks up where the squeeze stopped.
Dealer mechanics added to it. The market traded and closed on the negative side of the gamma line, where hedging amplifies rather than dampens, and the desk note attributed part of that mega-cap run from around 390 up to 450 to the amplification alone. Stripping event volatility out, first the policy meeting and then the inflation print, released more hedging-related buying on top. There is also unconfirmed talk doing the rounds, and it deserves labelling as talk rather than fact, that the best-performing names in the complex were concentrated in one fund whose book got sold this week. Were that accurate, a slice of the advance was positions changing hands rather than new conviction arriving.
One day did not repair anything structural
This is where the enthusiasm meets arithmetic. Settlement came in under two averages: the 20-day, up at 29,001.16, by 763 points, and a 50-day of 29,656.80 by 1,419. The month is still 6.88 percent lower. The index sits 8.60 percent under the record it set on June 3, and yesterday's drawdown reached about 10.
The direction readings are blunter still. Trend strength on the 9-day window reads 43.66, which is high, and its components say downward without hedging: negative movement 26.71 against positive 10.37. The 14-day and 20-day windows agree. One session, however violent, does not shift measurements like those.
Momentum tells the same story from the other side. Strength readings all sit fractionally under neutral, and price needs roughly 29,021 before momentum so much as reaches it. Over five sessions the net gain is 141.75 points, half a percent, which measures the preceding damage better than anything else here does.
What did improve is real, though. The 9-day average has been reclaimed, price finished at the extreme of its own range, the overnight extended instead of fading, and price has taken back the volatility inflection threshold. Sitting just under both the overnight low and the settlement is a 100-day average of 28,077.24, which makes that pocket the shelf worth defending.
Still short gamma, in both directions
Closing at 685.91, the fund proxy gained 3.67 percent and finished above its high volatility point of 681, which is a modest positive for stabilisation. Gamma on the call side reads negative 552.71 million, on the put side negative 1.37 billion, so even after the reclaim this surface is still net short gamma. Whichever direction Friday picks first ought to run further than looks sensible.
Flow was genuinely bullish and part of it was durable. Roughly 7 billion dollars net went through the broad index, split about 3 billion of same-day put selling against 4 billion of call buying further out. Single names added another 3.5 billion of the latter, with 2.3 billion of it sitting in the seven biggest technology companies. Longer-dated call buying is the more meaningful half, because it keeps dealers short gamma and forces them to hedge into strength over time rather than for a single afternoon.
Two cautions on the options surface. Implied rank reads 80.95 percent, skew rank 78.26, both high, which makes options dear and downside protection richly bid. Better to use defined-risk structures than to pay up for long premium. Separately, only 8.19 percent of total gamma sits at the next expiry, with the largest out in December, leaving near-dated positioning thin and this surface less pinned than it usually is.
The overnight risk is a currency decision
Friday has no domestic releases at all. Everything heavy came out Thursday morning, so direction falls to how the earnings get read, to month-end mechanics, and to whatever positioning is left over.
The one scheduled item that matters arrives before any of that. A central bank decision lands at 23:30 Eastern with its policy rate expected to stay at 1 percent. Two things sharpen it. Possible intervention in that currency was flagged in a Thursday headline, and reporting on July 22 suggested the bank would consider moving faster than its customary half-yearly rhythm. A hawkish surprise or a disorderly currency move pressures carry-funded positions, and no domestic benchmark has historically been more sensitive than this one to that channel. It voids the setup below outright.
Month-end works the other way. This index finished July down 6.88 percent, and funds targeting fixed allocations generally have to buy the underperformer to rebalance. That leaves a mild structural tailwind running into the close, partly offsetting the urge to square up before a weekend closing out a week holding one policy meeting, one inflation release and three of this index's largest members reporting.
The trade
Buy a pullback, not the breakout. Entry runs 28,280 to 28,340, which covers Thursday's settlement, the overnight low and an average-convergence stall, and it sits right on top of the base at 28,060 to 28,080, where a 100-day average, a 61.8 percent retracement and a stochastic threshold all land inside 20 points. Stop 28,180. That is about 130 points of risk from the midpoint, 2,600 dollars a contract. Targets are the overnight high at 28,570, then 28,700 at the top of that four-method convergence, then 28,877. Roughly 2.0, 3.0 and 4.4 to one.
Nothing gets chased above 28,500. Invalidation is acceptance under 28,130, which means consecutive closes below that base and not a single wick through it.
A counter-trend short exists only if 28,630 through 28,700 rejects clearly, ideally while the semiconductor complex declines to confirm. Enter on a 30-minute rejection candle, stop 28,790, aiming 28,380, then 28,240, then 28,080. Smaller size. Selling into a market that has just put on 3.28 percent while dealers sit short gamma is a hazardous way to spend an afternoon.
Weighting it: constructive consolidation, holding over 28,240 and working a band from 28,300 up to 28,700, takes 45 percent. Failure and retracement back to the support base takes 30, and closing below it would bring 27,950 into play, then the pocket between 27,816 and 27,775, badly weakening the recovery case. Clean continuation through 28,700 toward 28,833 and 28,950 takes the remaining 25.
Two caveats belong in the open rather than a footnote. The dealer-positioning levels quoted here come from a publication referenced to cash at 27,192, a price from before the rally happened, so the futures translations resting on a 129-point basis are approximate and they reset whenever the surface refreshes. And the liquidation attribution is talk circulating in the market, labelled as talk, not established fact. It appears here because it bears directly on how durable this move should be judged, which is precisely why the label matters.
The honest read on Friday: one company answered the question that had been driving this index lower for six weeks, and the answer was genuinely good. Two more then answered it with qualifications. Underneath, every trend measure still points down, the month is still deeply negative, and a large part of Thursday looks like short covering meeting a low. Trade the shelf and let the open tell you whether real money showed up.
The complete data picture
Every number behind Friday’s plan, charted first; the full numeric reference follows underneath.
Full numeric reference , every remaining figure from the review
| September settlement | 28,237.75, a gain of 3.28 percent |
| Cash index | roughly 28,108.70, up 3.36 percent |
| Broad index / blue chips | up 1.66 percent / up 1.19 percent |
| Recovery from Wednesday | roughly 896 points settle to settle |
| Wednesday's session | opened 27,962.00, closed 27,342.00, down 2.08 percent, low 27,201.50 |
| Globex reopen | opened 28,317.00, range 28,300.00 to 28,572.00, near 28,415, up a further 0.63 percent |
| Overnight volume | 42,788 contracts |
| Open interest | 287,414 |
| 1-hour candle | open 28,478.00, high 28,499.50, low 28,389.50, close 28,432.00 |
| Futures basis | approximately positive 129 points |
| 52-week and all-time high | 31,100.00 on June 3, price 8.60 percent below |
| Drawdown at Wednesday's low | roughly 10 percent |
| One month | opened 30,523.50 on June 30, down 2,099.50 points or 6.88 percent |
| Three months | up 2.08 percent |
| Year to date | up 9.78 percent |
| 52 weeks | up 16.34 percent |
| Five sessions | up 141.75 points, or 0.50 percent |
| 13-week extremes | 27,201.50 to 31,100.00 |
| Position in that range | roughly 27 percent at the settle, roughly 31 percent overnight |
| Four-week high | near 30,553.75 |
| Reversal requirement | a higher low above 28,000 then a close above the four-week midpoint at 28,877.63 |
| 5-day | 28,023.15, price above by 215 points |
| 20-day | 29,001.16, price below by 763 points |
| 50-day | 29,656.80, price below by 1,419 points |
| 100-day | 28,077.24, price above by 161 points |
| 200-day | 27,007.01, price above by 1,231 points |
| Year-to-date | 27,357.64, price above by 880 points |
| 9-day crossing | 28,386.50, reclaimed |
| 18-day crossing | 28,956.87, the next hurdle |
| 9-day stochastic | raw 56.51 percent, %K 36.97, %D 23.63 |
| 14-day stochastic | raw 42.73 percent, %K 27.94, %D 18.59 |
| 20-day raw stochastic | 42.26 percent |
| Relative strength, 9 / 14 / 20-day | 45.22 / 44.44 / 45.54 |
| Momentum reaches 50 at | 29,021.27 |
| Directional index, 9-day | 43.66, positive 10.37, negative 26.71 |
| Directional index, 14-day | 30.18, positive 11.39, negative 26.40 |
| Directional index, 20-day | 21.54, positive 12.89, negative 25.61 |
| Composite | a sell with average strength; short-term roughly 80 percent negative, medium-term netting to hold, long-term roughly 33 percent positive |
| Average true range, 9-day | 710.35 points, 2.50 percent |
| Average true range, 14-day | 706.17 points, 2.48 percent |
| Average true range, 20-day | 696.83 points, 2.45 percent |
| Average true range, 100-day | 514.12 points, 1.81 percent |
| Average daily range, 9 / 14-day | 704.17 / 688.16 points |
| Historic volatility, 9 / 14 / 20-day | 26.37 / 23.30 / 22.91 percent |
| Realised against the long-run norm | roughly 38 percent above |
| Volatility index | 17.08, down 17 percent |
| Second-order measure | 94.66, down 14 percent |
| Fixed-strike volatility | down 1 to 6 points across the curve |
| One-range band around the settle | roughly 27,532 to 28,944 |
| Proxy implied move | 11.18 dollars against 685.91, or 1.63 percent, roughly 460 points |
| Implied band | roughly 27,778 to 28,698 |
| Blended practical expectation | 27,900 to 28,800 outer, most activity 28,150 to 28,600 |
| Overnight high | 28,572.00 |
| Already absorbed | 28,482.06, the 38.2 percent retracement from the four-week low |
| The decision zone | 28,632.00 stochastic equivalent, 28,658.69 first deviation, 28,690.73 retracement from the 13-week low, 28,700.83 first pivot resistance |
| Above | 28,778.75 where the 9-day crossing stalls, 28,833.05 second deviation, 28,877.63 the four-week midpoint |
| The heavier shelf | 28,956.87 the 18-day crossing, 28,966.84 third deviation, 29,001.16 the 20-day average, with the momentum-neutral line at 29,021.27 |
| Where a bounce most plausibly ends | the 28,950 to 29,020 shelf, combining the intermediate average, the outer statistical band and the neutral line near 29,000 |
| Further out | 29,150.75 the 13-week midpoint, 29,163.92 second pivot resistance, 29,497.97 the 40-day crossing |
| Immediate | 28,386.50, the reclaimed 9-day crossing |
| First shelf | the 28,237 to 28,300 pocket, holding the overnight low at 28,300.00, the convergence stall at 28,285.64 and the settlement at 28,237.75 |
| Computed target price | 28,122.42 |
| The support base | 28,077.24 the 100-day, 28,070.93 the 61.8 percent retracement, 28,059.80 the stochastic 30 percent equivalent, three references inside 20 points |
| Beneath | 27,951.42 the pivot, 27,816.81 first deviation support, 27,775.64 the crossover stall, 27,773.70 the stochastic 20 percent equivalent |
| Deeper | 27,642.45 second deviation, 27,508.66 third deviation, 27,488.33 first pivot support |
| The line in the sand | 27,201.50, the one-month and 13-week low |
| Below it | 27,135.25 the 52-week midpoint, 27,007.01 the 200-day average |
| Controlling condition | the market traded and closed in a negative gamma environment |
| Attributed amplification | part of the mega-cap move from roughly 390 to 450 |
| Broad-index hedging flow | approximately 7 billion dollars net bullish |
| Composition | roughly 3 billion of same-day put selling, 4 billion of longer-dated call buying |
| Single-stock flow | roughly 3.5 billion of longer-dated call buying, approximately 2.3 billion from the largest seven technology names |
| Cash-index levels published | call barrier 28,550, volatility inflection 28,060, gamma concentration and put barrier 28,000, gamma flip 27,742 |
| Futures translations | call barrier near 28,679, inflection near 28,189, concentration and put barrier near 28,129, flip near 27,871 |
| Gamma tilt / notional / risk reversal | 0.700 / negative 10.37 million dollars / negative 0.071 |
| Proxy close | 685.91, up 3.67 percent from 661.63, on 50.58 million shares |
| Proxy 52-week range | 551.70 to 748.64 |
| Proxy high volatility point | 681, with price closing above it |
| Proxy call gamma / put gamma | negative 552.71 million / negative 1.37 billion |
| Next-expiry gamma | 8.19 percent of the total, largest expiry December 17, 2026 |
| Implied volatility rank / skew rank | 80.95 percent / 78.26 percent |
| Reference price caveat | levels published against a cash reference of 27,192 predating the rally |
| Fast money | long 46,344, short 121,034, net short near 74,690 |
| Weekly change | added 9,294 shorts, trimmed 1,233 longs |
| Asset managers | long 104,664, short 32,039, net long near 72,625 |
| Commercials | long 164,299, short 176,310, adding 3,154 shorts |
| Dealers and intermediaries | cut 3,050 longs and 8,377 shorts |
| The engine | fiscal fourth-quarter cloud revenue growth excluding currency of 43 percent against a consensus near 39.3 percent, the fastest in four years |
| Share reaction | more than 15 percent to close at 451, the largest single day since October 2008, close to 500 billion dollars of market capitalisation added, against a priced move near 6 percent |
| Semiconductor group | up roughly 9 percent, with individual gains of 26, 18, 15.37, 13.00 and 11.41 percent |
| Hardware name, earnings | 2.02 dollars against a 1.89 estimate, including a favourable 0.11 dollar tariff-refund impact |
| Hardware name, revenue | 109.42 billion against 108.85 billion expected |
| Hardware name, products / services | 78.68 billion against 77.25 expected / 30.74 billion against 31.36 expected, a miss in the higher-margin segment |
| Commerce name, earnings | 5.75 dollars against a 1.99 estimate |
| Commerce name, net sales | 200.6 billion against 197.01 billion expected |
| Commerce name, operating income | 27.46 billion, a comfortable beat |
| Commerce name, third-quarter sales guidance | 197.0 to 202.0 billion against a 203.93 billion consensus, the entire range below |
| Commerce name, operating income guidance | 22.5 to 26.5 billion, bracketing a 25.07 consensus |
| Also reporting, a miss | revenue 1.22 billion against 1.29 billion, transaction revenue 599.2 million against 635.1 million |
| Also reporting, a beat | loss per share 0.63 dollars against 0.97 a year prior, revenue 1.66 billion against 1.52 billion, deliveries 12,194 against 11,471 |
| Capital-intensity datapoint | close to 700 billion dollars in disclosed future spending commitments |
| Infrastructure headlines | a new rack series with capacity up to 3,000 units per month; financing arranged for a data centre; a separate operator in talks to borrow 15 billion dollars for a Texas campus |
| Wednesday's decision | rates unchanged on a 9 to 3 vote, three dissents favouring 25 basis points |
| Run-up | the most uncertainty about a possible hike in roughly three decades |
| Press conference | read as less hawkish than the baseline, driving the two-year yield lower and steepening the curve |
| Relevance here | a steeper curve driven by a falling front end supports long-duration valuations |
| Credit note | the United States private credit default rate reached a new high in the second quarter of 2026 |
| Trade | confirmed discussions on implementation of trade and investment boards, with an expectation that rare-earth and agricultural commitments are met |
| Entry zone | 28,280 to 28,340, on a pullback that holds; no chasing above 28,500 |
| Stop | 28,180, structural |
| Risk | approximately 130 points from a 28,310 midpoint, 2,600 dollars per contract at 20 dollars a point |
| Target 1 | 28,570, roughly 260 points |
| Target 2 | 28,700, roughly 390 points |
| Target 3 | 28,877, roughly 567 points |
| Reward | approximately 1:2.0, 1:3.0 and 1:4.4 |
| Invalidation | acceptance below 28,130, meaning consecutive closes beneath the support base |
| Macro override | a hawkish overnight surprise or a disorderly currency move voids it entirely |
| Trigger | a failed test of 28,630 to 28,700 producing a 30-minute rejection candle, ideally with the semiconductor complex failing to confirm |
| Entry | 28,640 to 28,700 on confirmed rejection |
| Stop | 28,790 |
| Targets | 28,380, then 28,240, then 28,080 |
| Reward | approximately 1:2.4 to the first and 1:4.4 to the third |
| Sizing | smaller; the lower-conviction of the two |
| Constructive consolidation | 45 percent, holding above 28,240 and working 28,300 to 28,700 |
| Failure and retracement | 30 percent, rejecting 28,570 and testing the 28,060 to 28,080 base |
| Continuation | 25 percent, clearing 28,572 and resolving through 28,700 toward 28,833 to 28,950 |
| Low band | 27,900 to 28,080 |
| Mid band | 28,150 to 28,600 |
| High band | 28,700 to 28,950 |
| Overnight expectation | holding the 28,300 shelf with 28,572 as the ceiling, having settled into the 28,390 to 28,440 area |
| Overnight shock | a surprise decision or a disorderly currency move |
| Gap | more than one average true range, roughly 700 points, in either direction |
| No defined risk | opening inside 28,400 to 28,550 and chopping without an opening range |
| Divergence | the semiconductor complex diverging sharply from the index at the open |
| Energy shock | a Middle East headline producing a disorderly move |
| Timing | no trigger by 14:30, since month-end and weekend squaring degrade signal quality |
| Session rules | no entries before 09:45 |
| 23:30 Thursday | Rate statement and decision abroad, policy rate forecast 1 percent, prior 1 percent, the most important scheduled overnight event |
| Overnight | Chinese manufacturing sentiment forecast 50.1 against 50.3 prior |
| 01:00 | Japanese housing starts, forecast 12.7 percent against 33.9 percent prior |
| 02:00 | German import prices, forecast 6 percent against 6.8 percent prior |
| 02:45 | French consumer price and harmonised inflation preliminary readings |
| 06:15 | Energy major, second-quarter results, not an index constituent |
| 07:45 | Pharmaceutical major, second-quarter results, not an index constituent |
| 10:00 | Cabinet meeting, tentative |
| Month end | this index finished July down 6.88 percent |
| August 3 and 4 | Quarterly refunding estimates, then the refunding announcement |
| Generation timing | produced at approximately 22:50 ET rather than the standard 18:00 slot, following a browser outage at the scheduled run |
| Source count | all ten data sources confirmed with evidence read back |
| Level vintage | dealer-positioning levels published against a 27,192 cash reference that predates the rally; futures translations are approximations on a 129-point basis |
| Attribution status | the hedge-fund liquidation account is market chatter reported as such, not confirmed fact, and is labelled accordingly |



