
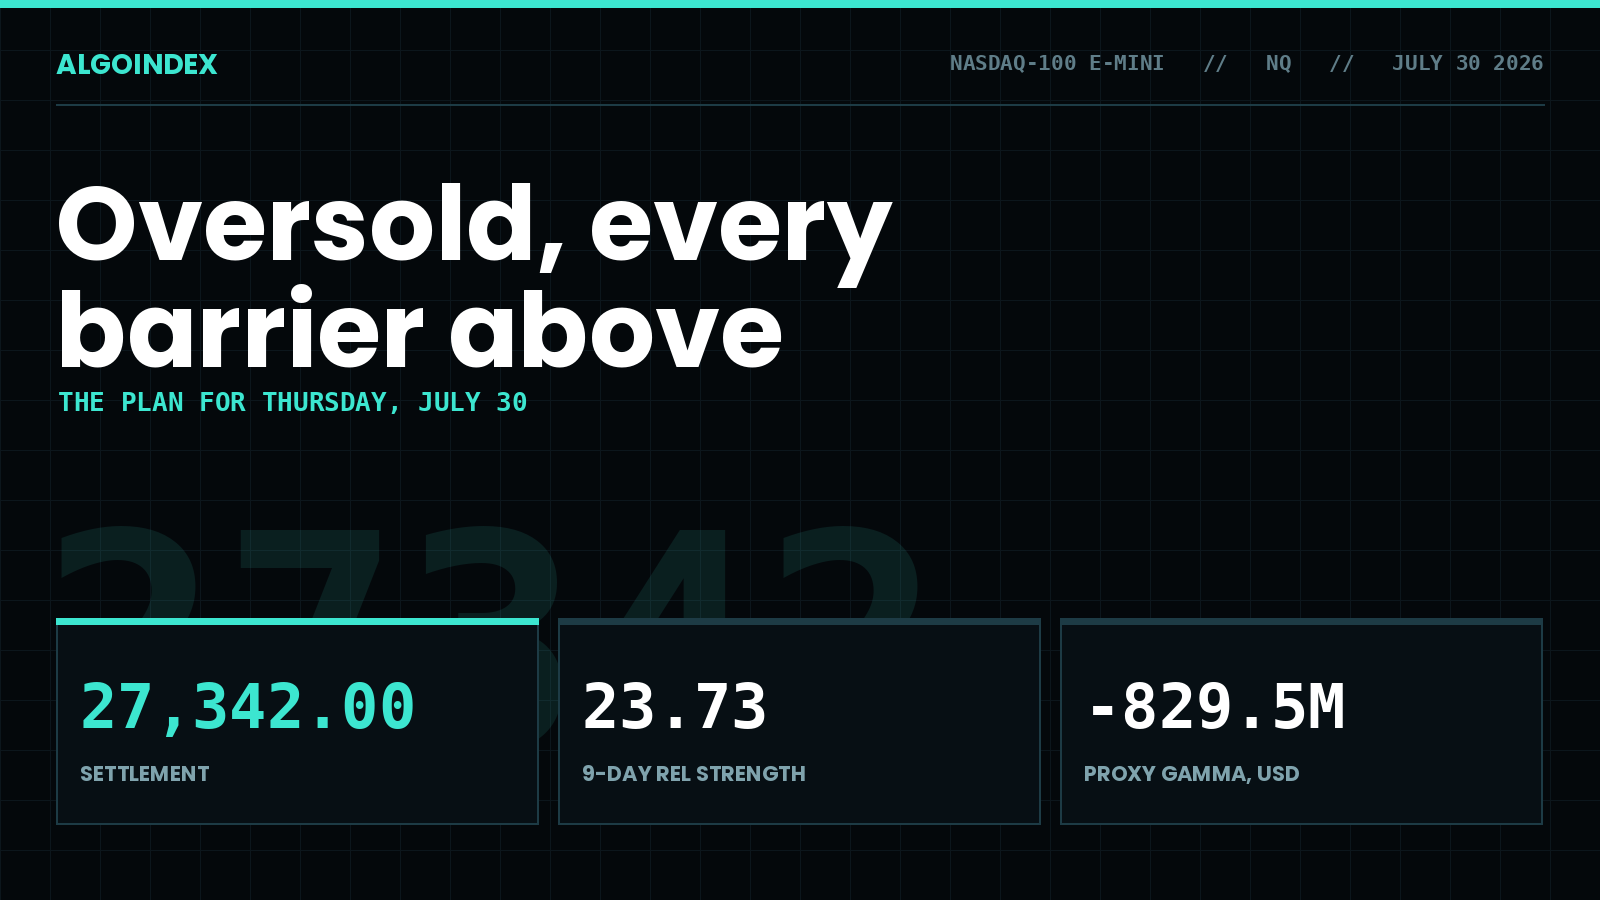
At 6:34 AM ET on Wednesday the front-month Nasdaq contract traded 0.32 percent higher, and the reasoning behind it was defensible. Tuesday's chip selling looked spent. Two of the quarter's largest earnings reports were hours away, with a policy decision sitting between them. That posture lasted ninety minutes. At 9:16 AM ET press reports carried the President's statement that the United States would strike Iran in response to attacks on American targets in Jordan. Crude turned higher. The long end sold off. By the 4:00 PM close the contract had traversed 976.75 points from 28,178.25 down to a fresh three-month low at 27,201.50, settling at 27,342.00, some 140.50 points off that low.
Five straight sessions of deterioration leave Thursday balanced on a contradiction sharp enough to be the entire story. Every trend measure is emphatic. The multi-indicator composite reads 72 percent sell at maximum strength, the nine-day directional index prints 42.26 with negative direction at 34.28 against 5.93 positive, and price trades beneath the five, twenty, fifty and one-hundred-day averages. Every momentum measure is spent. Nine-day relative strength sits at 23.73, the fourteen-day raw stochastic at 4.88 percent, dealer gamma in the fund proxy at negative 829.538 million dollars with every barrier above spot. Thursday is a level session. It is not a direction session.
The overnight reopening has already begun resolving that tension upward. Trading restarted at 27,202.00 at 6:00 PM ET, has not printed beneath that level since, and reached 27,489.50 on the thirty-minute series. One published number belongs on the record first. In Wednesday's plan we sold 27,590 to 27,600 on a confirmed fifteen-minute close beneath 27,603.50, nothing before 14:45, with objectives at 27,438, then 27,346.50, then 27,293. The break came after the press conference and the session took all three. The low printed 27,201.50.
Ninety minutes of goodwill, then the long end took over
The Committee held at 3.75 percent, matching forecast and prior. The vote did the damage. Nine to three, with Hammack, Kashkari and Logan all voting for a 25 basis point increase, against pre-decision pricing of roughly 30 percent on a hike and around 64 percent on no change. A hold was the modal expectation. A hold delivered by a committee carrying a three-member tightening bloc was not, and the statement's note that inflation remains elevated relative to target left no room to read it softly.
The rates reaction is the mechanism that reaches the Nasdaq. The thirty-year Treasury yield surged 2.2 percent to 5.21 percent, its highest of the year and, per market commentary, close to a two-decade high. Long-duration yields are the discount rate on the highest-duration equity index there is. That is why the cash Nasdaq-100 lost 2.06 percent while the S&P 500 lost 1.52 percent, and why the front-month contract fell 2.23 percent against 1.59 percent on the S&P contract.
What the dollar did matters as much. The dollar index closed 0.6 percent lower on a day when both stocks and long-end bonds fell, while spot gold rose 0.7 percent above 4,000 dollars and extended overnight toward roughly 4,130. Three primary United States asset classes weakening together points at a term-premium repricing. A growth scare would have bid bonds. A tightening trade would have bid the dollar. Neither happened.
Crude reinforced the chain, with a 7.167 million barrel inventory draw against a forecast 1 million build at 10:30 AM ET. Geopolitical risk then stayed unresolved into the evening, with strikes framed as limited in degree and de-escalation pressure arriving from Riyadh at the same time. Earlier in the week, reports of new Iran talks had driven crude 7 percent lower. This factor reprices violently in both directions.
The year's mean advance, handed back to the tick
The settlement is 27,342.00. The year-to-date average is 27,344.12. Two points apart. Arithmetic coincidence, but as a reference it says something exact: this contract now transacts at its average traded level for 2026, having handed back the entire year's mean advance while the year-to-date change is still positive at 5.60 percent.
Overhead the average stack is fully inverted: the five-day 729.40 points above at 28,071.40, the twenty-day 1,808.59 above, the fifty-day 2,352.66 above, the one-hundred-day 677.05 above at 28,019.05. Beneath price there is exactly one major average left. The two-hundred-day at 26,978.94 sits 363.06 points under the settlement, 222.56 under Wednesday's low, and 9.36 points from first pivot support at 26,969.58. Add the translated put-side barrier near 27,030 and three methods agree inside 61 points. That is the most important structural fact on this chart.
Range position frames the rest. Against a fifty-two-week span of 23,170.50 to 31,100.00, a width of 7,929.50 points, the settlement sits at 52.6 percent of the range, and the 50 percent retracement computes to 27,135.25, some 206.75 points below the settlement and 66.25 below the session low. A twenty-day change of minus 10.42 percent against a fifty-day of minus 7.32 percent says the decline steepened this month rather than unwinding evenly. The longer changes stay positive at 8.89 and 9.06 percent. Weighted alpha is still 11.40.
Oversold, and still trending
Relative strength reads 23.73 at nine days, 31.46 at fourteen, 36.90 at twenty, 46.72 at fifty and 50.50 at one hundred, the fourteen-day down 4.08 on the day. The oscillators step down cleanly with horizon. Raw stochastics print 6.49, 4.88, 4.19 and 3.60 percent across the same short windows while the one-hundred-day stays mid-range at 52.61. Formal oversold on the fourteen-day arrives at 27,113.49, another 0.84 percent lower.
Trend argues the other way, and it argues hard. A nine-day directional index of 42.26 with negative direction at 34.28 against 5.93 positive is a ratio near six to one, and readings above 40 with that asymmetry describe an established one-sided trend. The twenty-day at 20.09 shows it was forming before this week. The composite's path is as telling as its level: 16 percent buy a month ago, 32 percent sell a week ago, 72 percent sell today.
Volume settles the character question. A five-day average of 665,873 contracts stands 19 percent above the twenty-day 557,587 and 84 percent above the fifty-day 362,554. Falling price on rising participation is distribution. Positioning cuts both ways: as of July 21 fast-money accounts held 121,034 short against 46,344 long, a net short of 74,690 that grew by 9,294 contracts on the week. That is fuel for a covering advance. It also puts committed sellers behind a break of 27,201.50. Our performance statement carries the graded record.
Every barrier sits above the market
In the Nasdaq fund proxy, Wednesday's 661.73 close finished 1.73 above the put-side gamma barrier at 660 and 23.27 below the call-side barrier at 685, with the dealer gamma flip level at 694 and the volatility inflection level at 705. Gamma notional reads negative 829.538 million dollars, tilt 0.590. On the cash index the equivalent structure translates through the 30-point basis to roughly 27,030 put-side, 28,030 inflection and 28,580 call-side. We track how well levels like these hold in the public level accuracy study.
Negative dealer gamma amplifies rather than dampens, in both directions, and nothing dampens at all between spot and 28,000 on the cash index. Wednesday showed the downside version. Real-time hedging flow ran near positive 10 billion dollars in delta notional and supported the market from 12:20 to 2:50 PM ET, then rolled over around 3:00 PM, at which point broader selling overwhelmed the hedging and produced the sharpest decline of the day. The overnight session is expressing the upside version of the identical mechanism.
Two reports, opposite directions
The largest software constituent beat on everything that mattered: adjusted earnings of 4.74 dollars against 4.25 expected, revenue of 90.01 billion against 87.72 billion, and cloud revenue of 59.3 billion growing at its fastest pace since 2022. The figure with the longest tail is leases not yet commenced, roughly 329 billion dollars as of June 30 against 197 billion previously. Shares rose about 2 percent after hours from 390. Cloud was the tell.
The largest social platform missed where it counts. Operating income of 18.78 billion dollars fell 8.2 percent year over year and third-quarter guidance of 61 to 64 billion sits below a 63.17 billion consensus. Shares fell roughly 11 percent, well past the 7 percent priced. Weighted against index composition that is plus 0.16 percent against minus 0.39 percent, a net drag near 0.22 percent. The contract is 0.45 percent higher anyway, which means the complex is bouncing on its own account.
Underneath the index averages, the single-name damage was violent. A power and cooling infrastructure supplier fell 17.26 percent, a memory manufacturer 9.94 percent, a memory and storage name 7.32 percent, a major logic and graphics designer 5.51 percent. Those are liquidations. The index-level figure hides them. Policy landed the same afternoon: the President stated plainly that the administration is looking at controls on artificial intelligence. For a sector whose forward revenue depends on export access, that was the most consequential sentence of the day.
The plan is a level, and it waits
The primary trade is long, and it only exists at 27,020 to 27,090. That zone requires a decisive tag with absorption, meaning a rejection candle or a failure to extend on the fifteen-minute series. Stop below 26,930, roughly 125 points of risk from the 27,055 midpoint. Targets 27,201.50, then 27,342.00, then 27,573.92, paying about 1 to 1.2, 1 to 2.3 and 1 to 4.2. The mirror trade is short at 28,020 to 28,150 on a failed test of the overhead shelf, stop above 28,240, working 27,820.19, then 27,573.92, then 27,342.00.
Both entries are gated. Nothing before 9:45 AM ET, because the opening fifteen minutes after the largest scheduled inflation print of the month is information rather than a level. Nothing after 4:00 PM, and nothing carried into the close, because two of the three largest constituents report immediately after it. Stand down entirely if core personal consumption expenditure prices arrive at or above 3.5 percent year over year, or if the thirty-year yield extends above 5.30 percent intraday. Weighting the session: failed bounce and bearish continuation at 40 percent, oversold recovery and covering advance at 35 percent, event-gated range at 25 percent. That last case reaches neither zone. No action is the action.
The two-hundred-day average is the only long-term line this index has left, and it sits 363 points under a market that just spent a single afternoon proving it can travel 976.
The complete data picture
Every number behind Thursday’s plan, charted first; the full numeric reference follows underneath.
| 29,081.54 | fourteen-day relative strength reaches 50 |
| 29,024.73 | eighteen-day average crossover |
| 28,923.08 | third pivot resistance |
| 28,773.25 | nine-day average stall |
| 28,580 | call-side dealer barrier, translated from 28,550 on the cash index |
| 28,550.67 | second pivot resistance |
| 28,499.63 | 38.2 percent retracement from the four-week low |
| 28,454.13 | nine-day average crossover |
| 28,178.25 | Wednesday's session high, derived from the pivot, low and settlement |
| 28,170.25 | three deviation resistance |
| 28,142 | dealer gamma flip, translated from 28,112 |
| 28,071.40 | five-day average |
| 28,070.93 | 61.8 percent retracement from the fifty-two-week low |
| 28,064.38 | fourteen-period raw stochastic reaches 30 percent |
| 28,030 | volatility inflection level and primary gamma concentration strike, translated from 28,000 |
| 28,019.05 | one-hundred-day average |
| 28,018.26 | two deviation resistance |
| 27,946.33 | first pivot resistance |
| 27,820.19 | one deviation resistance |
| 27,776.75 | fourteen-period raw stochastic reaches 20 percent |
| 27,573.92 | the daily pivot, arbiter of the session |
| 27,489.50 | overnight high on the thirty-minute series |
| 27,459.74 | fourteen-day %K stochastic stall |
| 27,344.12 | year-to-date average |
| 27,342.00 | Wednesday's settlement, first support |
| 27,268 | put-side dealer barrier, translated from the fund proxy |
| 27,202.00 | overnight reopening print and overnight session low |
| 27,201.50 | Wednesday's low, the one-month low and the thirteen-week low, tested twice |
| 27,135.25 | 50 percent retracement of the fifty-two-week range |
| 27,113.49 | fourteen-day relative strength reaches 30 |
| 27,063.22 | computed target price |
| 27,030 | put-side dealer barrier, translated from 27,000 on the cash index |
| 26,978.94 | two-hundred-day average, the last long-term line standing |
| 26,969.58 | first pivot support |
| 26,863.81 | one deviation support |
| 26,726.25 | three against ten-day average crossover stall |
| 26,665.74 | two deviation support |
| 26,597.17 | second pivot support |
| 26,513.75 | three deviation support |
| 26,199.57 | 38.2 percent retracement from the fifty-two-week low |
| 25,992.83 | third pivot support |
| 24,653.42 | fourteen-day relative strength reaches 20 |
| 23,170.50 | fifty-two-week low |
| Wednesday session | opened near 27,965, high 28,178.25, low 27,201.50, settled 27,342.00, only 140.50 above the low |
| Close position in the span | bottom 14 percent of a 976.75-point traverse, a 3.49 percent move on the prior settlement |
| Sequence of decline | 06:34 quoted 0.32 percent higher, 10:06 cash down 0.23 percent, 11:25 down 0.98 percent, final hour did the damage |
| Overnight session so far | reopened 27,202.00 at 18:00, low 27,202.00 untested since, high 27,489.50, last near 27,465 |
| Overnight advance | roughly 288 points off the reopen, 123 above the settlement, 0.45 percent higher |
| Overnight reference band | 27,202.00 to 27,489.50, expected to hold 27,202.00 to 27,573.92 absent a European shock |
| Cash index and proxy | cash Nasdaq-100 closed near 27,312 and fell 2.06 percent, fund proxy 661.73 against a prior 675.50 |
| Futures basis | approximately 30 points at settlement |
| Expected opening range | 150 to 250 points, wide enough that trading inside it has no edge |
| 01:30 | French gross domestic product quarter over quarter prelim, 0.2 percent against minus 0.1 percent |
| 02:00 | German gross domestic product flash, 0.1 percent quarter over quarter against 0.3 percent, 0.6 percent year over year |
| 03:00 | Swiss KOF indicator, 100.9 against 101.2 |
| 04:00 | Italian gross domestic product prelim quarter over quarter, 0.05 percent against 0.3 percent |
| 05:00 | Eurozone gross domestic product prelim flash, 0.2 percent quarter over quarter against minus 0.2 percent and 0.7 percent year over year; unemployment rate 6.2 percent unchanged |
| 07:00 | Bank of England bank rate and rate statement, 3.75 percent unchanged, prior vote 7 unchanged against 2 for a hike |
| 08:00 | German consumer price index prelim, 2.7 percent year over year against 2.30 percent, harmonised 2.8 percent against 2.40 percent, 0.7 percent month over month against minus 0.30 percent; a major payments network reports second-quarter results |
| 08:30 | Core personal consumption expenditure prices 3.3 percent year over year against 3.4 percent and 0.2 percent month over month against 0.3 percent; headline 3.7 percent against 4.1 percent and minus 0.1 percent against 0.4 percent; core advance prices 3.5 percent against 4.4 percent; gross domestic product advance 2 percent against 2.1 percent with the price index 4 percent against 3.6 percent; initial jobless claims 200,000 against 187,000 and continued claims 1.795 million against 1.796 million; personal income 0.3 percent against 0.7 percent, consumer spending 0.4 percent against 0.7 percent, real personal consumption 0.4 percent against 0.3 percent |
| 16:00 | the dominant e-commerce and cloud constituent reports second-quarter results |
| 16:05 | an electric vehicle manufacturer reports second-quarter results |
| 16:15 | a digital asset exchange reports second-quarter results |
| 16:30 | the largest hardware constituent reports third-quarter results |
| 19:30 | Tokyo consumer price index, core 1.8 percent against 1.6 percent; Japanese unemployment and jobs-to-applicants ratio |
| 19:50 | Japanese industrial output and retail sales |
| 21:30 | Chinese national manufacturing purchasing managers index, 50.1 against 50.3 |
| 23:30 | Bank of Japan rate statement and decision, 1 percent unchanged |
Full numeric reference, every remaining figure from the review
| Wednesday | down roughly 624 points, 2.23 percent |
| Five sessions | down 1,839.25 points, 6.30 percent |
| Twenty sessions | down 3,181.50 points, 10.42 percent |
| One month | down 2,710.75 points, 9.02 percent from the June 29 reference |
| Fifty, one-hundred and two-hundred sessions | minus 7.32 percent, plus 8.89 percent, plus 9.06 percent |
| Year to date | plus 5.60 percent, weighted alpha plus 11.40 |
| 52-week high and low | 31,100.00 on June 3 and 23,170.50, a span of 7,929.50 points |
| One-month and thirteen-week extremes | high 30,599.75 on June 30, thirteen-week high 31,100.00 on June 3, both lows 27,201.50 |
| Swing pivots for Thursday | 27,201.50 reference low, 27,489.50 overnight high, 28,178.25 last swing high |
| 9-day | raw 6.49 percent, %K 10.95, %D 10.15 |
| 14-day | raw 4.88 percent, %K 9.83, %D 9.55 |
| 20-day | raw 4.19 percent, %K 8.08, %D 7.70 |
| 50-day | raw 3.60 percent, %K 6.88, %D 6.49 |
| 100-day | raw 52.61 percent, %K 58.61 |
| Relative strength levels | 30 at 27,113.49, a further 228.51 points or 0.84 percent lower; 50 at 29,081.54; 20 at 24,653.42 |
| Overall | 72 percent sell, strength strong, direction strongest, trend signal sell |
| Short-term group | 100 percent sell, all five components |
| Medium-term group | 50 percent sell, the 20 against 100-day crossover still reads buy |
| Long-term group | 33 percent sell, the 50 against 100-day crossover still reads buy |
| Trajectory | 16 percent buy a month ago, 32 percent sell a week ago, 72 percent sell yesterday and today |
| Average true range | 700.47 at 9 days, 698.03 or 2.55 percent at 14, 612.50 at 50, 508.90 at 100 |
| Average daily range | 683.06 at 9 days, 657.64 at 14, 588.93 at 100 |
| Wednesday's realized range | 976.75 points, 1.40 times the 14-day true range and 1.49 times the 14-day daily range |
| Historic volatility | 17.60 percent at 14 days, annualising to roughly a 1.11 percent expected daily move, 19.52 percent at 20 days |
| Implied volatility | 24.91 percent front month at 50 days to expiration, restoring a volatility risk premium |
| Proxy volatility ranks | implied 75.25 percent, skew 61.51 percent, variance model 53.56 percent |
| Proxy implied move | 11.05 dollars on a 675.50 reference, roughly 1.64 percent |
| Broad index implied | 23.59 percent at the money for Thursday, roughly 147 basis points; Wednesday's move exceeded double the 72 basis point same-day straddle |
| Surface and volatility index | fixed-strike volatility up 0.3 to 1.0 points, volatility index 20.63 and up 1.68 percent |
| Beta-scaled expectation | 147 basis points times a 1.35 beta gives roughly 2.0 percent, plus and minus 547 points |
| Proxy structure | put barrier 660 with a companion 660.10, call barrier 685, flip 694, concentration 700, inflection 705, high-volatility point 684 |
| Proxy gamma | notional negative 829.538 million dollars, tilt 0.590, next expiry negative 645 million |
| Proxy volume and open interest | 1.509 million puts against 1.473 million calls, open interest 6.524 million against 5.108 million |
| Cash index structure | put barrier 27,000, inflection and concentration 28,000, flip 28,112, call barrier 28,550, tilt 0.785, notional negative 6.575 million |
| Cash index distances | closing near 27,312, price sat 800 points below the flip and 688 below the inflection level |
| 25-delta risk reversal | 0.00 on the proxy, negative 0.071 on the cash index |
| Broad-complex hedging flow | roughly positive 10 billion dollars in delta notional, supportive from 12:20 to 14:50, rolling over near 15:00, mostly same-day expiries |
| Visible positions | an approximately 8,000-lot same-day iron condor at 7,475 and 7,480 against 7,325 and 7,320, put side breached into the close, and a 13,000-lot put opened at 7,290 near 13:00 |
| Negative gamma extent | reaching down to the 7,000 strike on the broad index beyond Wednesday's expiration |
| Desk level framework | resistance 7,500, 7,525, 7,550 and 7,600, pivot 7,450, support 7,400 and 7,300, with the broad index closing 7,316 beneath both |
| Fast-money accounts | short 121,034 against long 46,344, a net short of 74,690; shorts up 9,294, longs down 1,233 |
| Asset managers | long 104,664 against short 32,039, longs reduced by 2,080 |
| Commercials | short 176,310 against long 164,299, shorts added 3,154 |
| Dealers and intermediaries | net short 5,700, shorts cut 8,377 and longs cut 3,050 |
| Other reportables | long 8,565 against short 8,265, roughly flat |
| Volume and open interest | five-day 665,873, twenty-day 557,587, fifty-day 362,554, open interest 292,420 |
| Decision | held at 3.75 percent, matching forecast and prior, vote 9 to 3 |
| Dissenters | Hammack, Kashkari and Logan, all for a 25 basis point increase |
| Pre-decision pricing | roughly 30 percent on a hike, around 64 percent on no change |
| Thirty-year yield | 5.21 percent, up 2.2 percent, the highest of the year |
| Dollar and gold | dollar index down 0.6 percent, spot gold up 0.7 percent above 4,000 dollars and extending to roughly 4,130 overnight |
| Crude inventories | a 7.167 million barrel draw against a forecast 1 million build |
| Effective tariff rate | 7.4 percent, per a major ratings agency, on the latest tariffs and changing trade flows |
| Index performance | Dow minus 2.19 percent, cash Nasdaq-100 minus 2.06 percent, S and P 500 minus 1.52 percent, Nasdaq contract minus 2.23 percent, S and P contract minus 1.59 percent |
| Sector extremes | two exploration and production names up 4.64 and 3.89 percent, two airlines down 5.70 and 3.39 percent, a logistics name down 4.39 percent |
| 09:16 Wednesday | press reports carried the statement that the United States would strike Iran in response to attacks on American targets in Jordan |
| Afternoon escalation | strikes framed as limited in degree, a request that Congress add Iran tariffs to the Russia sanctions legislation, and comments on Chinese weapons transfers judged unlikely but unwelcome |
| De-escalation pressure | the Saudi Defense Minister met the Vice President at the White House and stressed support for de-escalation despite a joint United States and Saudi strike on militias in Iraq, and is separately seeking an international coalition to protect Red Sea shipping from Houthi attacks |
| Other developments | Iranian authorities reported seizing four smuggling vessels in Bushehr waters; earlier reports of a China-initiated Pakistan and Iran path toward new talks with the United States had driven crude 7 percent lower |
| Largest software constituent | fourth-quarter earnings 4.81 dollars, adjusted 4.74 against 4.25 expected, revenue 90.01 billion against 87.72 billion, operating income 40.60 billion against 39.02 billion |
| Its cloud and capital spending | cloud revenue 59.3 billion at the fastest growth since 2022, capital expenditure including leases 41 billion against 42.05 billion, excluding leases 35.80 billion against 35.22 billion, leases not yet commenced roughly 329 billion as of June 30 against 197 billion |
| Its share reaction | closed 390, up approximately 2 percent in extended trading |
| Largest social platform | second-quarter earnings 6.18 dollars against 7.14 a year earlier, revenue 60.80 billion against a 60.24 billion estimate, advertising revenue 59.36 billion against 59.07 billion, operating income 18.78 billion and down 8.2 percent year over year |
| Its guidance and reaction | third-quarter revenue 61 to 64 billion against a 63.17 billion consensus, capital expenditure guidance narrowed, shares down approximately 11 percent to around 520 against a 7 percent priced move and a four-quarter average near 10 percent; management framed monetisation as a business-in-a-box service combining subscriptions with volume-based pricing |
| Index weighting arithmetic | plus 0.16 percent against minus 0.39 percent, a net drag near 0.22 percent, against a contract 0.45 percent higher overnight |
| Single-name declines | power and cooling infrastructure minus 17.26 percent, memory minus 9.94 percent, memory and storage minus 7.32 percent, logic and graphics minus 5.51 percent, analog and connectivity minus 5.40 percent |
| Mobile chipset supplier | adjusted earnings 2.21 dollars in line, adjusted revenue 9.95 billion against 9.62 billion expected, fourth-quarter guidance 2.05 to 2.25 dollars against a 2.35 consensus |
| Its commentary | China original-equipment handset revenue reached a bottom in the third quarter, and its chipsets power approximately 70 percent of the largest Korean handset maker's flagship devices |
| Policy developments | the President stated the administration is looking at controls on artificial intelligence; the chief executive of the dominant accelerator designer was hosted and praised in the Oval Office; the head of a leading laboratory was reported meeting senior officials, lawmakers and economists ahead of a framework deadline; a United States-hosted summit is scheduled for September 8 in Lima |
| Entry zone | 27,020 to 27,090, on a decisive tag with absorption on the fifteen-minute series, never the first touch of the upper edge |
| Stop | below 26,930, roughly 125 points of risk from the 27,055 midpoint |
| Targets | 27,201.50 at about 147 points, 27,342.00 at about 287 points, 27,573.92 at about 519 points |
| Risk to reward | approximately 1 to 1.2, 1 to 2.3 and 1 to 4.2 |
| Invalidation | a fifteen-minute close beneath 26,930, a decisive break on expanding volume without absorption, or arrival as a vertical move inside the first fifteen minutes after 08:30 |
| Macro override | stand down on core personal consumption expenditure at or above 3.5 percent year over year, or a thirty-year yield above 5.30 percent intraday |
| Entry zone | 28,020 to 28,150, requiring a failed test and a rejection on the fifteen-minute series rather than acceptance above |
| Stop | above 28,240, roughly 155 points of risk from the 28,085 midpoint |
| Targets | 27,820.19 at about 265 points, 27,573.92 at about 511 points, 27,342.00 at about 743 points |
| Risk to reward | approximately 1 to 1.7, 1 to 3.3 and 1 to 4.8 |
| Invalidation | a fifteen-minute close above 28,240, or acceptance above 28,180 on rising volume, which would mean the covering advance is running rather than stalling |
| Failed bounce and bearish continuation | 40 percent, print at or above forecast, the pivot rejects, 27,201.50 breaks toward 27,135, 27,063 and the 26,969 to 27,030 base |
| Oversold recovery and covering advance | 35 percent, print at or below 3.2 percent, acceptance above 27,573.92 opening 27,776, 27,946 and the 28,000 to 28,180 zone |
| Event-gated range | 25 percent, an in-line print near 3.3 percent, compression between 27,250 and 27,570, no setup triggers |
| Expected bands | high 27,950 to 28,060, most-likely midpoint 27,350 to 27,500, low 26,850 to 26,970 |
| Session rules | no entry before 09:45 or after 16:00, and no directional position carried into the 16:00 close |
| Other skips | oscillation between 27,250 and 27,570 without tagging either zone, a zone reached as a vertical gap rather than a tested approach, or the thirty-year yield moving more than 5 basis points against the intended position at the moment of entry |
| Sizing constraint | size for a fourteen-day average true range of 698.03 points, after a session that delivered 1.40 times it |
| Afternoon management | treat 15:00 as a decision point rather than a continuation point, take partial profit on anything at first target before that hour, and expect compression between roughly 13:30 and 15:30 |
| Dealer-positioning source | derived from the Nasdaq-100 fund proxy and the cash Nasdaq-100 index, not from options on the futures contract, and translated using the 30-point settlement basis |
| Desk commentary source | an institutional options-desk note published Wednesday, July 29 at 17:22, reflecting a completed end-of-day state after the 16:00 cash close, with market-wide context drawn from the broad index |
| Derived figure | Wednesday's 28,178.25 session high is computed from the published pivot together with the confirmed session low and settlement |
| Positioning date | reported positioning is as of July 21 and lags the last five sessions of price action |



