
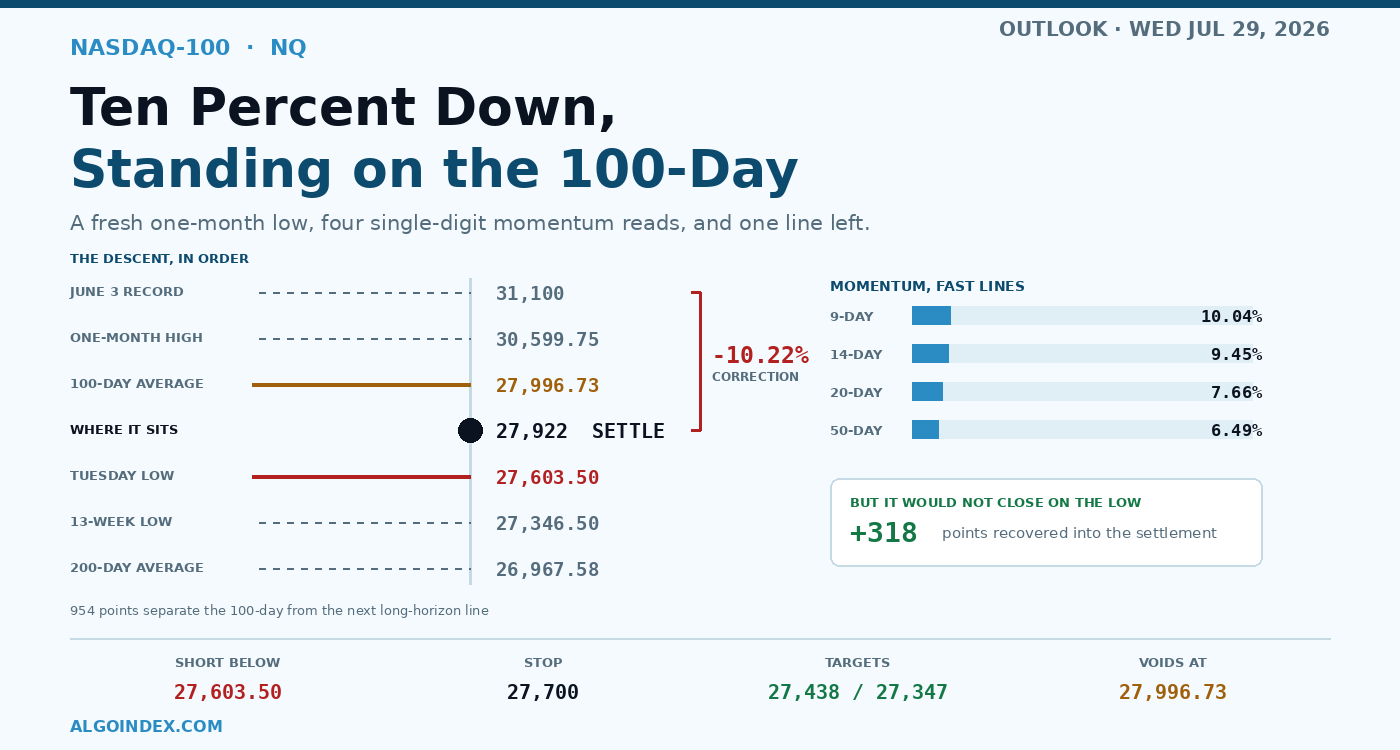
Tuesday cut the equity market in half. Blue chips finished 1.03 percent higher at their best level in a week and a half, the broad index managed 0.21 percent, and September Nasdaq futures settled 0.88 percent lower at 27,922.00. The cash version dropped 0.98 to 27,763.13, which leaves it 10.22 percent under the record it set on June 3. That is the conventional threshold for a correction, and it arrived on a day when most of the market rose.
Where it stopped is the part that matters. The contract printed 27,603.50 during the session, a fresh one-month low, and then climbed roughly 318 points into the settlement. It wouldn't finish on its low. And it is now sitting within 75 points of its 100-day average. Monday night the base was 132 points deep and the calendar was empty. Tuesday took out the low and the calendar filled up.
That average is doing an enormous amount of work
The 100-day sits at 27,996.73. Price closed a little underneath it, and the evening reopen has traded back above. There isn't another long-horizon reference anywhere near it: the 200-day is down at 26,967.58, some 954 points away, and the year-to-date average at 27,344.14 is the only thing in between.
So this one line carries the whole distinction between a pullback inside an uptrend and a genuine structural break. Above it, the twelve-month advance stays intact and Tuesday reads as an ugly sector rotation. Below it and accepted, the argument gets much harder to make.
Everything on the shorter horizons is already broken. The 5-day sits 517 points overhead, the 20-day 1,388 and the 50-day 1,816. Crossing back above the 9-day would take 711 points, the 18-day 1,256, the 40-day 1,739. Those distances describe how far this contract has travelled from anything resembling repair.
The damage has an address
This was not broad de-risking. Money went into healthcare and staples, each up around 2 percent, and into cyclicals that have trailed all year. It came out of exactly one place.
The semiconductor index shed 4.49 percent to close at 11,035.68, and the sector fund dropped closer to 5. Inside it the individual damage was far uglier than the index figure lets on. One packaging name gave up 24.74 percent inside a single session. A storage name shed 14.25. Then 12.10 on a glass and optics maker, 8.53 and 8.15 and 7.82 and 6.91 across four more. Two memory leaders that drove the last leg higher now trade roughly 37 and 55 percent below where they were a month ago.
Two stories are behind it and neither resolves quickly. One is doubt about whether the capital being poured into artificial-intelligence infrastructure will earn a return, which attacks the earnings assumptions running through the entire supply chain. The other is Chinese competition intensifying at the equipment end. Those are structural questions, not sentiment wobbles, and they do not get answered by one good quarter.
There is a counterweight worth holding onto. One of Wednesday evening's reporters informed customers late in July of a double-digit percentage price increase. A company with pricing power being sold on margin fears is a contradiction, and it gets tested directly on that call.
Oversold enough to matter
The fast momentum readings are as compressed as this contract gets. Stochastic fast lines print 10.04 on the 9-day lookback, 9.45 on the 14-day, 7.66 on the 20-day and 6.49 on the 50-day. Four consecutive windows in single digits. Relative strength on the 9-day reads 29.05, which is beneath the conventional oversold threshold, and the 14-day sits at 35.54 after shedding 2.09 on the day.
For scale: the 14-day reading would only reach 30 with price down at 27,095.91, and it returns to neutral at 29,215.36. That gap frames how much compression is already in the spring.
Against all that, the trend measures say the decline is mature rather than exhausted. The 9-day strength reading is 38.73 with downside direction at 33.02 against 7.01 on the upside, close to five to one. And realised volatility on the short horizon reads 16.28 percent against 24.93 on the 50-day, meaning this decline has been orderly. Orderly isn't what capitulation lows look like. Volume also expanded into it, the 5-day figure of 593,738 sits above a 20-day of 540,837 and far above a 50-day reading of 346,244. Price falling while participation rises is distribution.
Dealer positioning removes the safety net
Reading the Nasdaq fund proxy, the call side prints negative 488.09 million in gamma and the put side negative 1.39 billion, with notional estimated near negative 838.34 million. Both sides of the book sit negative. Dealers in that configuration hedge with the direction of travel, selling weakness and buying strength, which widens intraday movement rather than containing it.
At 675.49 on the proxy there is no positive cushion nearby at all. It is beneath its put barrier at 680, beneath a primary concentration strike of 700, beneath the 701 flip level, and comfortably beneath the 705 inflection. Nearest upside barrier worth naming is 730, over 8 percent distant, which makes it irrelevant across one session.
Converted to futures those become roughly 28,338 for the flip and 28,159 for the put barrier. Both sit above the market. Positioning also leans defensive across the board: on the cash index 15,105 puts traded against 8,900 calls, with put open interest at 90,163 versus 83,747 on calls, a 1.3 put-to-call ratio on the proxy, and a risk reversal at the 25-delta of negative 0.074.
One nuance about Tuesday's flow deserves care. Hedging flow across the broad complex registered about 9 billion in delta notional, its strongest single day of the month, and nearly the whole of it landed in the two hours after the open, driving an 82 basis point advance. That reads constructive until you notice where it landed. The buying was in the broad index, not in technology, it faded after 11:30, and the put position supporting it began unwinding in the afternoon. Rescue money went everywhere except technology, which is the same story the whole session told.
Two events, two hours apart
Policy stands at 3.75 percent with consensus for no change, but futures put roughly 32 percent on a hike. Nobody is debating how large a cut might be. Genuine tightening risk is being priced, and for long-duration technology equity that is a different world entirely.
The hawkish case has been accumulating. Nine of eighteen participants signalled an increase during 2026 at the last meeting, and the statement dropped its language about additional adjustments. Monday brought a widely read note from a large market-making firm that pushed the discussion further into the open. Cutting against it, June core consumer prices came in two basis points negative, which one large bank reckons works out near 18 basis points on the core personal-consumption figure and begins a softer run. The rates market is showing strain regardless: the seven-year auction on Tuesday tailed, its high yield 4.473 percent versus 4.260 before, cover 2.490.
The asymmetry sits badly. At 68 percent already priced, delivering the hold buys only modest relief. A hike arrives at an index already 10 percent off its high, where dealer hedging is set to amplify whatever follows.
Then, minutes after the close, two of the largest constituents report, along with a mobile-chip designer, a coffee retailer and three more names. Implied moves run roughly 12 percent, 10, 9, 7 and 6 across the group. The 7 percent name has averaged closer to 10 across its past four reports, so options appear to be pricing a smaller reaction than the record justifies. Thursday brings another mega-cap after the close and Friday a fourth. This index reprices its four biggest components inside seventy-two hours.
The plan, and why it waits
The primary trade is a short. The structural case is complete: every short and intermediate average overhead, a mature downtrend on the direction readings, a composite that has walked from 8 percent buy last month, through 40 and 56 percent sell, to 72 percent sell today, with every one of its six short-term components on sell, expanding volume into the decline, and a sector rout with no visible resolution.
But the entry waits. Sell 27,590 through 27,600, but only once a 15-minute bar has closed under 27,603.50, and only after 14:45 once the statement and the press conference have set the tone. The market has to prove it can take that level out rather than have the trade anticipate it. Stop 27,700, above the reclaimed support band. Targets run 27,438, then April's 27,346.50 low, then 27,293. Roughly 1.5, 2.4 and 2.8 to one.
Skip it outright on an explicitly dovish surprise. With fast money net short 74,690 contracts, having added 9,294 to that position in a single reporting week, and momentum this compressed, a dovish print sets off a squeeze that goes through technical resistance without pausing to look at it. Skip it as well if the break only arrives after 15:30, because the earnings gap thirty minutes later cannot be managed.
The conditional long needs the mirror image: hold that 27,603.50 low all morning, take the 100-day back, then close a 15-minute bar over Tuesday's 28,013.25 ceiling once the statement is out. Buy the 28,020 through 28,050 pocket on that reclaim, stop 27,900, working 28,232, then 28,406, then 28,542.
Weighting it: no change delivered with a measured tone, producing chop then a fade into earnings de-risking, takes 45 percent. A hawkish outcome breaking the low takes 32. A dovish relief squeeze takes 23, and even that path still has to walk into two mega-cap reports at four o'clock.
One honest caveat about this read. The lower-timeframe chart returned its price legend but failed to draw candles during the evening capture, so the fine intraday micro-structure was not directly readable. What is written above rests on the higher-timeframe chart, on settlement data and on the computed levels, and those three agree. It is worth stating rather than papering over.
What this comes down to is a broken index that would not close on its low, balanced on the last long-horizon average it has, walking into the quarter's most concentrated risk event. The trend says lower. The condition says not yet. Let the market settle the argument before you take a side.
The complete data picture
Every number behind Wednesday’s plan, charted first; the full numeric reference follows underneath.
Full numeric reference , every remaining figure from the review
| September settlement | 27,922.00, down 0.88 percent |
| Cash index | 27,763.13, down 0.98 percent |
| Session low | 27,603.50, also the one-month low |
| Recovery off the low | roughly 318 points into the settlement |
| Pre-dawn futures | down 1.07 percent |
| First-hour divergence | Nasdaq-100 down 1.50 percent against the Dow up 0.68 percent |
| Globex reopen | opened 27,962.00, band 27,955.75 to 28,013.25, last near 27,976 |
| Active four-hour bar | 27,918.75 to 28,013.25, open 27,962.00 |
| Futures basis | approximately 159 points |
| Weekly bar | opened 28,500.00, high 28,763.25, low 27,603.50, down 360.25 points or 1.27 percent |
| Weekly range so far | nearly 1,160 points across two sessions |
| Five sessions | down 4.76 percent |
| Twenty sessions | down 7.09 percent |
| 52-week high | 31,100.00 on June 3, price 10.22 percent below |
| One-month high | 30,599.75 on June 30, a surrender of 2,677 points or 8.75 percent |
| 52-week low | 23,170.50 on March 31, price 20.51 percent above |
| Three-month low | 27,346.50 on April 29, only 575 points away |
| Twelve-month return | 14.24 percent, weighted alpha positive 14.72 |
| 5-day | 28,439.25, price below by 517 |
| 20-day | 29,309.66, price below by 1,388 |
| 50-day | 29,737.84, price below by 1,816 |
| 100-day | 27,996.73, price below by 75 |
| 200-day | 26,967.58, price above by 954 |
| Year-to-date | 27,344.14, price above by 578 |
| Crossover levels | 9-day at 28,633.03, 18-day at 29,177.62, 40-day at 29,660.94 |
| Distances to those crossings | 711, 1,256 and 1,739 points |
| 9-day | raw 14.52 percent, %K 10.04, %D 13.50, relative strength 29.05 |
| 14-day | raw 12.87 percent, %K 9.45, %D 12.58, relative strength 35.54 |
| 20-day | raw 10.63 percent, %K 7.66, %D 10.33, relative strength 40.11 |
| 50-day | raw 9.11 percent, %K 6.49, %D 8.53, relative strength 48.43 |
| 100-day | raw 59.92 percent, %K 62.56, %D 65.91, relative strength 51.54 |
| 14-day reaches 30 at | 27,095.91 |
| 14-day returns to 50 at | 29,215.36 |
| 14-day change on the day | down 2.09 |
| 9-day | index 38.73, positive 7.01, negative 33.02, historic volatility 16.28 percent |
| 14-day | index 26.09, positive 9.88, negative 29.85, historic volatility 18.83 percent |
| 20-day | index 18.87, positive 12.22, negative 27.71, historic volatility 20.07 percent |
| 50-day | index 9.31, positive 17.31, negative 24.73, historic volatility 24.93 percent |
| 100-day | index 7.30, positive 21.31, negative 25.43, historic volatility 22.64 percent |
| Multi-indicator composite | 72 percent sell |
| Trajectory | 8 percent buy a month ago, 40 percent sell last week, 56 percent sell yesterday |
| Short-term group | all six components sell |
| Medium-term group | 50 percent sell |
| Long-term group | 33 percent sell, with the 20-to-100 and 50-to-100 crossovers still buys |
| Average volume, 5-day | 593,738 |
| Average volume, 20-day | 540,837 |
| Average volume, 50-day | 346,244 |
| Open interest | 284,882 contracts |
| Average true range, 9-day | 665.93, or 2.38 percent, daily range 654.36 or 2.34 percent |
| Average true range, 14-day | 676.59, or 2.42 percent, daily range 630.63 or 2.26 percent |
| Average true range, 20-day | 674.68, or 2.42 percent, daily range 650.76 or 2.33 percent |
| Average true range, 50-day | 605.07, or 2.17 percent, daily range 686.81 or 2.46 percent |
| Average true range, 100-day | 504.17, or 1.81 percent, daily range 584.30 or 2.09 percent |
| One-range band around the settlement | 27,245 to 28,599 |
| One average true range centred on the settle | 27,584 to 28,260, against a 630 point daily range |
| September options implied volatility | 24.72 percent with 51 days to expiration |
| Proxy implied / realised, one month | 25.85 / 23.19 percent |
| Proxy implied volatility rank | 74.76 percent |
| Proxy implied move | 11.13 dollars on a 675.49 close, roughly 1.65 percent |
| Beta-adjusted expectation | roughly 1.6 to 1.8 percent, or 450 to 500 points |
| Overnight ceiling | 28,013.25 |
| 100-day average | 27,996.73 |
| First supply shelf | 28,069.59 to 28,098.35, with the retracement at 28,070.93 |
| Put barrier equivalent | 28,159, from 28,000 on the cash index |
| First pivot resistance | 28,232.17, the upper bound of one average daily range |
| Above that | 28,345.78 and 28,406.21 |
| Dealer flip equivalent | 28,338, from 28,179 on the cash index |
| Higher | 28,542.33 second pivot resistance, 28,606.77 second deviation, 28,633.03 crossing |
| Call barrier equivalent | 28,709, from 28,550 on the cash index |
| Wednesday's pivot | 27,917.83 |
| The decisive band | 27,603.50 to 27,635.08, holding the session low, the first pivot support at 27,607.67 and the computed target price |
| Just beneath | 27,557.18 crossover stall, then 27,437.79 first deviation support |
| 13-week low | 27,346.50, set April 29 |
| Defensive band | 27,237.23 to 27,293.33 |
| Deeper | 27,135.25, 27,095.91, 27,083.33, 26,983.17 |
| 200-day average | 26,967.58, anchoring that zone |
| Proxy close | 675.49 against a previous 682.06 |
| Call gamma / put gamma | negative 488.09 million / negative 1.39 billion |
| Estimated gamma notional | negative 838.34 million dollars |
| Proxy structure | put barrier 680, primary concentration 700, flip 701, inflection 705, call concentration 730 |
| Cash-index structure | inflection 28,050, concentration and put barrier 28,000, flip 28,179, call barrier 28,550 |
| Gamma tilt | 0.796 on the cash index, 0.554 on the proxy |
| 25-delta risk reversal | negative 0.074 |
| Cash-index volume | 15,105 puts against 8,900 calls, a ratio of 1.70 |
| Cash-index open interest | 90,163 puts against 83,747 calls |
| Proxy open interest | 6.32 million puts against 4.798 million calls, a ratio of 1.3 |
| Largest gamma expiry | August 20 |
| Key strikes, cash index | 28,000, 27,000, 28,550 and 29,000 |
| Confluence points, cash index | 27,955, 27,142, 28,544 and 28,011 |
| Confluence in futures terms | roughly 28,114 and 28,170 |
| Proxy confluence points | 680.11, 660.27, 680.80 and 694.48 |
| Source timing | desk note published 17:12 ET, positioning snapshot dated July 28 |
| Delta notional | approximately positive 9 billion dollars, strongest single day in thirty |
| Timing | almost entirely between 09:30 and 11:30, driving an 82 basis point rally |
| Composition | roughly 5 billion from same-day put selling, 4 billion from longer-dated call buying |
| Single-stock flow | 1.4 billion concentrated in the largest seven names |
| Supporting position | a 7,000-lot same-day put around the 7,390 strike, partially closed after 14:00 |
| Desk pivot | 7,450 on the broad index, which closed at 7,429.00 |
| Desk resistance / support | 7,500, 7,525, 7,550, 7,600 / 7,400 and 7,300 |
| Desk tactical view | short-dated upside in the Nasdaq proxy toward 705 via call flies, valid only through July 30, now well offside at 675.49 |
| Fast-money accounts | long 46,344, short 121,034, net short 74,690 |
| Weekly change | the short side grew by 9,294 contracts |
| Asset managers | long 104,664, short 32,039, trimming 2,080 longs |
| Dealers | cut 3,050 longs and 8,377 shorts |
| Commercials | added 3,154 shorts |
| Semiconductor index | down 4.49 percent to 11,035.68, sector fund closer to 5 percent |
| Largest single declines | 24.74 percent, then 14.25, 12.10, 8.53, 8.15, 7.82 and 6.91 |
| Memory leaders from last month's highs | roughly 37 percent and 55 percent lower |
| Healthcare and consumer staples | each up roughly 2 percent |
| Broad index | 7,429.00, with equal weight outperforming capitalisation weight |
| Gold | 4,022.0, down 0.41 percent |
| Digital asset benchmark | 63,914.88, up 0.35 percent |
| Crude | up 2.88 percent at 81.54 despite a 3.296 million barrel private build against an expected 2.5 million draw |
| Consumer confidence | 90.8 against a 92.4 forecast and 91.2 prior |
| Case-Shiller 20-city | 1.63 percent year over year against 1.3 percent expected |
| Volatility index / volatility-of-volatility | 18.2 / 98.5 |
| Broad-index implied volatility | 19.25 percent Wednesday, 19.45 percent Thursday, roughly 120 and 122 basis points |
| Dollar index | 101.393, easing 0.12 percent |
| Policy rate | 3.75 percent, consensus unchanged |
| Futures pricing | roughly 68 percent no change against 32 percent a hike |
| Prior meeting | nine of eighteen participants expected an increase during 2026 |
| Seven-year auction | 4.473 percent against 4.260 percent prior, cover 2.490 against 2.500 |
| June core consumer prices | negative 2 basis points |
| Expected translation | roughly 18 basis points on core personal consumption |
| 16:00 | Social-media platform, implied move roughly 7 percent against a four-quarter average realised move nearer 10 percent |
| 16:00 | Mobile-chip designer, following a late-July double-digit percentage price increase |
| 16:05 | Coffee retailer |
| 16:10 | Enterprise software and cloud, implied move roughly 6 percent |
| Also reporting | implied moves of roughly 12 percent, 10 percent and 9 percent across three further names |
| Entry zone | 27,590 to 27,600, on a confirmed 15-minute close beneath 27,603.50 |
| Timing | no entry before 14:45, after the statement and press conference |
| Stop | 27,700 |
| Target 1 | 27,437.79 |
| Target 2 | 27,346.50 |
| Target 3 | 27,293.33 |
| Reward | approximately 1:1.5, 1:2.4 and 1:2.8 from a 27,595 entry |
| Invalidation | a 15-minute close back above 27,700, or failure to sustain beneath 27,603.50 within thirty minutes; structurally, any close above 27,996.73 |
| Macro override | skip on an explicitly dovish surprise, or if the break arrives after 15:30 |
| Conditions | hold above 27,603.50 through the morning, reclaim 27,996.73, then close a 15-minute bar above 28,013.25 after the statement |
| Entry zone | 28,020 to 28,050 |
| Stop | 27,900 |
| Targets | 28,232.17, then 28,406.21, then 28,542.33 |
| Reward | approximately 1:1.5, 1:2.9 and 1:3.9 from a 28,035 entry |
| No change with a measured tone | 45 percent, settling between 27,850 and 28,050 |
| Hawkish outcome and continuation | 32 percent, breaking 27,603.50 toward 27,437.79 and 27,346.50 |
| Dovish relief and squeeze | 23 percent, clearing 28,232.17 toward 28,406.21 |
| Upper extreme | 28,542 |
| High | 28,232 |
| Upper mid | 28,013 to 28,098 |
| Central | 27,900 to 27,996 |
| Lower mid | 27,750 |
| Low | 27,603 to 27,635 |
| Lower extreme | 27,293 to 27,346 |
| Core expectation | 27,603 to 28,232, a span of 629 points |
| Overnight reference band | 27,900 to 28,020 |
| Morning band | 27,750 to 28,100 |
| No edge | price trapped between 27,750 and 27,950 with no acceptance either side |
| Event window | 14:00 to 14:45 |
| Earnings gap risk | any new entry after 15:30 |
| Session rules | before 09:45 or after 16:00 |
| Signal unreliability | semiconductors opening sharply higher while the index opens lower, or the reverse |
| 21:30 Tuesday | Australian consumer price data |
| 04:00 | European wage tracker |
| 04:30 | UK consumer credit, mortgage lending and approvals |
| 07:00 | Consumer staples bellwether results |
| 10:30 | Crude inventories, a 1 million barrel build forecast against 2.010 million prior |
| 13:30 | Bank of Canada minutes |
| 14:00 | Rate statement and decision, 3.75 percent forecast |
| 14:30 | Press conference |
| Thursday 07:00 | Bank of England |
| Thursday 08:30 | Personal consumption prices, advance second-quarter growth and jobless claims |
| Thursday 16:30 | The largest consumer-hardware name |
| Thursday 23:30 | Bank of Japan |
| Friday | The dominant e-commerce and cloud group |
| Issue | the lower-timeframe layout returned price and legend data but did not render candles during the evening capture |
| Consequence | intraday micro-structure was inferred from higher-timeframe and computed level data rather than read directly |
| Agreement | the higher-timeframe chart, the settlement data and the computed level set all point the same way |
Follow-up: the index settled 27,342.00 with every mapped barrier now overhead. Read the Thursday July 30 Nasdaq-100 outlook.



