
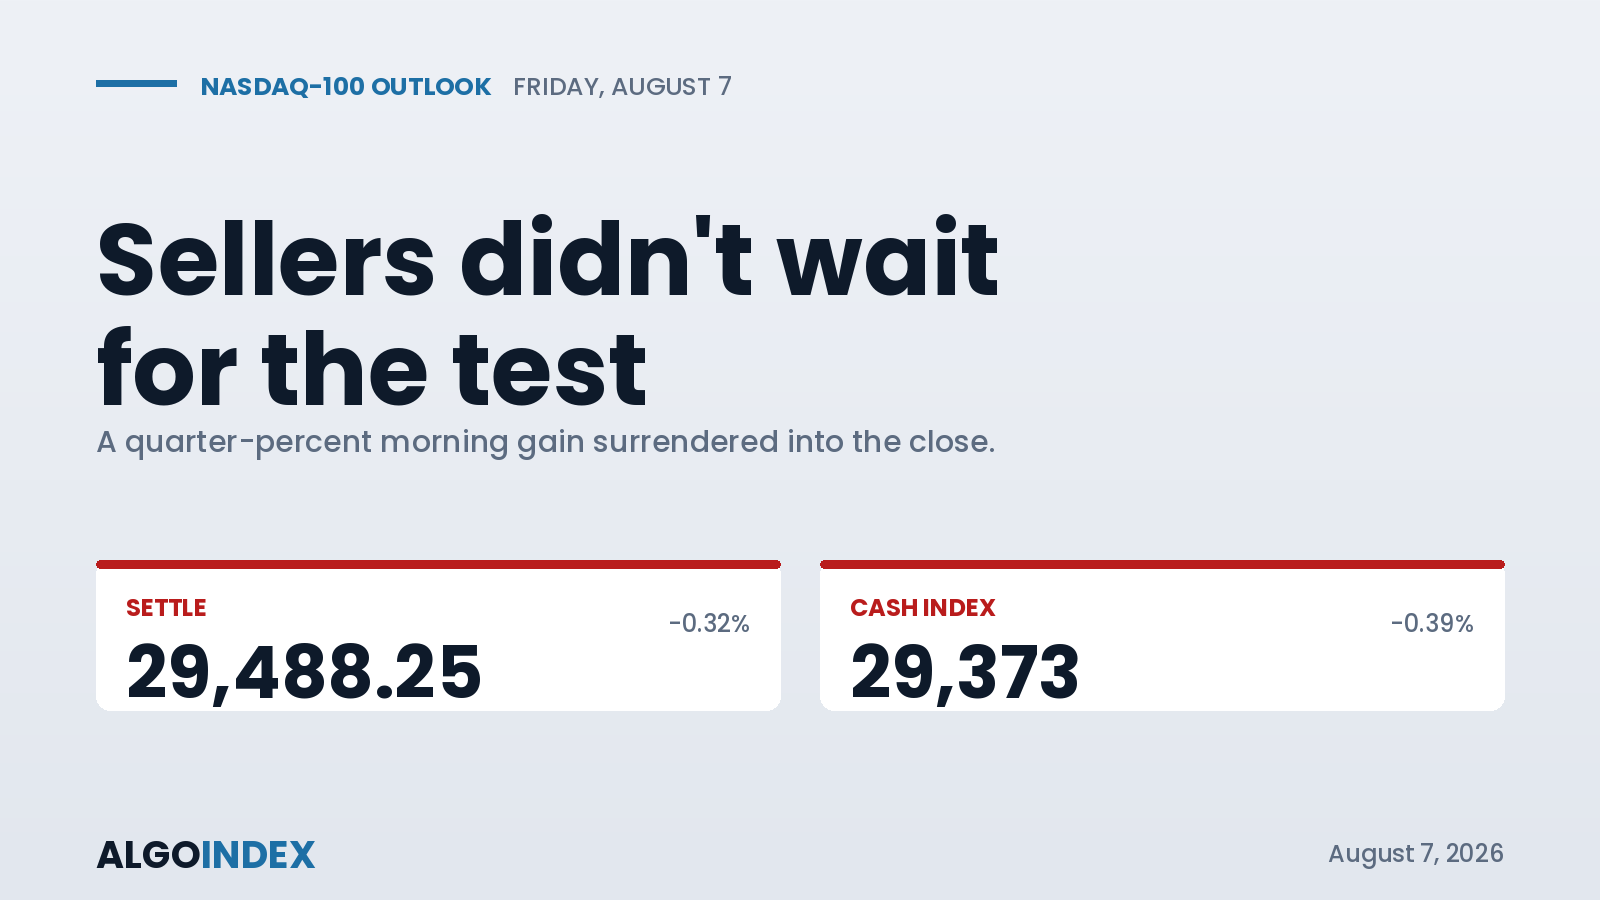
September Nasdaq-100 futures settled 29,488.25 on Thursday, down 0.32 per cent, after being up a quarter per cent by late morning. Supply arrived 95 points beneath the obvious technical magnet. Nobody waited for the test.
That is the tell worth carrying into Friday.
The level nobody bothered to reach
The 50-day average sits at 29,622.01. No other figure on this board carries as much weight, because price has climbed clear of every other average in the stack while that one still caps it. Above the 5-day by 235.70. Above the 20-day by 532.05. Above the 100-day by 1,236.14, above the 200-day by 2,405.92. Below the 50-day by 133.76.
A market in genuine recovery walks up and tests a level like that. Thursday's high came at 29,527.75 and sellers went to work there instead, 95 points short.
Read it as a statement about willingness. Holders of a 4.43 per cent advance built over five sessions weren't prepared to defend it into the obvious round-number test, which says something about how much conviction sits underneath the bounce off the 29 July low at 27,201.50.
What actually did the damage
Not technology. Energy and rates.
The energy story driving this session has its own review: Crude Oil (CL): the Strait reopens, just not for everyone.
The energy story driving this session has its own review: Crude Oil (CL): the Strait reopens, just not for everyone.
Crude ran hard once Iranian strikes on hostile positions inside the Strait were confirmed and the reopening arrangement stayed foggy, carrying Brent past 82 dollars. The inflation impulse that followed added five basis points to the ten-year, taking it to 4.66 per cent, and the dollar firmed with it.
Few combinations hurt an index of this duration more than climbing real rates powered by a supply shock in oil. Debt and equity sold off in tandem, which marks a rates-led decline rather than a growth-led one, and this is where that lands hardest.
Any other day, the morning numbers would have been a help. Claims arrived at 199,000 where 205,000 was expected. Productivity beat hard, 1.4 per cent against a 0.6 forecast. Unit labour costs undershot at 1.3 per cent where 2.1 was penciled in. Output per hour climbing while labour costs ease is about as good as inflation news gets. None of it counted. Oil set the price on Thursday.
Software took the punishment
Semiconductors held. A large lithography equipment maker added 1.56 per cent to finish 1,704.37. A diversified semiconductor name added 0.55 per cent to 420.57, an analog manufacturer 0.24 per cent to 278.40.
The damage sat one layer up the multiple stack. A cloud observability name dropped roughly 18 per cent on a second-quarter gross margin miss. A mobile advertising technology name lost nearly 20 per cent, closing 335.67. A consumer beverage growth story shed 18.46 per cent, closing 23.77. Storage and memory closed 1,258.58 after a 6.81 per cent loss, and a financial software name gave back 1.84 per cent to 321.91.
When two constituents lose something close to a fifth of their value inside one session, the growth cohort feels it regardless of the index shifting less than half a per cent. The gap between how the semiconductor group traded and how the software group traded is the shape of the session in one line.
One mega-cap carries a mechanical overhang worth naming. Three straight sessions of selling have hit a big name in e-commerce and cloud since its largest individual holder filed on 3 August to dispose of 15 million shares, around four billion dollars of stock. Two sessions of negative hedging flow have followed it. The stock turned away from dealer resistance up at 280 and worked near the 270 concentration strike, and the reference under that is 250. When an index heavyweight carries a persistent seller of that size, no news cycle clears it.
The options market called it in advance
Here is the number that explains the whole day.
Delta notional on Nasdaq-specific hedging came to minus 2.5 billion dollars, almost all of it zero-day calls being sold. On the wider index the same measure read plus 5 billion, built from something like seven billion of puts sold against two billion of calls. Individual names were flat.
Puts sold on the wider market, calls sold on this one, in the same session. Positioning says what commentary cannot, and what it said was that the wider index would hold its ground while this one went nowhere.
It stalled. And because both sides were selling premium, implied volatility compressed and intraday movement damped, which is why a day carrying this much headline flow produced an index range of just 58 basis points.
Where the crowd is standing
Skew rank: 99.21 per cent.
Sit with that a second. Go back through everything the series has recorded and upside optionality has scarcely ever been this crowded. A desk note flagged the same thing separately, putting call skew in a 98th percentile right across the big index proxies under a condition where shares and volatility rise together. Open interest in puts against calls runs 1.19, north of parity, which is what you see when a market holds long-dated protection in size and chases short-dated upside with its other hand.
Gamma on the proxy comes back negative on both legs. The call side reads minus 822.55 million, the put side minus 1.43 billion, so the combined book sits near minus 2.25 billion. Amplifying, then, rather than damping. Moves either way should run further than compressed option pricing implies.
Cash at 29,487 already sits over its upper dealer shelf, which is 28,550, and a long way clear of the 28,756 flip. The mechanical corridor that produces a squeeze has been walked through and cashed in. Once you are past the shelf, hedging supplies less and less lift, and reversal risk rises for the simple reason that whatever positioning drove the climb has already been paid out.
Options are cheap into the biggest print of the week
True range over fourteen days measures 715.87 points, 2.43 per cent, where the hundred-day figure is 524.02. Sessions have been about 37 per cent bigger than the quarterly norm. Lay that over the settlement and the statistical boundary runs 28,772 up to 30,204.
The option market disagrees. Implied volatility over one month reads 21.67 per cent where realised reads 26.36, leaving implied 4.69 points cheap. A 1.37 per cent implied daily move on the proxy works out near 403 index points, giving a boundary of 29,085 by 29,891.
Set the two boundaries beside each other. One says Friday's labour print produces an ordinary session; the other says sessions lately have been running 37 per cent above normal. Two things follow. Stops belong on structure, not on a tight leash. And buying upside here means joining the most heavily occupied position in the series while skew sits in its 99th percentile.
Who is holding what
Positioning as of 28 July describes a professional community arranged defensively while the allocator base stays long.
Commercial accounts hold 175,548 short against 160,602 long, leaving 14,946 net short. Non-commercials sit barely net long at 4,914 after putting on 7,468 on one side and 7,100 on the other, which expands gross exposure without expressing a direction. Dealers and intermediaries make the striking entry: 27,581 net short, arrived at by dropping 16,787 longs and adding 5,094 shorts within one week. Call that aggressive de-risking.
Allocators hold the largest net long at 76,759. Fast money holds the largest net short at 58,298, though it put on 14,889 longs and cut 1,503 shorts, genuine covering pressure that goes a long way toward explaining how violent the move off July's low turned out to be.
Pull it together and the advance between 29 July and 6 August looks like fast money buying back stock on top of a steady allocator base, all while dealers were shedding exposure. That kind of rally ends when the shorts run out. There is still fuel with 58,298 contracts outstanding on that side, but roughly 15,000 fresh longs inside a week says the easy stretch of the squeeze has passed. Total open interest: 283,779.
Volatility pricing is the underpriced part
Volatility finished the day on a 15 handle, with its own volatility index at 88. Across strikes, index-level implied fell somewhere between half a point and two points as options were sold heavily, leaving at-the-money August pricing around 10 to 12 per cent. One well-known sentiment reading printed 62 on a hundred-point scale, which puts it in greed territory.
Gold barely twitched, meanwhile. Real geopolitical panic puts it at the front. Sitting it out suggests traders read the Strait as a supply-and-prices problem rather than something systemic, which is why equities declined in an orderly fashion instead of breaking.
Stack the pieces now. Volatility carries a 15 handle, hedges are thin, sentiment reads greed, implied pricing has been squashed flat. A shooting conflict remains unresolved at the planet's most important oil chokepoint. And a weekend is coming. Underpriced tails look exactly like this.
The weekend is the part to think hardest about
Thursday afternoon moved fast. Around 3:24 in the afternoon reports had Iran striking hostile targets in the Strait, with two explosions on Qeshm Island a minute later. Between 4:25 and 4:31 the American president called the waterway sort of open, confirmed personal involvement in the negotiation, said Iran could not go much longer, predicted the conflict would end soon, and described munitions supply as unlimited.
Then a Saudi official spoke, somewhere between 4:40 and 4:44, and said something a good deal more alarming. Riyadh described reports of planned strikes as shocking even as it works toward calming things, called the talks constructive, and in the same breath revealed that drones and missiles have been seen moving in a way that suggests attacks arriving from two directions at once. The sites named as possible targets: civilian and economic, energy infrastructure, ports, airports.
Set that in context. Four days earlier the Treasury Secretary hinted an agreement might land within a day, and Qatar said draft language was written. Come 11:49 Thursday morning, reporting still had American and Israeli hulls excluded under those same terms, so the draft restores nothing resembling free navigation. Back on 31 July, a report described Washington and Israel readying strikes on energy-related sites inside Iran.
Holding length across a weekend in which a friendly government has said publicly that coordinated strikes on energy infrastructure may be coming should cost something, and Friday afternoon has yet to charge for it. Late-day strength is therefore to be sold, not bought.
What Friday hinges on
Average hourly earnings. Not the headline payroll count.
The 29 July vote landed nine to three, the trio arguing for a rise rather than a hold. Pricing has since shifted from a hike by October to a hike by December, fully discounted. Put three hawkish dissenters in front of an inflation impulse coming out of the oil market and their tolerance for a hot wage figure is close to nil.
Which flips the usual framing on its head. Softer labour data is what this index needs. Cool wages push the hike further out, drag yields lower and take the duration pressure off. Wages at 0.4 per cent or hotter drag the hike nearer, send yields through 4.70 per cent and hurt the index whatever the payroll count says. Consensus: 80,000 headline where the prior was 57,000, private the same 80,000 where the prior was 49,000, joblessness holding 4.2 per cent, wages 0.3 per cent on the month and 3.5 on the year.
A second-tier item deserves better billing than usual. Twelve-month inflation expectations land at 11:00, forecast 3.65 per cent where the prior read 3.67. When everyone is asking whether oil has begun to leak into what households expect, anything above 3.70 reads hawkish on its own terms.
The trade
Sell into the supply band. Four separate references occupy the 127 points from 29,610 to 29,740: a 38.2 per cent retracement of the quarterly decline right at the bottom edge, the 50-day a fraction above it at 29,622.01, first computed resistance sitting at 29,702.58, then the mechanical target price closing things out at 29,737.83.
Wait for an obvious rejection somewhere around 29,650 to 29,700 rather than taking the lower edge on first contact, and make sure it is rejection and not absorption. Risk goes to 29,805, which clears the 18-day stall marker at 29,790.25. Book at 29,471.92, then 29,257.58, then 29,150.75, which from a 29,660 fill pays about 1.3, 2.8 and 3.5 to one.
Nothing before 9:45. Because the release comes sixty minutes ahead of the cash bell, the opening print already embodies a first reading of the data, and that makes the opening range unusually useful: it is the second reading.
There is a long on the other side of it. Should a fifteen-minute bar close over 29,805, the 50-day has flipped from a ceiling into a base and the retracement idea is finished. Buy that close between 29,805 and 29,830, or buy a hold on the retest at 29,740 through 29,790, risking to 29,700, working toward the 29,917 by 29,927 band and then July's high at 30,077.75.
Skip it entirely if the print gaps the contract outside the statistical boundary, if the opening range comes in under 90 points wide, if price opens inside the supply band having never traded beneath it, or if the first half hour takes out both the 40-day crossover and the pivot just above it, being 29,451.75 and 29,471.92. That last case means the downside path is already under way and no rally will come along to sell.
What we are watching
Base case: payrolls land around consensus and the first read nudges the index up. Morning then walks price into the supply band. The test there fails on obvious rejection. Afternoon hands the advance back as weekend hedges go on, and the week finishes at the pivot or under it.
Weight them 40 per cent for in-line, 32 for a soft print that opens the door to duration relief, 28 for a hot one that takes the 40-day crossover straight out. Two of the three point the same way, toward selling the rally, and that is why the position leans against it, with risk placed over the 18-day stall marker instead of inside the band.
None of this cracks the spending story underneath, and that matters. Accelerator supply reads tight rather than slack. A leading designer is said to be weighing a move on scarce high-bandwidth memory while running several versions of its next part. An electric vehicle and space group put its combined compute requirement above a terawatt. A Chinese model developer restarted fundraising, asking eight billion on a 74 billion valuation. Thursday was a rates and energy session, not a verdict on the theme.
Which cuts both ways. It means a friendly wage print might set off a real relief rally instead of a purely technical bounce. It also means the crowd already owns that outcome at a 99th-percentile skew.The complete data picture
Every number behind Friday’s plan, charted first; the full numeric reference follows underneath.
Full numeric reference , every remaining figure from the review
Full data reference
Every figure behind the analysis above. September Nasdaq-100 futures, contract NQU26, session of Thursday 6 August 2026, prepared for Friday 7 August. Index points unless marked otherwise.
| Reference | Value |
|---|---|
| Settlement | 29,488.25, down 0.32 per cent |
| Cash index close | 29,373.33, down 0.39 per cent |
| Basis | 114.92 points of positive carry, 43 days to the 18 September expiry |
| Session high | 29,527.75 |
| Session low | 29,494.50 |
| Late-morning cash gain | approximately 0.26 per cent, surrendered in full |
| Index range on the session | 58 basis points |
| Broad index | the S&P 500 down 0.18 per cent |
| Dow | down 0.85 per cent |
| Five-session advance into Thursday | 1,250.50 points or 4.43 per cent off the 29 July low |
| Reference | Value |
|---|---|
| Globex reopen | 18:00 Eastern |
| Quoted band | approximately 29,508 to 29,575 |
| Volume on the initial read | 401 contracts |
| Open interest | 283,779 |
| Four-hour evening bar | open 29,514.25, high 29,548.75, low 29,494.50, last 29,543.50, a 54.25-point envelope |
| Fifteen-minute bar | open 29,514.25, high 29,550.00, low 29,494.50, last 29,549.50 |
| Five-minute bar | open 29,549.75, high 29,549.75, low 29,541.00, last 29,549.50, an 8.75-point range |
| Reference | Value |
|---|---|
| 52-week high | 31,100.00, set 3 June; price 5.18 per cent below |
| 52-week low | 23,170.50, set 31 March; price 27.27 per cent above |
| Position in the annual range | approximately the 80th percentile |
| One-month high | 30,077.75, set 10 July |
| One-month low | 27,201.50, set 29 July |
| Position in the one-month range | approximately 79.5 per cent |
| 13-week range | 27,201.50 to 31,100.00; price at the 58.7 per cent mark |
| One-month change | down 452.75 points or 1.51 per cent from the 6 July period open of 29,941.00 |
| Three-month change | up 514.00 points or 1.77 per cent |
| 52-week change | up 5,126.50 points or 21.04 per cent |
| Relative strength | 53.70, down 1.25 on the session |
| Weighted alpha | plus 20.56 |
| Reference | Value |
|---|---|
| 5-day | 29,252.55, settlement above by 235.70 |
| 20-day | 28,956.20, settlement above by 532.05 |
| 50-day | 29,622.01, settlement below by 133.76 |
| 100-day | 28,252.11, settlement above by 1,236.14 |
| 200-day | 27,082.33, settlement above by 2,405.92 |
| Year-to-date | 27,413.70, settlement above by 2,074.55 |
| Where price crosses the 40-day | 29,451.75, only 36.50 beneath the settlement |
| Where the 18-day stalls | 29,790.25 |
| Positive arrangements | 20-day against 100-day, 50-day against 100-day |
| Negative arrangements | 20-day against 50-day, 50-day against price |
| Reference | Value |
|---|---|
| 9-day | raw 79.61, %K 86.75, %D 83.45, strength 57.49 |
| 14-day | raw 79.61, %K 86.75, %D 77.52, strength 53.70 |
| 20-day | raw 79.50, %K 85.32, %D 76.01, strength 52.34 |
| 50-day | raw 58.66, %K 62.95, %D 56.10, strength 52.99 |
| 100-day | raw 79.67, %K 81.78, %D 78.42, strength 53.91 |
| Reference | Value |
|---|---|
| 9-day | index 32.43, positive 24.24, negative 20.98, historic volatility 28.22 per cent |
| 14-day | index 24.19, positive 21.02, negative 22.25, historic volatility 26.56 per cent |
| 20-day | index 19.01, positive 19.80, negative 22.61, historic volatility 24.94 per cent |
| 50-day | index 9.57, positive 20.13, negative 22.67, historic volatility 27.06 per cent |
| 100-day | index 7.20, positive 22.63, negative 24.08, historic volatility 23.70 per cent |
| Reference | Value |
|---|---|
| 9-day | true range 717.72 or 2.43 per cent, daily range 783.08 or 2.66 per cent |
| 14-day | true range 715.87 or 2.43 per cent, daily range 711.29 or 2.41 per cent |
| 20-day | true range 706.98 or 2.40 per cent, daily range 691.46 or 2.34 per cent |
| 50-day | true range 629.82 or 2.14 per cent, daily range 728.79 or 2.47 per cent |
| 100-day | true range 524.02 or 1.78 per cent, daily range 607.10 or 2.06 per cent |
| Statistical envelope | 28,772 to 30,204 |
| Options-implied envelope | 29,085 to 29,891 |
| Proxy implied one-day move | 9.81 dollars on a 717.22 close, 1.37 per cent, roughly 403 index points |
| Desk-computed index one-day move | 0.66 per cent |
| Reference | Value |
|---|---|
| Overall | 40 per cent buy, strength average, direction weakest on the scale |
| Short-term group | 40 per cent buy |
| Medium-term group | 25 per cent buy |
| Long-term group | 67 per cent buy |
| Trend signal | neutral |
| Channel indices | 40-day and 60-day both neutral |
| Reference | Value |
|---|---|
| 29,527.75 | Thursday's session high |
| 29,610.77 | 38.2 per cent retracement of the decline from the 13-week high |
| 29,622.01 | 50-day moving average, the pivotal number for Friday |
| 29,702.58 | 1st computed resistance |
| 29,737.83 | the computed target price |
| 29,790.25 | where the 18-day average stalls, the upper boundary of the supply band |
| 29,916.92 | 2nd computed resistance |
| 29,927 | 1st translated upside grouping, from 29,812 cash |
| 30,077.75 | the one-month high |
| 30,081.96 | one deviation of resistance |
| 30,134 | 2nd translated upside grouping, from 30,019 cash |
| 30,147.58 | 3rd computed resistance |
| 30,340 | 3rd translated upside grouping, from 30,225 cash |
| 31,100.00 | the 52-week high |
| Reference | Value |
|---|---|
| 29,499.50 | 14 by 3 raw stochastic at 80 per cent |
| 29,494.50 | Thursday's session low |
| 29,488.25 | Thursday's settlement |
| 29,471.92 | the computed pivot |
| 29,451.75 | where price crosses the 40-day average |
| 29,257.58 | 1st computed support, the primary downside objective |
| 29,212.25 | 14 by 3 raw stochastic at 70 per cent |
| 29,150.75 | 50 per cent retracement of the 13-week range |
| 29,105.71 | where 14-day strength returns to 50 |
| 29,026.92 | 2nd computed support |
| 28,979.02 | 38.2 per cent retracement from the four-week high |
| 28,894.54 | one deviation of support |
| 28,813.28 | where price crosses the 18-day average |
| 28,812.58 | 3rd computed support |
| 28,756 | the cash dealer gamma flip level |
| 28,720.56 | where price crosses the 9-day average |
| 28,659 | translated downside grouping, from 28,544 cash |
| 28,648.62 | two deviations of support |
| 28,550 | the upper dealer shelf |
| 28,540 | the cash volatility inflection level |
| 28,459.91 | three deviations of support |
| 27,201.50 | the one-month and 13-week low |
| Reference | Value |
|---|---|
| Reference price | 29,487 |
| Primary gamma concentration strike | 29,000 |
| Upper dealer resistance shelf | 28,550 |
| Lower dealer support shelf | 28,000 |
| Dealer gamma flip level | 28,756 |
| Volatility inflection level | 28,540 |
| Gamma tilt | 1.603, the highest of any major index tracked |
| Dealer gamma notional | 11.161 million dollars |
| 25-delta risk reversal | minus 0.035 |
| Call volume against put volume | 11,811 against 10,310 |
| Call open interest against put open interest | 86,391 against 100,172 |
| Key upside strike groupings | 29,812, 30,019, 30,225 |
| Key downside strike grouping | 28,544 |
| Reference | Value |
|---|---|
| Previous close | 717.22, with after-hours trade at 714.78, down 0.34 per cent |
| Upper dealer resistance shelf | 730 |
| Lower dealer support shelf | 660 |
| Dealer gamma flip level | 710 |
| Volatility inflection level | 719 |
| Primary gamma concentration strike | 700 |
| Gamma tilt | 1.202 |
| Dealer gamma notional | 231.956 million dollars |
| 25-delta risk reversal | minus 0.019 |
| Key strike references | 700, 710, 720, 730 |
| Upside groupings | 725.13, 730.19, 735.26, 740.32 |
| Put-to-call open interest ratio | 1.19 |
| Estimated high volatility point | 726 |
| Next-expiration gamma | 12.25 per cent |
| Reference | Value |
|---|---|
| Call gamma | minus 822.55 million |
| Put gamma | minus 1.43 billion |
| Combined net gamma | approximately minus 2.25 billion, an amplifying condition |
| One-month implied volatility | 21.67 per cent |
| One-month realised volatility | 26.36 per cent |
| Implied against realised | implied 4.69 points below realised |
| Implied volatility rank | 46.44 per cent |
| Variance-model rank | 79.02 per cent |
| Skew rank | 99.21 per cent |
| September futures options | 21.67 per cent implied with 42 days to expiration |
| At-the-money August implied | approximately 10 to 12 per cent |
| Volatility index close | 15 |
| Volatility-of-volatility index close | 88 |
| Sentiment gauge | 62 out of 100, greed zone, as of 10:21 |
| Reference | Value |
|---|---|
| Nasdaq-specific | minus 2.5 billion dollars of delta notional, dominated by zero-day call selling |
| Broad index | plus 5 billion dollars, roughly 7 billion of put selling against 2 billion of call selling |
| Single stocks | relatively flat, muted in either direction |
| Index-level implied volatility change | down roughly 0.5 to 2 points across strikes |
| Reference | Value |
|---|---|
| Index resistance | 7,800 |
| Index pivot | 7,680, raised 5 August, bearish beneath and bullish above |
| Index support | 7,700, 7,675, 7,600 |
| Index close | 7,710, holding 30 handles above the pivot |
| Market-maker support | an approximately 9,000-lot short put position at the 7,700 strike |
| Implied high and low | 7,775.93 and 7,673.97 |
| Five-day implied move | 1.56 per cent |
| Desk posture | flatten some long exposure, enter cheap short-dated downside, hedge with one-month-and-longer put spreads |
| One-month correlation | returned to the sub-8 threshold on 3 August |
| Reference | Value |
|---|---|
| Commercials | 160,602 long against 175,548 short, net short 14,946; longs down 3,697, shorts down 762 |
| Non-commercials | 81,531 long against 76,617 short, net long 4,914; added 7,468 longs and 7,100 shorts |
| Dealers and intermediaries | 54,481 long against 82,062 short, net short 27,581; cut 16,787 longs, added 5,094 shorts |
| Asset managers | 106,927 long against 30,168 short, net long 76,759; added 2,263 longs, cut 1,871 shorts |
| Fast-money funds | 61,233 long against 119,531 short, net short 58,298; added 14,889 longs, cut 1,503 shorts |
| Other reportables | 10,354 long against 11,266 short |
| Reference | Value |
|---|---|
| Lithography equipment maker | 1,704.37, up 1.56 per cent |
| Diversified semiconductor name | 420.57, up 0.55 per cent |
| Analog manufacturer | 278.40, up 0.24 per cent |
| Cloud observability name | down roughly 18 per cent on a second-quarter gross margin miss |
| Mobile advertising technology name | 335.67, down 19.66 per cent on a revenue miss |
| Consumer beverage growth name | 23.77, down 18.46 per cent |
| Memory and storage name | 1,258.58, down 6.81 per cent |
| Financial software name | 321.91, down 1.84 per cent |
| E-commerce and cloud overhang | a 3 August filing to sell 15 million shares, roughly 4 billion dollars; dealer resistance 280, concentration strike 270, next reference 250 |
| Reference | Value |
|---|---|
| Brent crude | above 82 dollars |
| West Texas Intermediate | approximately 78.09, up roughly 1.04 per cent |
| Ten-year yield | 4.66 per cent, up 5 basis points |
| Integrated energy producer | 189.23, up 1.51 per cent |
| Oilfield services name | 51.54, up 3.27 per cent |
| Exploration and production name | 56.04, up 4.14 per cent |
| Airline names | 50.69 down 2.61 per cent, and 129.12 down 2.74 per cent |
| Precious metals | little changed |
| Reference | Value |
|---|---|
| Entry zone | 29,610 to 29,740, preferred on visible rejection at 29,650 to 29,700 |
| Stop | 29,805, above the 18-day stall reference at 29,790.25 |
| Risk from a 29,660 initiation | 145 points |
| Target 1 | 29,471.92, 188 points |
| Target 2 | 29,257.58, 402 points |
| Target 3 | 29,150.75, 509 points |
| Reward ratios | approximately 1 to 1.3, 1 to 2.8, 1 to 3.5 |
| Invalidation | a fifteen-minute close above 29,805, or a wage print at 0.2 per cent or below driving the ten-year beneath 4.60 per cent |
| Reference | Value |
|---|---|
| Trigger | a fifteen-minute close above 29,805 |
| Entry zone | 29,805 to 29,830 on the close, or a retest of 29,740 to 29,790 held as support |
| Stop | 29,700 |
| Target 1 | 29,916.92 |
| Target 2 | 29,927, forming a single objective band with Target 1 |
| Target 3 | 30,077.75, with one deviation of resistance at 30,081.96 forming a ceiling 4.21 above |
| Reward ratios from a 29,815 initiation | approximately 1 to 2.1 and 1 to 2.6 |
| Reference | Value |
|---|---|
| Path A, in-line print | 40 per cent. Payrolls 60,000 to 100,000 with wages at 0.3 per cent. Drift into the supply band, failure at the 50-day, afternoon fade to 29,471.92 and possibly 29,350. |
| Path B, soft print | 32 per cent. Payrolls beneath 60,000 or wages at 0.2 per cent or lower. Ten-year retreats below 4.60 per cent, the 50-day is reclaimed, opening 29,702.58, then 29,790.25 and 29,916.92, stretch objective 30,020. |
| Path C, hot print | 28 per cent. Payrolls above 110,000 or wages at 0.4 per cent or higher. Yields extend beyond 4.70 per cent, the 40-day crossover breaks, first support then the 29,150.75 base, extension objective 29,026.92. |
| Low band | 29,080 to 29,260 |
| Mid band | 29,350 to 29,700 |
| High band | 29,800 to 30,080 |
| Reference | Value |
|---|---|
| Gap | the contract gaps outside 28,772 to 30,204 on the print |
| Compressed open | the opening range spans less than 90 points |
| Opened inside | price opens inside 29,610 to 29,740 without first trading beneath it |
| Confirmed strike | any confirmed report of a military strike on Strait shipping or Iranian energy infrastructure during regular hours |
| Immediate break | both 29,451.75 and 29,471.92 lost within the first thirty minutes |
| Standing rules | no entries before 09:45, none after 16:00, no positions held over the weekend |
| Reference | Value |
|---|---|
| 02:00 | German industrial production monthly, forecast 0.2 per cent, prior 0.9 per cent |
| 02:00 | German industrial production annual, forecast 0.1 per cent, prior 0.11 per cent |
| 02:00 | German exports monthly, forecast 0.5 per cent, prior 0.9 per cent |
| 02:00 | German imports monthly, forecast 2.0 per cent, prior minus 2.5 per cent |
| 02:00 | German trade balance, forecast 17.2 billion, prior 19.1 billion |
| 08:30 | Nonfarm payrolls, forecast 80,000, prior 57,000 |
| 08:30 | Private payrolls, forecast 80,000, prior 49,000 |
| 08:30 | Unemployment rate, forecast 4.2 per cent, prior 4.2 per cent |
| 08:30 | Average hourly earnings monthly, forecast 0.3 per cent, prior 0.3 per cent |
| 08:30 | Average hourly earnings annual, forecast 3.5 per cent, prior 3.5 per cent |
| 08:30 | Average workweek, forecast 34.3, prior 34.3 |
| 08:30 | Canadian employment change, forecast 20,000, prior 18,200 |
| 08:30 | Canadian unemployment rate, forecast 6.5 per cent, prior 6.5 per cent |
| 10:00 | A Federal Reserve official speaks |
| 10:00 | Canadian purchasing index, prior 56.2 |
| 11:00 | One-year inflation expectations, forecast 3.65 per cent, prior 3.67 per cent |
| 15:00 | Consumer credit, forecast 12 billion, prior minus 0.18 billion |
| Reference | Value |
|---|---|
| Initial claims | 199,000 against a 205,000 forecast and a 197,000 prior |
| Continued claims | 1.801 million against a 1.789 million forecast |
| Preliminary productivity | 1.4 per cent against a 0.6 per cent forecast and a 0.3 per cent prior |
| Preliminary unit labour costs | 1.3 per cent against a 2.1 per cent forecast and a 1.8 per cent prior |
| July policy vote | nine to three to hold, with three dissents for a 25 basis point increase |
| Overnight risk | a Federal Reserve official speaks Thursday at 17:30 |
| 11 August | a server and infrastructure name at 16:05, consensus 0.69 dollars on 11.62 billion of revenue |
| 12 August | a networking equipment name at 16:05, consensus 1.17 dollars on 16.83 billion; consumer price index the same day |
| 21 August | the monthly expiration |
| Reference | Value |
|---|---|
| Accelerator designer | weighing a significant move on advanced high-bandwidth memory scarcity, testing at least three variants of its next-generation part |
| Search and cloud parent | approximately 115 billion dollars of demand for a jumbo bond sale, a cloud agreement worth upwards of 100 million dollars, and the departure of its chief scientist |
| Software and cloud provider | opened a fourth data centre region in India |
| Electric vehicle and space complex | projected combined chip demand exceeding one terawatt of computing power |
| Chinese model developer | resumed fundraising, seeking 8 billion dollars at a 74 billion dollar valuation |
| Polysilicon | an executive order signed Thursday at 16:13; tariff collection may be delayed 90 to 120 days |
| Mobile chipset supplier | informed customers of double-digit percentage price increases in late July |
| Reference | Value |
|---|---|
| Session compression | the session high, session low, settlement and pivot fell inside a 56-point envelope; the high and low alone bracket 33.25 points |
| The corridor between averages | 340 points, running from the 40-day crossover beneath to the 18-day stall above |
| Where supply arrived | 95 points below the 50-day, which was never tested |
| Gamma flip buffer | the flip at 28,756 cash, roughly 28,871 in futures terms, sits 617 points beneath spot |
| Proxy knife-edge | 717.22 sits above the 710 flip but below the 719 volatility inflection, a 9-point corridor where hedging is least determinate; above 719 opens the 725 to 730 grouping |
| Expected opening range | 150 to 300 points on the print, against a 90-point minimum for the setup to be actionable |
| Overnight base expectation | a quiet drift inside 29,420 to 29,620 into the 08:30 release |
| Momentum threshold | %K above 85 across the 9, 14 and 20-day windows, upper decile without reaching conventional exhaustion |
| Directional threshold | the 9-day index at 32.43 sits above the 25 mark that denotes a genuine trending condition |
| Paths A and C combined | 68 per cent of the distribution, both consistent with selling the rally |
| Supply band width | the 29,600 to 29,800 grouping, with four references inside 127 points from 29,610.77 |
| Downside objective band | 29,150 area, being the 50 per cent retracement at 29,150.75, rather than a disorderly flush |
| Gap on a favourable open | a confirmed reopening with free navigation could gap the contract toward 29,620 to 29,700 |
| The 50-day, restated | 29,622.01, or 29,622 rounded, the pivotal number for Friday |
| Distance to the one-month low | the recovery has retraced the great majority of the July breakdown from 27,201.50 without reclaiming 30,077.75 |



