
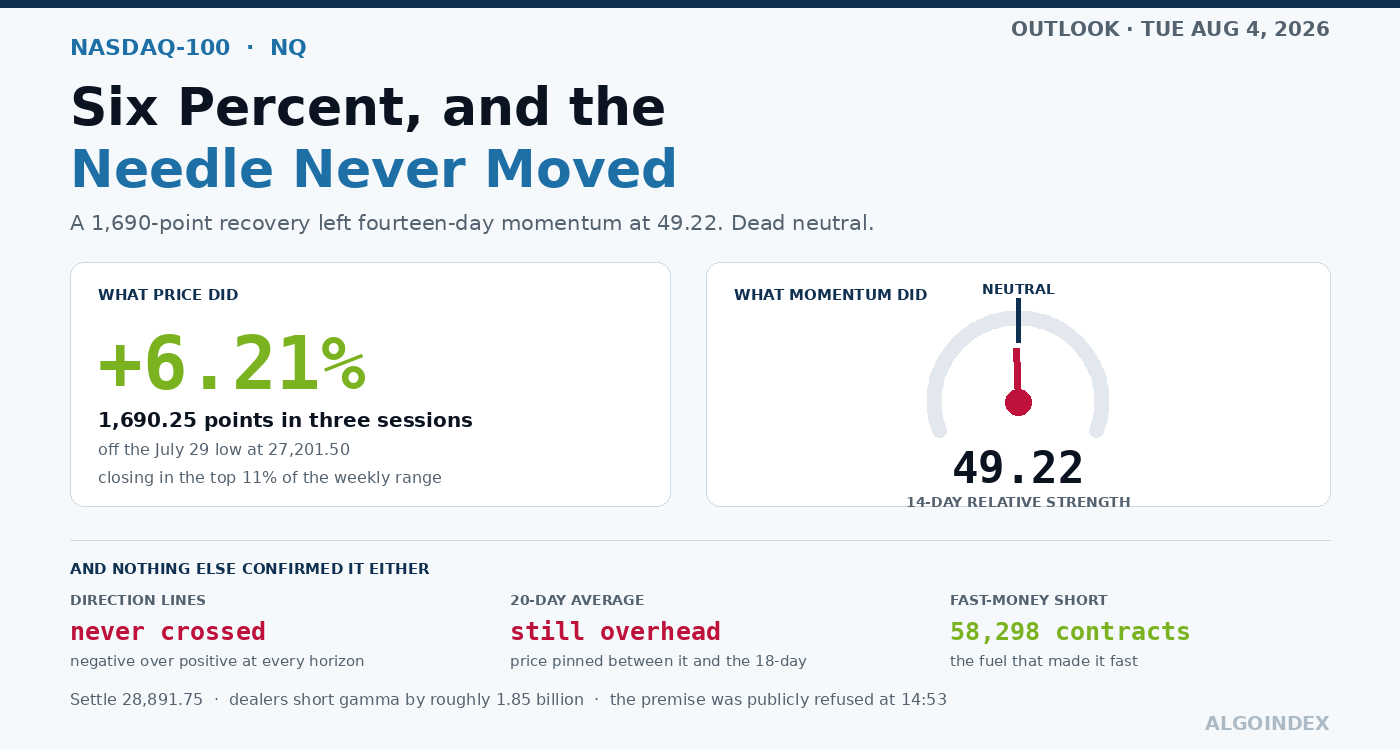
Three sessions took the Nasdaq-100 contract up 1,690 points off its monthly low, a 6.21 percent recovery, and Monday alone added 487.50. Fourteen-day relative strength came out of all that at 49.22. Dead neutral. A move that size which leaves momentum exactly where it started has restored balance rather than built any.
Closing on the highs, and the shape of it
September finished 28,891.75, up roughly 1.72 percent from Friday, with cash closing 1.78 percent higher at 28,776.80. Settlement landed inside the top eleven percent of a weekly range that has run from 28,313.50 up to 28,964.25. Judged on price behaviour alone, few sessions this summer have been this decisive.
The week had opened badly. Trading started 28,565.00 on Sunday evening and got sold straight into 28,313.50, at which point demand arrived. Weight that low more heavily than an ordinary overnight extreme, because a deviation support projection sits at 28,315.79, essentially on top of it. Europe's morning brought steady buying, New York's open brought acceleration, and the high came in at 28,964.25 before a small ease into the bell.
Across the week so far that range measures 650.75 points. Finishing at 88.9 percent of it describes a day that closed on its highs instead of giving anything back.
Evening trade has been narrow and unremarkable. Globex reopened 28,930.00 and has stayed inside 31 points on 574 contracts, which is no volume at all. Read nothing into that quote except that the settle is getting defended rather than faded straight away. Open interest: 288,821.
One driver, and the counterparty rejected it
The cause was singular and identifiable. De-escalation signals concerning the Strait sent crude down hard, and the inflation impulse weighing on the front end went with it. Yields at ten years shed five basis points, reaching 4.68 percent. Cheaper energy plus lower yields did the rest.
Domestic data cooperated underneath it. Manufacturing for July came in at 55.6 where consensus wanted 53.9 and the prior read 53.3, the quickest expansion anyone has seen in four years. Employment inside it recovered, 49.7 becoming 52.8. Prices paid eased, 73.0 becoming 71.1. Construction spending was the one soft spot. Mega-cap technology led decisively, several of the largest constituents adding between three and five percent, one of them crossing three trillion dollars in market value.
Now the part that should govern Tuesday, because here the order of events beats any summary of them.
Through the early afternoon, American executive commentary was constructive and it was what the market bought. Statements in the 14:02 to 14:24 window described phase one of discussions as the Strait reopening, conceivably by the next day, denuclearisation as phase two, and nothing constraining the timetable. Crude fell. Yields followed. Equities rallied.
Starting 14:53, senior Iranian military leadership replied in public, and the reply was a flat refusal. Only the Iranian corridor would be permitted. A second one was absolutely out. And at 15:11 came the line about targeting any warship or military force brought there to that end.
By 14:53 the advance was substantially finished. So 28,891.75 is a settlement that prices the de-escalation premise and not its refusal. Nothing else going into Tuesday is as asymmetric as that.
Context makes it worse rather than better. The last day of July brought reporting that American and Israeli forces were readying strikes on energy targets inside Iran. Nine days earlier, standing commentary had set out that infrastructure would be hit in reply to any Iranian attack on Strait shipping. A consortium running a pipeline has weighed stopping oil and tanker operations open-endedly until safety guarantees arrive. Monday bought a negotiating position. Nobody has settled anything.
Nothing has confirmed the move
Start with the measure that matters most and it argues for caution. At every horizon in the set, nine days through a hundred, negative direction beats positive, without one exception. Strength on the nine-day setting reads 40.42, which marks the prevailing trend as a strong one. Together those say the measured trend still points down and Monday failed to turn it. No crossover has happened.
Until they do, participating on the upside means running counter to the direction the indicators actually name. Position sizing should say so.
The composite splits the same way. It reads 8 percent to the sell side, strength good, direction weakening, which is how a bearish signal looks while a rally erodes it. By horizon: 60 percent sell on the short components, 25 percent buy in the middle, 67 percent buy at the long end. Of thirteen studies, six negative and five positive.
Momentum contributes the same ambiguity. The fourteen-day reading at 49.22 is the midpoint, and the nine, twenty, fifty and hundred-day readings all sit within a few points of it. Fast stochastic lines have turned up off depressed levels while the slow lines lag well behind. A turn in progress, unconfirmed.
The average stack tells the most actionable part of the story. Short averages have been reclaimed and the long ones sit comfortably beneath, but settlement landed pinned between an 18-day immediately under and a 20-day immediately over, the pair only 114.93 points apart. First genuine decision line is that 20-day, and it is directly above. Neither of the intermediate averages, both hundreds of points higher, has been touched.
Which sets the honest characterisation. Since the monthly low, swings have made higher lows and higher highs cleanly, with the rising channel intact and the weekly low as the operative higher low that must hold. Yet July's swing highs go unchallenged and both intermediate averages stay overhead. Call it what it is. Rally recovering inside a structure still broken at the intermediate degree, not an uptrend resumed, and it stays that description until one of those averages closes back under price.
Short gamma, and a short base underneath
Of everything that is not price, dealer positioning matters most for Tuesday, and this configuration is unusual. In the proxy, call-side gamma reads negative 443.2 million and put-side negative 1.41 billion. Both sides negative, roughly negative 1.85 billion in total, with tilt at 0.843.
Dealers short gamma in that size have hedging flows that amplify movement whichever way it goes. Advancing, it accelerates. Reversing, an orderly pullback turns disorderly. It is also the reason Tuesday's expected range deserves treating as wider than what options imply.
Monday's own mechanics illustrate it. Morning gamma sat positive on the back of 15,000 lots of a customer short position in broad-index same-day calls at the 7,590 strike, and it damped movement. Noon closed that out; about 8,000 lots of the same structure at 7,610 took over. Around 14:00 the second one closed too, the heatmap moved from damping to amplifying, and gamma went negative. So the last two hours of the rally ran with dealers set up to amplify instead of absorb, which is where the closing velocity came from.
Hedging flow registered positive 14 billion dollars, the largest in thirty days, and its makeup beats its headline. Around ten billion came from selling longer-dated puts and four billion from buying longer-dated calls. Selling puts at that scale expresses reduced downside concern deliberately, and it counts as a real positive. Another 5.3 billion of bullish single-name activity arrived on top, about half landing in the biggest technology constituents, and predominantly through longer-dated calls rather than same-day speculation.
Then the positioning file, which predates both the low and the recovery. Asset managers carry 76,759 contracts net long and grew it, and that is where the stable institutional bid sits. Fast-money funds carry 58,298 net short, and although 14,889 longs went on during the reporting week, only 1,503 shorts came off. Walk a short base that size into an advance of 1,690 points and it becomes combustible, so a share of Monday's velocity was plausibly mechanical rather than fundamental. Dealers made the report's most bearish adjustment, dropping 16,787 longs and adding 5,094 shorts, and they have since been run over.
Advances built on squeezes arrive fast and then run out of follow-through when the covering ends, which fits momentum sitting where it does.
Where Tuesday gets decided
Density overhead is what defines this map. Inside a 47-point band sit five separate references: the Globex high, the 20-day average, Monday's high, where fourteen-day momentum comes back to neutral, and a four-week retracement. Settlement came 52 points under its lower edge. Any extension requires clearing it decisively, and failing it is where a fade most likely starts.
Above the band, first pivot resistance comes next, reinforced eighteen points higher by a 13-week midpoint retracement, and those two form the first real upside objective.
The interesting confluence sits higher again. Translate the proxy's call-side gamma concentration into futures terms and it lands two points from the computed target projection. When unrelated methods agree that tightly, respect the result as a magnet and as somewhere to reduce.
Higher again, second pivot resistance, the 40-day average, a deviation projection, a 13-week retracement and the 50-day stack through the zone where a recovery would have to prove itself before the intermediate description changes. Nothing about the one-month high matters across a single session.
Below, the settle itself is first support, with the Globex low the nearest intraday marker and the 18-day average providing the first real defensive line 59 points down.
The primary shelf sits lower, and no demand zone on this map is higher quality: the daily pivot, a 13-week retracement, a four-week midpoint and the price tied to a neutral raw stochastic. Four references inside 91 points, and the natural spot for a controlled long.
Under it, two independent methods converge again where first pivot support meets the dealer gamma flip level translated from the proxy. Accept underneath there and the recovery thesis has genuinely failed, rather than merely pulled back.
Lower still sits this map's strongest structural reference, gathering the weekly low, a deviation support projection and the proxy's volatility inflection level inside nineteen points. Unwind the geopolitical premise and stabilisation should first be attempted there. Deeper run the 9-day average, a pair of deviation and pivot projections, a 61.8 percent retracement and third pivot support, all the way to a base where the monthly and quarterly low meets the put-side gamma concentration. Lose that base and the recovery is negated outright.
The trade
Long, and from weakness rather than into the confluence. There is a real case for it. Settlement landed in the weekly range's top eleven percent, following a recovery of 6.21 percent. The 18-day average is reclaimed. Price holds over the proxy's gamma flip and its volatility inflection level both. Short gamma amplifies advances the moment resistance gives way. Hedging flow ran its strongest in thirty days, sourced from selling longer-dated puts and buying longer-dated calls rather than from short-dated speculation. And 58,298 contracts of fast-money short supply the mechanical fuel.
Set against all that, direction has confirmed nothing and the overhead is thick, which is why entry belongs at a defined shelf and not above one.
Entry runs 28,790 down to 28,700, spanning the daily pivot and sitting just under the 18-day average, which places it within the demand shelf instead of on top of it. Stop 28,560, under the whole retracement band and far enough back to survive a short-gamma sweep. Measured off a 28,745 midpoint, risk runs 185 points.
Objectives run to Monday's high, then to first pivot resistance with the 13-week retracement backing it, then the dual-method confluence. Roughly 1.2, 2.1 and 2.9 to one. Scale out at the first two and trail the balance toward the third.
Invalidation is acceptance beneath the zone where first pivot support meets the gamma flip equivalent. A fifteen-minute close under there voids the thesis, and averaging down into it is not an option.
The macro override supersedes the entire structure. Any headline concerning the Strait outranks every level on this map. Causally, everything Monday gained ties back to a de-escalation which Iranian military leadership refused publicly once the relief was already priced. Escalation appearing means exiting rather than managing, since short gamma will make any decline disorderly.
There is a conditional second plan for the other outcome. A fifteen-minute close above the top of the overhead band, taken on the retest and not on the break itself, with the stop back beneath the 20-day average so that being reached converts it into a failed breakout. Objectives at the 13-week retracement, the dual-method confluence and the 40-day average, roughly 1.0, 1.9 and 3.0 to one. The first offers thin compensation and should be treated as partial reduction only; the genuine objective is the second. It ranks under the pullback entry because it buys above the confluence instead of below, though short gamma lets a confirmed break extend quicker than any pullback entry gets filled, so carry it anyway.
Five conditions say stand aside. Gapping open over 29,150 with no pullback, since extending that far uncatalysed is chasing, and the upper confluence would be immediately in reach. Any escalation headline out of the Strait, because the causal premise inverts and technical levels stop being reliable. Acceptance beneath the gamma-flip zone at any point, which voids the long thesis and leaves reversal attempts for a later session once the market stabilises lower. An open directly inside the overhead confluence that stays there, because dense resistance offers no favourable entry and the right move is to wait on acceptance above it or rejection below it. And anything before 09:45 or after 16:00.
A data-light session with one real event
Tuesday carries no first-order American macro catalyst, and that absence is the calendar's most useful observation. Price discovery falls to positioning, to the overhead confluence and to headline flow.
Highest-impact scheduled release is job openings at ten, forecast 7.445 million where 7.594 came prior, and it is the only one that can move this index. With three officials having dissented toward a hike in July, stronger labour demand reads hawkish and presses on the long-duration end, while anything soft gets read as supportive. The sensitivity runs asymmetric toward the upside surprise. Factory orders arrive alongside and rank second-order, albeit a firm one would back up Monday's manufacturing strength. Trade balance at 8:30 is nothing.
Nothing on the economic calendar is genuinely first-order for this index. The semiconductor report after the close is, and a space-sector report goes at 16:00 alongside it. Landing after the bell makes it a Wednesday gap risk instead of a Tuesday intraday one, but afternoon positioning will run off it, and it explains why implied volatility firmed on Monday even as the market rallied.
Which gives the afternoon a predictable shape. Watch when short-dated call positioning gets closed out, because that is the moment hedging turns from damping to amplifying, and moves after it extend instead of reverting. Then expect the last two hours to be dominated by positioning ahead of a heavyweight chip report. Volatility firming at fixed strikes through Monday's rally says protection is already being bought into that event, which argues for cutting or closing intraday longs into the bell rather than carrying them, and which lowers the odds of a strong directional finish in either direction.
Overnight is thin and mostly irrelevant here. New Zealand employment, Japanese meeting minutes, purchasing surveys out of Australia and Japan, then Chinese services at 21:45 forecast 53.7 where 54.1 came before. Of those only the Chinese number reaches the technology supply chain at all, and even then second-order. What dominates overnight is Strait headlines, and they arrive on no schedule.
Base case at 45 percent is constructive resolution: price holds the 18-day average, gets through the overhead band across the morning, and short gamma accelerates it once clear, reaching first pivot resistance and possibly the 13-week retracement, then consolidating through the afternoon in the range's upper half. It requires no adverse Strait headlines. Thirty-five percent covers a contained range where the confluence caps repeated attempts and price rotates with the 18-day average as its intraday pivot, settling inside a hundred points of Monday, and absent a headline that is the single likeliest outcome. The last twenty percent is geopolitical reversal, where escalation inverts the whole causal chain. Crude rallies, yields go up with it, and short gamma turns the unwind disorderly instead of measured, losing the pivot then the gamma flip zone and testing the strongest structural reference below.
Behind Tuesday, employment change and services surveys land Wednesday alongside the full refunding, with storage, memory and mobility names reporting, and Friday's monthly employment report stands as the dominant macro event of the week. The same gamma flip and the same unmapped territory sit under the broad index, which we walked through level by level in our August 4 ES review.
The complete data picture
Every number behind Friday’s plan, charted first; the full numeric reference follows underneath.
Full numeric reference , every remaining figure from the review
| September settlement | 28,891.75, up roughly 487.50 points or 1.72 per cent |
| Cash index | 28,776.80, higher by 1.78 per cent |
| Week-to-date range | 28,313.50 to 28,964.25, a span of 650.75 points; settle at 88.9 per cent |
| Session shape | opened 28,565.00 Sunday evening, sold to 28,313.50, reached 28,964.25 |
| Friday's settle | 28,404.25 |
| Three-session recovery | 1,690.25 points or 6.21 per cent from the July 29 low at 27,201.50 |
| Evening reopen | opened 28,930.00, band 28,919.00 to 28,950.00, last near 28,940 on 574 contracts |
| Open interest | 288,821 contracts |
| Five sessions | up 701.75 points, or 2.49 per cent |
| Month to date | down 2.25 per cent since July 2 |
| Hundred days | up 13.67 per cent |
| Fifty-two weeks | up 21.28 per cent |
| 52-week high | 31,100.00 on June 3, price 7.10 per cent below |
| 52-week low | 23,170.50 on March 31, price 24.69 per cent above |
| One-month high | 30,094.00 on July 6, 1,202.25 points overhead |
| One-month low | 27,201.50 on July 29, three sessions ago |
| 5-day | 28,159.55, price 732.20 above |
| 9-day | 28,236.34, price 655.41 above |
| 18-day | 28,832.78, price 58.97 above |
| 20-day | 28,947.71, price 55.96 below |
| 40-day | 29,426.28, price 534.53 below |
| 50-day | 29,640.96, price 749.21 below |
| 100-day | 28,111.79, price 779.96 above |
| 200-day | 27,023.31, price 1,868.44 above |
| Year-to-date | 27,367.94, price 1,523.81 above |
| The pin | the 18-day and 20-day are separated by only 114.93 points, with price settled between them |
| Raw stochastic | 9-day 78.96 per cent, 14-day 59.08, 20-day 58.77, 50-day 43.36, 100-day 72.15 |
| Stochastic fast line | 9-day 60.82, 14-day 45.78, 20-day 44.53, 50-day 33.60, 100-day 67.35 |
| Stochastic slow line | 9-day 40.15, 14-day 30.50, 20-day 28.96, 50-day 22.35, 100-day 62.33 |
| Relative strength | 9-day 52.44, 14-day 49.22, 20-day 48.87, 50-day 51.47, 100-day 53.08 |
| Direction, 9-day | strength 40.42, positive 14.59 against negative 22.96 |
| Direction, 14-day | strength 29.51, positive 14.10 against negative 23.95 |
| Direction, 20-day | strength 21.48, positive 14.74 against negative 23.90 |
| Direction, 50-day | strength 9.87, positive 17.91 against negative 23.27 |
| Direction, 100-day | strength 7.35, positive 21.40 against negative 24.50 |
| Historic volatility | 9-day 26.00 per cent, 14-day 24.06, 20-day 23.26, 50-day 26.25, 100-day 23.37 |
| Composite | 8 per cent sell, strength good, direction weakening; short term 60 per cent sell, medium term 25 per cent buy, long term 67 per cent buy |
| Composite internals | negative: 20-day average versus price, 20-to-50 crossover, 20-day bands, 50-day average versus price, 7-day direction, trend signal. Positive: 10-to-8 channel, 20-to-100 crossover, 50-day parabolic, 100-day average versus price, 50-to-100 crossover |
| Average true range | 9-day 734.52 (2.54 per cent), 14-day 722.89 (2.50), 20-day 709.34 (2.46), 50-day 625.45 (2.16), 100-day 518.57 (1.79) |
| Average daily range | 9-day 744.28 (2.58 per cent), 14-day 717.20 (2.48), 20-day 686.38 (2.38), 50-day 709.18 (2.45), 100-day 597.89 (2.07) |
| One-range band | 28,168.86 to 29,614.64, or roughly 28,169 to 29,615, wider than any realistic single session absent a shock |
| September implied volatility | 23.04 per cent with 45 days to the September 17 expiry |
| Proxy volatility | one-month implied 22.59 per cent against realised 23.73 |
| Options-implied path | 1.40 per cent on the proxy, roughly plus or minus 405 points, giving 28,487 to 29,297 |
| 28,943.50 to 28,989.06 | the five-way band: Globex high 28,943.50, 20-day average 28,947.71, Monday's high 28,964.25, neutral momentum 28,971.10, 38.2 per cent off the four-week high 28,989.06 |
| 29,132.83 / 29,150.75 | first pivot resistance; 50 per cent of the 13-week range |
| 29,274.83 / 29,277 | the computed target price; the call-side gamma concentration equivalent, two points apart |
| 29,373.92 / 29,426.28 / 29,467.71 | second pivot resistance; the 40-day average; one deviation resistance |
| 29,610.77 / 29,640.96 | 38.2 per cent off the 13-week high; the 50-day average. The 29,426 to 29,641 zone is where a recovery rally must prove itself |
| 29,937.00 / 30,094.00 | extended reference; the one-month high, not in play on a single session |
| 28,891.75 / 28,919.00 | the settle itself; the Globex session low |
| 28,866 / 28,832.78 | the primary gamma concentration equivalent; the 18-day average |
| 28,632.00 to 28,723.17 | the four-way shelf: daily pivot 28,723.17, 38.2 per cent off the 13-week low 28,690.73, 50 per cent of the four-week range 28,647.75, neutral raw stochastic 28,632.00 |
| 28,482.08 / 28,496 | first pivot support; the dealer gamma flip equivalent |
| 28,313.50 to 28,332 | the week-to-date low, one deviation support at 28,315.79, the volatility inflection equivalent at 28,332, three references inside 19 points |
| 28,236.34 / 28,159.55 / 28,111.79 | the 9-day average; the 5-day; the 100-day |
| 28,070.93 to 28,077.22 | 61.8 per cent off the 52-week low; second pivot support 28,072.42; two deviation support 28,077.22 |
| 27,831.33 / 27,367.94 / 27,023.31 | third pivot support; the year-to-date average; the 200-day |
| 27,201 to 27,223 | the one-month and 13-week low at 27,201.50; the put-side gamma concentration equivalent |
| Model note | levels derive from a Nasdaq exchange traded fund proxy, computed from Friday's closes with the proxy referenced at 687 against Monday's actual close of 700.63 |
| Translation | a 41.07 index-to-proxy ratio and a 114.95 point futures basis |
| Call-side gamma | negative 443.2 million |
| Put-side gamma | negative 1.41 billion |
| Combined | roughly negative 1.85 billion; gamma tilt 0.843; gamma notional negative 244.053 million |
| Expirations | nearest gamma August 6, 2026; nearest delta June 16, 2027 |
| Ranks | implied volatility 52.67 per cent, skew 69.17 per cent, volatility-model 70.94 per cent |
| Options implied move | 9.81 dollars, or 1.40 per cent |
| Open interest | put to call 1.23; put volume 1.23 million against call volume 944,760 |
| Structural levels | call-side concentration 710 proxy, 29,277 futures; primary concentration 700, 28,866; gamma flip 691, 28,496; volatility inflection 687, 28,332; put-side concentration 660, 27,223 |
| Proxy close | 700.63, higher by 1.84 per cent, marginally above its primary concentration strike |
| Monday's mechanics | a 15,000-lot customer short same-day 7,590 broad-index call position supplied positive gamma through the morning; closed around 12:00 ET and replaced by roughly 8,000 lots at 7,610; that closed around 14:00 ET and gamma turned negative |
| Hedging flow | positive 14 billion dollars, the largest in thirty days, from roughly 10 billion of longer-dated put selling and 4 billion of longer-dated call buying |
| Single-name flow | a further 5.3 billion of bullish activity, roughly half in the largest technology constituents |
| Cash reference in the Friday model | the Nasdaq-100 cash close of 28,776.80 sits above the call-side concentration of 28,550 carried in that model, consistent with the observed gamma flip |
| Distance to the risk pivot | the broad index closed 121 points above the 7,480 level at which the desk would press shorts |
| Broader desk guidance | maintain equity longs while the broad index holds above a 7,480 risk pivot, with the index at 7,601; initiate one-month or longer index put-spread hedges |
| Commercials | 160,602 long (down 3,697) against 175,548 short (down 762), net negative 14,946 |
| Non-commercials | 81,531 long (up 7,468) against 76,617 short (up 7,100), net positive 4,914 |
| Dealers and intermediaries | 54,481 long (down 16,787) against 82,062 short (up 5,094), net negative 27,581 |
| Asset managers | 106,927 long (up 2,263) against 30,168 short (down 1,871), net positive 76,759 |
| Fast-money funds | 61,233 long (up 14,889) against 119,531 short (down 1,503), net negative 58,298 |
| Other reportables | 10,354 long (up 1,789) against 11,266 short (up 3,001), net negative 912 |
| July policy meeting | held 9 to 3, all three dissents favouring a 25 basis point increase |
| Ten-year yield | down five basis points to 4.68 per cent, driven by energy rather than policy expectations |
| July manufacturing | 55.6 against a 53.9 consensus and 53.3 prior, employment 52.8 from 49.7, prices paid 71.1 from 73.0 |
| Construction spending | negative 0.1 per cent against a positive 0.2 per cent forecast |
| Treasury | marketable borrowing estimates released 15:01 ET, full refunding announcement Wednesday |
| Currency | suspected yen intervention July 30 and 31; the Bank of Japan reported open to raising faster than its recent six-month cadence |
| Leadership | two of the top weights up 4.88 and 4.93 per cent, the electric-vehicle constituent up 3.49, one constituent crossing three trillion dollars in market value |
| Semiconductor complex | a memory and storage constituent up 6 per cent with weekly calls near 230 per cent implied ahead of Wednesday evening earnings |
| Software | the sector fund up 3 per cent to close at 97, completing a breakout, dealer gamma negative across much of its strikes, upside references at 100 |
| After the close Monday | a data analytics constituent beat on revenue and earnings with United States commercial revenue up 150 per cent year over year, trading around 142, up roughly 13 per cent against a 10 per cent implied move |
| July 22 policy line | standing commentary established that any Iranian attack on Strait shipping would be met with strikes on infrastructure |
| Supply chain | a major mobile chipset supplier told customers in late July that prices would rise by a double-digit percentage |
| Volatility complex | the equity volatility index settled 15.87, a sub-16 print alongside a 90-plus volatility-of-volatility reading, which says spot volatility is cheap while the market pays up for convexity; fixed-strike volatility rose one to seven points across the curve |
| Cross-asset | crude near 80.20 in the evening, gold little changed near 4,051.25, the broad index closed 7,601 higher by 1.5 per cent inside a 140 basis point range |
| 08:30 ET | United States trade balance, forecast negative 73.0 billion against negative 77.6 billion |
| 08:30 ET | Canadian trade balance, forecast 3.0 billion against 4.24 billion |
| 09:30 ET | Canadian manufacturing survey, prior 53.0 |
| 10:00 ET | factory orders, forecast positive 0.2 per cent against negative 1.3 per cent |
| 10:00 ET | job openings, forecast 7.445 million against 7.594 million, the highest-impact scheduled release |
| 16:00 ET | space-sector second-quarter earnings, after the close |
| After the close | a major semiconductor constituent, the single most important scheduled event for this index |
| 18:45 / 19:50 ET | New Zealand employment; Bank of Japan meeting minutes |
| 21:45 ET | Chinese services, forecast 53.7 against a 54.1 prior |
| Week ahead | employment change 08:15 Wednesday, services surveys 10:00 and the full refunding; the monthly employment report Friday |
| Entry | 28,790 to 28,700, spanning the daily pivot and sitting just beneath the 18-day average |
| Stop | 28,560, beneath the entire 28,632 to 28,690 retracement band with buffer for a negative-gamma sweep |
| Target 1 | 28,964, reward 219 points, roughly 1 to 1.2 |
| Target 2 | 29,133, reward 388 points, roughly 1 to 2.1 |
| Target 3 | 29,275, reward 530 points, roughly 1 to 2.9 |
| Risk | 185 points from a 28,745 midpoint |
| Invalidation | a fifteen-minute close beneath the 28,482 to 28,497 zone; do not average down into it |
| Macro override | any Strait headline supersedes the structure; exit rather than manage |
| Trigger | a fifteen-minute close above 28,990, entered on the subsequent retest |
| Entry | 28,995 to 29,020 |
| Stop | 28,870, beneath the 20-day average and the confluence band |
| Target 1 | 29,151, reward 141 points, roughly 1 to 1.0, partial reduction only |
| Target 2 | 29,275, reward 265 points, roughly 1 to 1.9, the genuine objective |
| Target 3 | 29,426, reward 416 points, roughly 1 to 3.0 |
| Risk | approximately 140 points from a 29,010 entry |
| Path A, 45 per cent | holds above 28,832, works through 28,943 to 28,990, negative gamma accelerates toward 29,133 and possibly 29,151; settles 29,050 to 29,175 |
| Path B, 35 per cent | the confluence caps repeated attempts, rotation between 28,650 and 28,975 with the 18-day average as intraday pivot; settles within 100 points of Monday |
| Path C, 20 per cent | escalation reverses the causal chain; loses 28,723, then 28,482 to 28,497, tests 28,313 to 28,332 |
| Expected range, low band | 28,480 to 28,650 |
| Most-likely core | 28,700 to 29,050 |
| High band | 29,150 to 29,280 |
| Overnight band | 28,750 to 29,050, invalidated entirely by a geopolitical headline |
| Opening range test | acceptance above 28,990 establishes the constructive path; failure reversing beneath 28,891.75 establishes the corrective path; a gap above 29,150 should be faded on the first attempt |
| Skip | a gap open above 29,150 without a pullback; any Strait escalation headline; acceptance beneath 28,482 at any point; an open directly inside 28,943 to 28,990 that remains there; anything before 09:45 or after 16:00 ET |



