
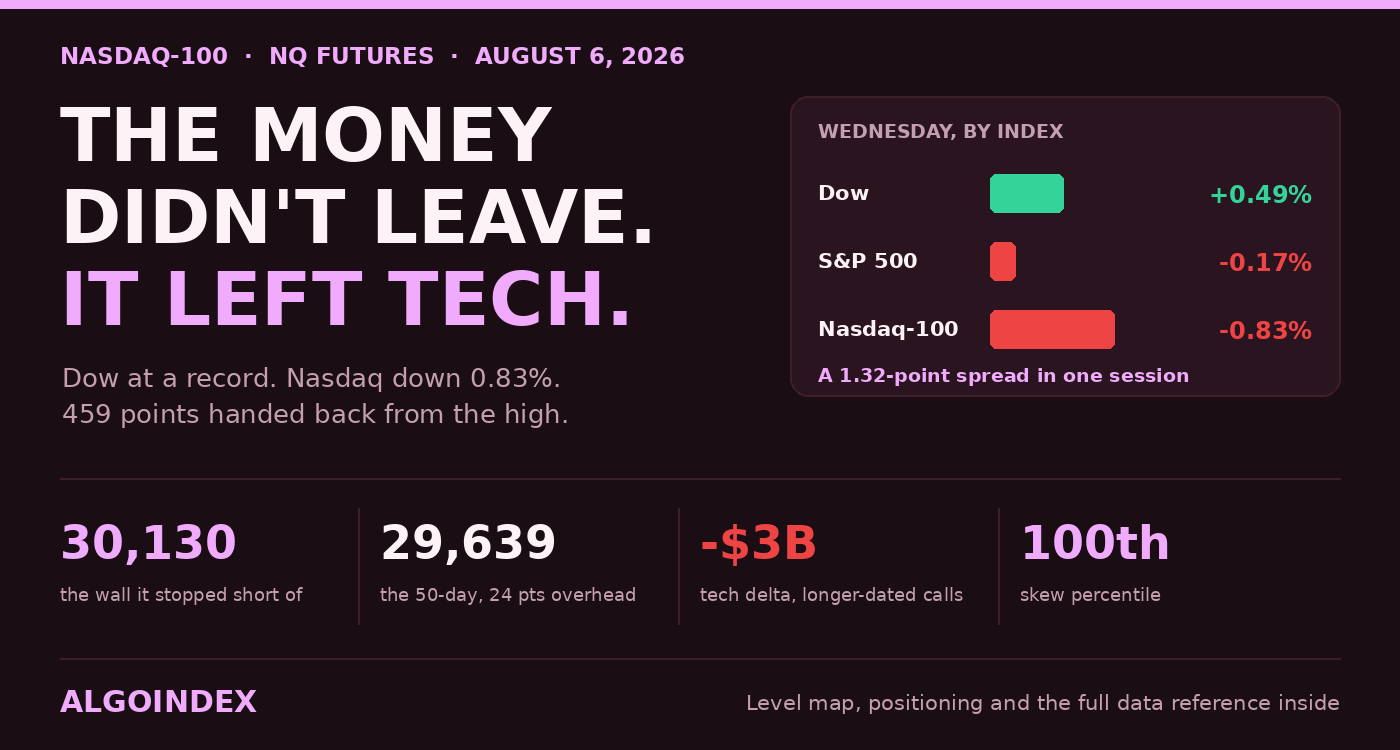
The September contract traded 30,074 on Wednesday, the highest print in five sessions, and settled 459 points underneath it at 29,615. On the same afternoon the Dow closed at a record. Money didn't leave the market. It left technology.
Closing in the bottom 15.5 per cent of the daily range tells you whoever seized control after lunch never gave it back.
What broke it
Semiconductors, first. A leading American chip designer dropped about 7 per cent after third-quarter sales guidance came in under what buyers of the AI capital-expenditure story had already paid for, and the weakness spread through the complex. Another large-cap name adjacent to the AI trade lost better than 13 per cent, on higher projected spending of its own.
Then the governance news, which arrived all at once. One mega-cap search platform lost the chief scientist it had kept for 27 years, off to launch a venture, and changed the chief executive of its AI research unit. A hyperscaler disclosed that roughly 70 per cent of its AI revenue traces to a single model developer, that customer contributing 24.1 billion dollars in fiscal 2026.
Any one of those is digestible on its own. Arriving together, the AI trade stops being an unquestioned growth engine and becomes one carrying visible customer concentration and key-person exposure. That reframing is exactly what turns a one-month high into a reversal.
Fifty-five points short of the wall
Wednesday's high stopped just under the most important number on the board.
At 30,127 to 30,130 in futures terms sits the equivalent of the 30,000 cash strike. That strike doubles as the call-side dealer wall and as the primary options concentration in the current book. When two separate positioning measures settle on one round number is roughly the strongest resistance signature this market produces, and price ran out of buyers roughly 55 points beneath it.
Underneath, the strike ladder runs 29,627, then 29,127, then 28,677 in futures terms. The first of those deserves attention: 29,627 lands inside twelve points of a 29,615 settle and a 50-day of 29,639. Three independent measures packed into twenty-five points, and Thursday opens straight into them.
One average overhead, and it is the one that counts
Price closed above the 5-day, the 20-day, the 100-day and the 200-day. It closed 24 points under a 50-day of 29,639.
That single exception is the pivot Thursday resolves first. Trade sustained above it puts the burden back on sellers, and 29,740, the computed pivot, comes into play. Get rejected there and Wednesday's reversal is confirmed, and the 50-day becomes resistance, which it has not been at any point in this July recovery.
Below, the 40-day crossing at 29,435 is the final short-horizon average sitting under price. Lose that and the next equivalent reference is the 18-day zone down at 28,831, which is a lot of empty space.
The trend exists on one timeframe only
Nine-day directional strength reads 35.59, positive direction 26.03, negative 17.72. Genuinely trending.
Widen the window and it dissolves. Fourteen days gives 25.83 with the two lines nearly touching, 22.00 against 20.26. Twenty days gives 19.66 with negative direction already above positive, 21.23 to 20.44. Fifty days has negative on top again.
So the accurate description of the past week is a five-session surge, 2,273 points and 8.31 per cent off the 29 July low, sitting inside a three-week downtrend that hasn't actually turned.
Relative strength didn't confirm the extension either. Fourteen-day sits at 54.95, having shed 2.43 across the session. Here is the number worth carrying: the price that puts that reading at a neutral 50 is 29,076. Another 539 points of decline from the settle still would not make this technically oversold. That is a great deal of room, and it argues against expecting any quick bounce should 29,400 give way.
Where the selling actually showed up
This is the most directionally useful item in the whole review, and it requires holding two numbers side by side.
Broad-index hedging flow finished Wednesday at roughly positive 2 billion dollars of customer delta, made up of about 5 billion in put selling against 3 billion in call selling, overwhelmingly same-day expiry. That is volatility sellers harvesting the fat premium, and it mechanically damps intraday movement.
Technology-specific flow finished at roughly negative 3 billion, driven by longer-dated call selling.
Those aren't the same thing wearing different labels. Short-dated premium selling stabilises a session. Longer-dated call supply is a directional statement about upside conviction over weeks, not hours. When one index is being held steady by same-day flow while the other is being sold further out the curve, the second one is where the exposure sits.
Skew in the Nasdaq proxy prints right at the 100th percentile of where it has traded. Extended, rejected at a positioning wall, with the call side crowded is not a mix that resolves upward unless something fresh turns up.
Options are underpricing the movement
Average true range over fourteen days is 736.71 points. The options-implied one-day move works out near 435.
The proxy carries an implied move of 10.52 dollars against a 716.86 close, about 1.468 per cent. One-month realised volatility in that proxy reads 26.14 per cent against implied of 23.04. Both comparisons say the same thing from opposite ends: options cost less than this contract has been delivering.
Note also that nine-day range readings sit above the fourteen and twenty-day on both measures. Realised volatility expanded through the recovery instead of compressing into it, unusual behaviour for a rally, and consistent with how much of this move was short covering. When short-window volatility rises and price gets turned away at the upper edge of its range, overnight gaps tend to widen.
How to trade it
Fade rallies into the 29,740 through 29,950 band, scaling rather than committing at one price. That band runs from the computed pivot up to the first computed resistance, and the 50-day underneath it serving as the failed-reclaim marker.
Don't chase a short under 29,700. Should the open come in weak and never climb back into that zone, sit out and take the next session instead.
Stop 30,090, above Wednesday's high and beneath the one-month high at 30,094, so invalidation lands beyond the swing high instead of at some arbitrary distance. From a 29,850 average that is 240 points. Take a third at 29,406 where the first computed support meets the 40-day zone, a third at 29,197 where the 50 per cent retracement at 29,151 and a 29,000 cash strike equivalent of 29,127 thicken the area into a band, and run the last third toward 28,895 only if the morning trended. Roughly 1.85, 2.7 and 4.0 to one.
A half-hour close above 30,094 ends the structure. Treat it as an instruction to go flat and reassess, not to reverse. A reclaim of 29,740 that holds an hour with semiconductors leading higher weakens the setup materially even without touching the stop, and the long side then lives between 30,094 and 30,130, or wherever a retest of 30,060 manages to hold, stop 29,930, targeting 30,283 then 30,335 then 30,492.
Why Thursday is a positioning day
Nothing on the calendar's first-order for this index. Claims at 08:30 matter more than usual after Wednesday's payroll miss at 44,000 and a services employment sub-index in contraction at 47.4.
The line to actually watch is unit labour costs, forecast 2.1 per cent against 1.8 prior. Services prices paid on Wednesday accelerated to 70.3 where 65 was the forecast, and an upside surprise on labour costs extends precisely the rate repricing that pushed money out of long-duration technology to begin with. For an index carrying this much duration, that is the shortest path from a data point to the price.
Otherwise this is positioning into Friday's payrolls, and the 21 August expiry is the structural anchor capable of pinning everything if no catalyst turns up.
The five-session surge is real. So is the three-week downtrend it is sitting inside. Wednesday was the first session where the second one mattered more.
The broad index gave back a record on the same rotation, and it has the cushion this one lacks: ES / S&P 500: a record at 10am, gone by the bell.The complete data picture
Every number behind Friday’s plan, charted first; the full numeric reference follows underneath.
Full numeric reference , every remaining figure from the review
Full data reference
Every figure behind the analysis above. NQ September 2026 contract, session of Wednesday 5 August 2026, prepared for Thursday 6 August. Futures terms, basis of positive 127 points to cash.
| Reference | Value |
|---|---|
| Contract | September 2026 Nasdaq-100 E-mini, NQU26 |
| Settlement | 29,615.00, down roughly 0.90 per cent |
| Session high | 30,074.00, the highest trade in five sessions |
| High-to-settle reversal | 459 points |
| Closing range | bottom 15.5 per cent of the day |
| Cash index close | 29,487.79, down 0.83 per cent |
| Basis to cash | positive 127 points |
| Dow | a fresh record close |
| Broad benchmark | down 0.17 per cent from its own record |
| Five-session advance | 2,273 points, 8.31 per cent off the 29 July low at 27,201.50 |
| Reference | Value |
|---|---|
| 3rd computed resistance | 30,492, a projection without structural memory |
| Combination strike | 30,417 |
| 1 deviation of resistance | 30,335, computed off the last five closes |
| 2nd computed resistance | 30,283 |
| Combination strike | 30,209 |
| Call-side wall and primary concentration | 30,127 to 30,130, the 30,000 cash strike |
| One-month high | 30,094.00, from 6 July |
| Wednesday's high | 30,074.00 |
| Computed target price | 30,060 |
| Combination strike | 30,001 |
| 1st computed resistance | 29,949 |
| Combination strike | 29,793 |
| Computed pivot | 29,740 |
| 50-day average | 29,639, only 24 points above the close |
| The 29,500 cash strike | 29,627 |
| Reference | Value |
|---|---|
| Wednesday settlement | 29,615 |
| 38.2 per cent off the 13-week high | 29,611, within four points of the settle |
| 18-day average stall | 29,476 |
| 40-day average crossing | 29,435 |
| 1st computed support | 29,406 |
| 2nd computed support | 29,197 |
| 50 per cent of the 13-week span | 29,151 |
| The 29,000 cash strike | 29,127 |
| Where 14-day strength falls to 50 | 29,076 |
| 1 deviation of support | 28,895 |
| 3rd computed support | 28,863 |
| 18-day average crossing | 28,831 |
| The 28,550 cash strike | 28,677 |
| Dealer gamma flip and volatility inflection | roughly 28,667 to 28,690 |
| Put-side wall | 28,127, the 28,000 cash strike |
| Reference | Value |
|---|---|
| 5-day | 29,002.45, price above by 613 |
| 20-day | 28,978.64, price above by 636 |
| 50-day | 29,639.37, price BELOW by 24 |
| 100-day | 28,208.36, price above by 1,407 |
| 200-day | 27,064.83, price above by 2,550 |
| 40-day crossing projection | 29,434.90 |
| 18-day crossing projection | 28,831.04 |
| Reference | Value |
|---|---|
| 9-day relative strength | 59.57 |
| 14-day relative strength | 54.95, down 2.43 on the session |
| 20-day relative strength | 53.20 |
| 50-day relative strength | 53.38 |
| 100-day relative strength | 54.14 |
| Price that puts 14-day at 70 | 32,343.83 |
| Price that puts 14-day at 50 | 29,076.28, some 539 points below the settle |
| 9-day directional | index 35.59, positive 26.03, negative 17.72 |
| 14-day directional | index 25.83, positive 22.00, negative 20.26 |
| 20-day directional | index 19.66, positive 20.44, negative 21.23 |
| 50-day directional | index 9.65, negative above positive |
| Multi-indicator composite | 40 per cent buy, trend signal on hold |
| Composite split | 40 per cent short-term, 25 per cent medium, 67 per cent long |
| Composite yesterday | 56 per cent buy |
| Composite one week ago | 72 per cent sell |
| Composite one month ago | 8 per cent sell |
| Reference | Value |
|---|---|
| 9-day true range | 751.81 points, 2.54 per cent |
| 14-day true range | 736.71 points, 2.49 per cent |
| 20-day true range | 720.76 points, 2.43 per cent |
| 50-day true range | 633.59 points, 2.14 per cent |
| 9-day average daily range | 791.81 points, 2.67 per cent |
| 14-day average daily range | 737.48 points, 2.49 per cent |
| 20-day average daily range | 699.14 points, 2.36 per cent |
| Historic volatility 9-day | 29.21 per cent |
| Historic volatility 14-day | 27.43 per cent |
| Historic volatility 20-day | 25.54 per cent |
| Historic volatility 50-day | 27.34 per cent |
| One-ATR band | 28,878 to 30,352 |
| Proxy implied one-day move | 10.52 dollars against a 716.86 close, 1.468 per cent |
| Options-implied band | roughly 29,180 to 30,050, about 435 points |
| Proxy one-month realised | 26.14 per cent |
| Proxy one-month implied | 23.04 per cent |
| Reference | Value |
|---|---|
| Call-side wall | cash 30,000, futures roughly 30,127 |
| Primary concentration strike | cash 30,000, the same strike, double weight |
| Put-side wall | cash 28,000, futures roughly 28,127 |
| Dealer gamma flip | cash 28,562 |
| Volatility inflection | cash 28,540 |
| Strike ladder, cash | 30,000, 29,500, 29,000, 28,550 |
| Strike ladder, futures | 30,127, 29,627, 29,127, 28,677 |
| Combination strikes, cash | 30,001, 30,209, 29,793, 30,417 |
| Convergence window | 29,615 settle, 29,627 strike, 29,639 average, inside 25 points |
| Reference | Value |
|---|---|
| Close | 716.86 dollars, down 0.94 per cent from 723.68 |
| Call-side wall | 735 dollars |
| Put-side wall | 660 dollars |
| Primary concentration | 700 dollars |
| Volatility inflection | 705 dollars |
| Flip level | 706 dollars |
| Spot above the flip zone | roughly 11 points |
| Decline that reaches the flip zone | about 1.5 per cent |
| High-volatility point | 724 dollars, essentially Tuesday's close |
| Positioning skew | 100th percentile |
| Reference | Value |
|---|---|
| Broad index customer delta | roughly positive 2 billion dollars |
| Composition | about 5 billion of put selling against 3 billion of call selling |
| Dominant expiry | same-day contracts |
| Technology index customer delta | roughly negative 3 billion dollars |
| Technology composition | primarily longer-dated call selling |
| Broad-index implied volatility | down roughly 0.2 to 1.5 points at most strikes |
| Broad index risk pivot | raised to 7,680 against a 7,724 close, 44 points of buffer |
| Desk approach | reduce long exposure, hold cheap short-dated downside |
| Structural anchor | the 21 August expiration |
| Desk edition published | 17:23 ET, 5 August |
| Reference | Value |
|---|---|
| Leading chip designer | down about 7 per cent on third-quarter sales guidance |
| Large-cap AI-adjacent name | down more than 13 per cent on higher projected AI spending |
| Mega-cap search platform | lost its chief scientist of 27 years; AI research unit changed chief executive |
| Hyperscaler disclosure | one model developer is roughly 70 per cent of its AI revenue, 24.1 billion dollars in fiscal 2026 |
| Private payrolls | 44,000 |
| Services employment sub-index | 47.4, in contraction |
| Services prices paid | 70.3 against 65 expected |
| Reference | Value |
|---|---|
| Entry zone | 29,740 to 29,950, scaling in |
| Do not chase | beneath 29,700 |
| Stop | 30,090, structural |
| Risk from a 29,850 average | 240 points |
| Target 1 | 29,406, 444 points, roughly 1:1.85, take one third |
| Target 2 | 29,197, 653 points, roughly 1:2.7, take one third and move the stop to entry |
| Target 3 | 28,895, 955 points, roughly 1:4.0, runner only |
| Invalidation | any 30-minute close above 30,094; be flat and reassess |
| Weakening condition | a reclaim of 29,740 held over an hour with semiconductor leadership positive |
| Reference | Value |
|---|---|
| Entry zone | 30,094 to 30,130, or a retest of 30,060 that holds |
| Stop | 29,930 |
| Target 1 | 30,283, the second computed resistance |
| Target 2 | 30,335, one deviation of resistance |
| Target 3 | 30,492, the third computed resistance |
| Time | Event |
|---|---|
| 02:00 | German industrial orders, 0.5 per cent against 1.9 |
| 03:00 | Swiss unemployment adjusted, 3.1 per cent |
| 04:00 | Italian industrial production, 0.3 per cent against minus 0.3 |
| 04:30 | UK construction survey, 40 against 38.4 |
| 05:00 | Eurozone retail sales, 1 per cent annual against 1.6 |
| 08:30 | Initial claims 205,000 against 197,000 |
| 08:30 | Unit labour costs preliminary, 2.1 per cent against 1.8 |
| 08:30 | Productivity preliminary, 0.6 per cent against 0.3 |
| 10:00 | Wholesale inventories revised, 0.3 per cent |
| 17:30 | A Federal Reserve speaker, after the close |
| Reference | Value |
|---|---|
| Session low | near 29,530 |
| Full session span | roughly 545 points, 1.84 per cent high to low |
| Against the 14-day average daily range | well inside 737 points |
| Globex reopen | 29,569.50, band 29,563.50 to 29,596.50 |
| Advance off the 29 July low | 2,873 points to Wednesday's high |
| 52-week high | 31,100.00, set 3 June |
| Below the 52-week high | 4.77 per cent |
| 52-week low | 23,170.50, set 31 March |
| Above the 52-week low | 27.81 per cent |
| 38.2 per cent retracement, 13-week | 29,610.77, essentially the settle |
| 50 per cent retracement, 13-week | 29,150.75 |
| Intermediate higher low | 28,313.50, Monday's weekly low |
| Change-of-character trigger | a 4-hour close below 29,400 |
| Month-to-date since 2 July | up only 0.20 per cent despite the 8.31 per cent five-day surge |
| Fifth new 5-day high | in as many sessions |
| Reference | Value |
|---|---|
| 9-day raw | 84.02 per cent, %K 86.53, %D 74.80 |
| 14-day raw | 84.02 per cent, %K 79.91, %D 63.87 |
| 50-day raw | 61.91 per cent, only modestly stretched |
| Reference | Value |
|---|---|
| Commercials | long 160,602 (-3,697), short 175,548 (-762) |
| Dealers and intermediaries | long 54,481 (-16,787), short 82,062 (+5,094) |
| Asset managers | long 106,927 (+2,263), short 30,168 (-1,871) |
| Fast-money funds | long 61,233 (+14,889), short 119,531 (-1,503), net short 58,298 |
| Other reportables | net figures reduced on both sides |
| Open interest | 300,453 contracts |
| Reference | Value |
|---|---|
| Gold | up 4 per cent, around 4,247 |
| Volatility index | near 15.82, down about 4 per cent |
| Volatility-of-volatility | near 90.4, down about 2 per cent |
| Private payrolls | 44,000 against 65,000 expected, 98,000 prior |
| Services employment | 47.4 against 51.2 expected |
| Services headline | 54.1 against 54.5 expected |
| Services prices paid | 70.3 against 65 expected, 67.7 prior |
| Friday payrolls forecast | 80,000 against 57,000 prior |
| Friday private payrolls forecast | 80,000 against 49,000 prior |
| Bank preview | payrolls 80,000, private payrolls 95,000 |
| Claims stand-aside thresholds | above 235,000 or below 180,000 |
| Aerospace target cut | to 235 from 255 |
| Storage manufacturer short puts | the 1,000 to 1,300 area |
| Polysilicon tariff level discussed | at least 15 per cent |
| Continued claims | 1.7895 million against 1.782 million |
| Reference band around the settle | 29,410 to 29,680 as the near shelf, 28,300 to 28,558 deeper |
| Session reference points | 29,150, 29,530, 29,560, 29,600 |
| Wednesday capture window | between 18:35 and 19:00 ET |
| Year-to-date average | 27,399.77, price above by 2,215 points |
| Five-day performance arithmetic | period open 27,342.00 on 29 July, change of positive 2,273.00 |
| Estimated call gamma | negative 781.11 million |
| Estimated put gamma | negative 1.41 billion |
| Claims stand-aside, restated | a print above 230,000 or below 180,000 repositions the labour narrative |
| Satellite-name positioning | between the 90 and 105 strikes, including a roughly 45,000-lot short put at 95 |
| Adjacent strike references | the 108, 120 and 150 areas; a 400-point reaction band; 12 and 16 point convergences |
| Intermediate higher low, restated | 28,313 on the weekly chart |
| Bank payroll preview detail | 80,000 headline, 95,000 private, unemployment 4.2 per cent |
| Composite instability | 40, 45 and 84 per cent readings across recent sessions |
| Proxy prior close | 723.68 dollars, a 0.94 per cent decline |
| 50-day to computed pivot | within 101 points of each other |
| Opening-range stand-aside | an opening range exceeding 250 points |
| Stochastic characterisation | readings in the mid-80s with %K above %D |
| Call skew, desk note | the 98th percentile across the major index funds |



